'''''''''''''''''''''''''''''''''''''''''''''''''''''''''''''''''''''''''''''''''''''''''''''''''''
>>文件: 双层直方图.py
>>作者: liu yang
>>邮箱: liuyang0001@outlook.com
>>博客: www.cnblogs.com/liu66blog

'''''''''''''''''''''''''''''''''''''''''''''''''''''''''''''''''''''''''''''''''''''''''''''''''''

#!/usr/bin/env python
# -*- coding: utf-8 -*-
import matplotlib
import matplotlib.pyplot as plt
# 指定字体,防止
font=matplotlib.font_manager.FontProperties(fname=r"C:WindowsFontsDeng.ttf")

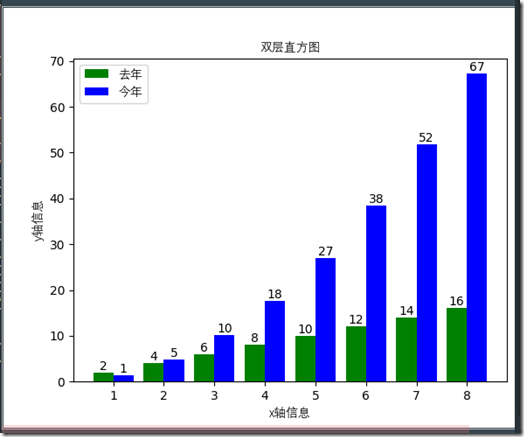
# 双层直方图
def barsplot():
    # 先生成一个画布
    fig=plt.figure()
    # 生成数据
    x1=[x-0.2 for x in range(1,9)]
    y1=[n*2 for n in range(1,9)]
    x2=[x+0.2 for x in range(1,9)]
    y2=[x**2 for x in x2]
    # 开始画条形图1
    l1=plt.bar(x1,y1,color='g',width=0.4)
    # 开始画条形图2
    l2=plt.bar(x2,y2,color='b',width=0.4)
    # 显示画的图
    plt.xlabel('x轴信息',fontproperties=font)
    plt.ylabel('y轴信息',fontproperties=font)
    plt.title('双层直方图',fontproperties=font)
    plt.legend(handles = [l1, l2,], labels = ['去年', '今年'], loc = 'best',prop=font)
    for x1,x2, y1, y2 in zip(x1,x2, y1, y2):
        plt.text(x1 , y1, '%.0f' % y1, ha='center', va='bottom')
        plt.text(x2 , y2, '%.0f' % y2, ha='center', va='bottom')
    plt.show()

# 如果最为主模块运行
if __name__ == '__main__':
    # 实例化
    ba=barsplot()
