doc
http://nvd3-community.github.io/nvd3/examples/documentation.html
https://github.com/mbostock/d3/wiki
http://pkuwwt.gitcafe.io/d3-tutorial-cn/about.html
example
http://nvd3.org/livecode/index.html
unix timestamp不能格式化?
apparently, d3 uses 13 digits unix timestamp (including microseconds) and you have 10 digits unix timestamp. try doing this:

.tickFormat(function(d) { return d3.time.format('%x')(new Date(d*1000)) });
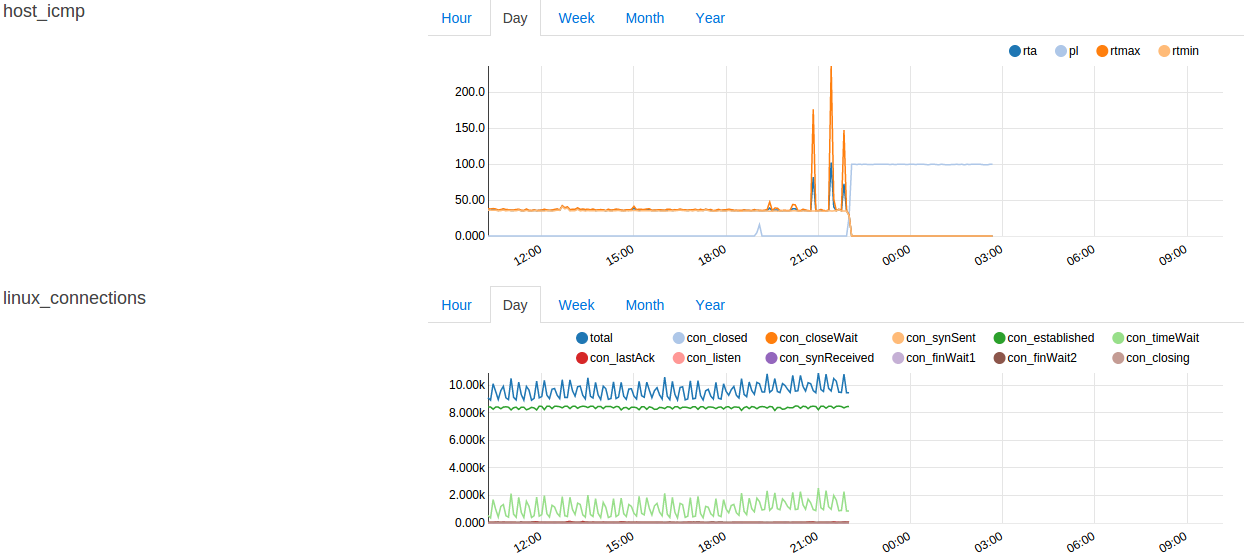
效果图

{% extends "base.html" %}

{% block title %}graph{% endblock %}

{% block head %}
{{ super() }}
<link rel="stylesheet" href="{{ url_for('static', filename='css/nv.d3.css') }}">
<script src="{{ url_for('static', filename='js/d3.min.js') }}"></script>
<script src="{{ url_for('static', filename='js/nv.d3.min.js') }}"></script>
{% endblock %}

{% block body %}
<div class="uk-grid" style="margin:10px;">

{% for service in services %}
    <div class="uk-width-1-3">
    <strong>{{ service }}</strong>
    </div>

    <div class="uk-width-2-3">
        <ul class="uk-tab" data-uk-tab>
            <li class="uk-active" id="{{ service }}-hour"><a href="#">Hour</a></li>
            <li id="{{ service }}-day"><a href="#">Day</a></li>
            <li id="{{ service }}-week"><a href="#">Week</a></li>
            <li id="{{ service }}-month"><a href="#">Month</a></li>
            <li id="{{ service }}-year"><a href="#">Year</a></li>
        </ul>
    	<svg id="{{ service }}" style='height:250px'/>
    </div>
{% endfor %}

</div>

<script type="text/javascript">
$(function() {
    $("svg").each(function(idx, data) {
        var hostname = "{{ hostname }}";
        var service = $(this).attr('id');
        draw_graph(hostname, service, '-1h', '%H:%M');
    });

    $("li[id$=hour]").bind("click", function(){
        var hostname = "{{ hostname }}";
        var service = $(this).attr('id').split('-')[0];
        draw_graph(hostname, service, '-1h', '%H:%M');
    });

    $("li[id$=day]").bind("click", function(){
        var hostname = "{{ hostname }}";
        var service = $(this).attr('id').split('-')[0];
        draw_graph(hostname, service, '-1d', '%H:%M');
    });

    $("li[id$=week]").bind("click", function(){
        var hostname = "{{ hostname }}";
        var service = $(this).attr('id').split('-')[0];
        draw_graph(hostname, service, '-1w', '%b %d');
    });

    $("li[id$=month]").bind("click", function(){
        var hostname = "{{ hostname }}";
        var service = $(this).attr('id').split('-')[0];
        draw_graph(hostname, service, '-1m', '%b %d');
    });

    $("li[id$=year]").bind("click", function(){
        var hostname = "{{ hostname }}";
        var service = $(this).attr('id').split('-')[0];
        draw_graph(hostname, service, '-1y', '%b %d');
    });

    function draw_graph(hostname, service, period, xformat) {
        $.ajax({
            type: 'GET',
            url: "{{ url_for('api.rrd') }}",
            data: { 'hostname': hostname, 'service': service, 'period': period },
            dataType: 'json',
            success: function(data){
            nv.addGraph(function() {
                var chart = nv.models.lineChart()
                    .useInteractiveGuideline(true)
                    //.showLegend(false)
                    //.color(d3.scale.category20c().range())
                ;


                /*chart.tooltip
                    .headerFormatter(function(d) { return d3.time.format('%x')(new Date(d)); })
                    .valueFormatter(function(d){ return d3.round(d, 3); })
                ;*/

                chart.xAxis
                    //.axisLabel('Date')
                    .ticks(8)
                    .tickFormat(function(d) { return d3.time.format(xformat)(new Date(d)); })
                    .showMaxMin(false)
                    .rotateLabels(-30)
                ;

                chart.yAxis
                    //.axisLabel('Traffic')
                    .tickFormat(d3.format('.4s'))
                    //.tickFormat(function(d) { return d3.round(d, 3); })
                    .showMaxMin(false)
                ;

                chart.xScale(d3.time.scale())
                ;

                chart.yScale(d3.scale.linear())
                ;

                d3.select('#'+service)
                    .datum(data)
                    .transition()
                    .duration(0)
                    .call(chart)
                ;

                nv.utils.windowResize(function() { d3.select('#chart svg').call(chart) })
                ;

                return chart;
            });
            },
        });
    };
})
</script>

{% endblock %}