一,Mutilindex
MultiIndex表示多级索引,它是从Index继承过来的,其中多级标签用元组对象来表示。
1. 创建get_list自定义函数
作用:通过size参数传入获取值的个数。items则是列表中的所有元素。sample函数会自动在列表范围内随机选取数据。replace=False代表选取出来的数据唯一。replace=True代表选取出来的数据允许重复。
import pandas as pd
from datetime import datetime

#replace参数为True允许元素重复,为False则元素不重复

def get_list(items,size=10):
    return pd.Series(items).sample(n=size,replace=False).to_list()


city =["上海","北京","深圳","杭州","苏州","青岛","大连","齐齐哈尔","大理","丽江",
          "天津","济南","南京","广州","无锡","连云港","张家界"]

get_list(city)
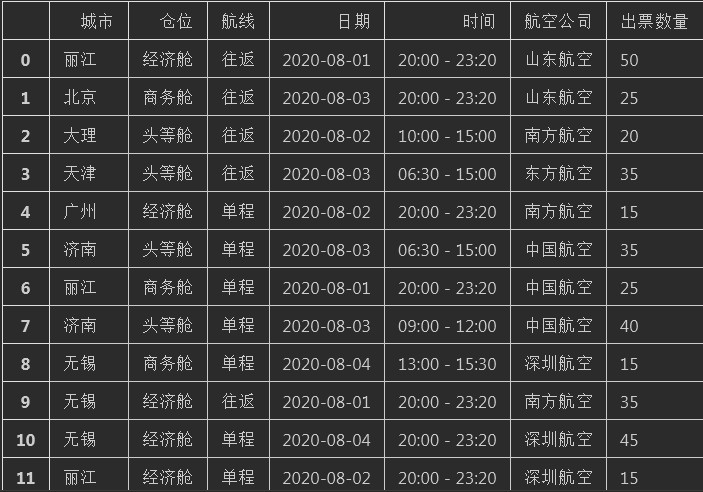
2. 通过自定义函数生成DataFrame数据
注释:DataFrame中的数据创建时通过dict字典来创建的。key为二维表格中的列名,values则为通过get_list函数生成的数据。
#通过函数创建DataFrame对象

def get_list(items,size=20):
    return pd.Series(items).sample(n=size,replace=True).to_list()

df = pd.DataFrame({
     "城市":get_list(city),
     "仓位":get_list(["经济舱","商务舱","头等舱"]),
     "航线":get_list(["单程","往返"]),
     "日期": get_list([datetime(2020,8,1),datetime(2020,8,2),
                     datetime(2020,8,3),datetime(2020,8,4)]),
     "时间": get_list(["09:00 - 12:00",
                        "13:00 - 15:30",
                        "06:30 - 15:00",
                        "18:00 - 21:00",
                        "20:00 - 23:20",
                        "10:00 - 15:00"]),
     "航空公司": get_list(["东方航空","南方航空","深圳航空","山东航空","中国航空"]),
     "出票数量":get_list([10,15,20,25,30,35,40,45,50,55,60]),
    })
df

#%%
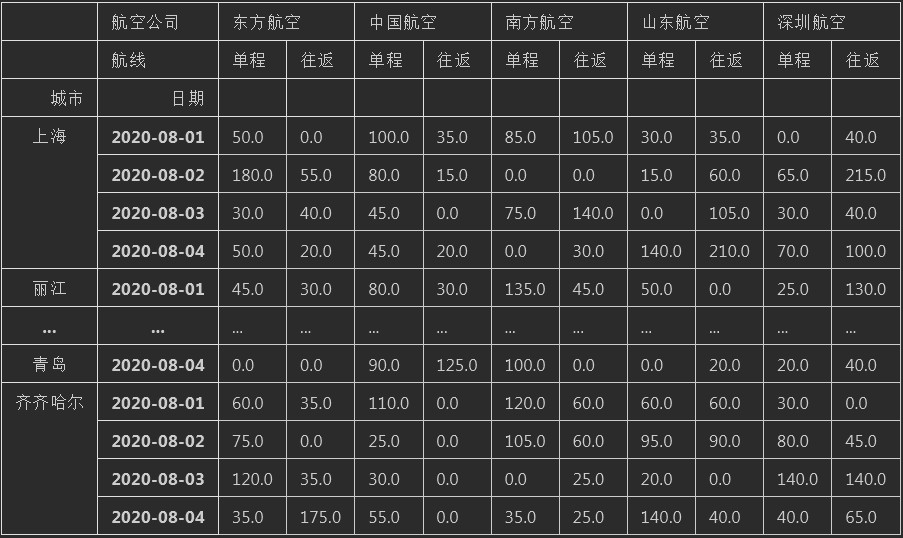
3. 通过Pivot_table 透视表对二维表格进行数据统计
注释:可以通过pivot_table函数把生成的二维表格作为参数传入,并对其指定index,columns,values及统计数据相关的函数(aggfunc=sum)。这样可以对数据进行进一步的过滤跟统计,达成我们的需求。
#%%

#可以根据数据随意指定行列,统计数据

def get_list(items,size=1000):
    return pd.Series(items).sample(n=size,replace=True).to_list()

df = pd.DataFrame({
     "城市":get_list(city),
     "仓位":get_list(["经济舱","商务舱","头等舱"]),
     "航线":get_list(["单程","往返"]),
     "日期": get_list([datetime(2020,8,1),datetime(2020,8,2),
                     datetime(2020,8,3),datetime(2020,8,4)]),
     "时间": get_list(["09:00 - 12:00",
                        "13:00 - 15:30",
                        "06:30 - 15:00",
                        "18:00 - 21:00",
                        "20:00 - 23:20",
                        "10:00 - 15:00"]),
     "航空公司": get_list(["东方航空","南方航空","深圳航空","山东航空","中国航空"]),
     "出票数量":get_list([10,15,20,25,30,35,40,45,50,55,60]),
    })

#通过pivot_table(t透视表)方法统计数据,日常数据统计中非常常用。
df01 = pd.pivot_table(
    df,
    index= ["城市","日期"],
    columns= ["航空公司","航线"],
    values= "出票数量",
    aggfunc= sum,
)

#将NaN的值全部转成0
df01 = df01.fillna(0)
df01

#%%
4. 将创建及统计好的数据保存到Excel中
df01.to_excel(R"C:UsersAdministratorPycharmProjectspython_BasicPandas_to_Excel20200804datasoutput_data1.xlsx",
              )
print("Done!!")