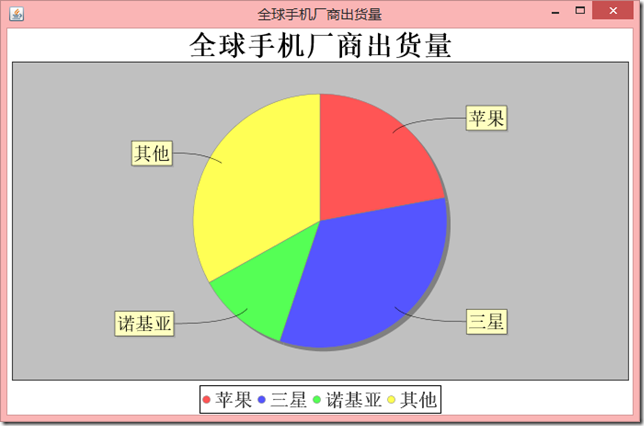
实例1:简单的饼图
public class Test {
	public static void main(String[] args) {
		//建立默认的饼图
		DefaultPieDataset ds=new DefaultPieDataset();
		ds.setValue("苹果",6000);
		ds.setValue("三星", 9000);
		ds.setValue("诺基亚",3200);
		ds.setValue("其他", 9000);

		//参数:1->标题 2-> 数据集 3->是否显示legend(在图的下方显示颜色块标注) 4->是否显示提示 5->图中是否存在url
		JFreeChart chart=ChartFactory.createPieChart("全球手机厂商出货量", ds, true, true, false);
		chart.getTitle().setFont(new Font("宋体", Font.BOLD, 30));
		chart.getLegend().setItemFont(new Font("宋体", Font.BOLD, 20));
		//PiePlot是图中饼图的上一级区域
		PiePlot plot=(PiePlot) chart.getPlot();
		plot.setLabelFont(new Font("宋体", Font.PLAIN, 20));
		//下面的标题是Frame的标题
		ChartFrame chartFrame=new ChartFrame("全球手机厂商出货量", chart);
		chartFrame.pack();
		chartFrame.setVisible(true);
	}
}
效果图:
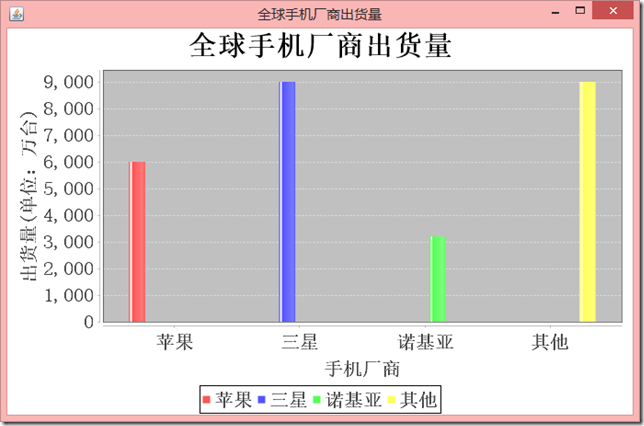
实例2:柱状图
public class Test2 {
	public static void main(String[] args) {
		DefaultCategoryDataset dataset = new DefaultCategoryDataset();
		dataset.setValue(6000, "苹果","苹果");
		dataset.setValue(9000, "三星", "三星");
		dataset.setValue(3200, "诺基亚", "诺基亚");
		dataset.setValue(9000, "其他", "其他");

		JFreeChart chart=ChartFactory.createBarChart("全球手机厂商出货量", "手机厂商", "出货量(单位:万台)",dataset,PlotOrientation.VERTICAL,true,true,false);
		chart.getTitle().setFont(new Font("宋体", Font.BOLD, 30));
		chart.getLegend().setItemFont(new Font("宋体", Font.BOLD, 20));
		//CategoryPlot是图中饼图的上一级区域
		CategoryPlot plot=chart.getCategoryPlot();
		//设置纵坐标-->前者是外围标识(出货量) 后者是坐标标识(手机厂商)
		plot.getRangeAxis().setLabelFont(new Font("宋体", Font.BOLD, 20));
		plot.getRangeAxis().setTickLabelFont(new Font("宋体", Font.BOLD, 20));
		//设置横坐标
		plot.getDomainAxis().setLabelFont(new Font("宋体", Font.BOLD, 20));
		plot.getDomainAxis().setTickLabelFont(new Font("宋体", Font.BOLD, 20));

		ChartFrame chartFrame=new ChartFrame("全球手机厂商出货量", chart);
		chartFrame.pack();
		chartFrame.setVisible(true);
	}
}
效果图
实例3:和Struts2的整合
1.导入strut2和JFreeChart的整合插件jar包
2.Action中为:public JFreeChart getChart(){}
3.Struts.xml文件中增加配置:
<action name="ChartOutputAction" class="chartOutputAction">
			<result name="success" type="chart">
				<param name="height">400</param>
				<param name="width">600</param>
			</result>
</action>
4.继承包
<package name="default" namespace="/" extends="struts-default,jfreechart-default">

