安装
https://github.com/akopytov/sysbench#build-and-install
github地址如上:
1.将安装包上传至/usr/local下
下载地址:https://github.com/akopytov/sysbench/archive/1.0.19.tar.gz
2.解压
tar zxf sysbench-1.0.17.tar.gz
3.安装依赖
yum -y install gcc gcc-c++ automake make libtool
4.编译
cd sysbench-1.0.17
./autogen.sh
mv sysbench-1.0.17 sysbench
./configure --prefix=/usr/local/sysbench/ --with-mysql --with-mysql-includes=/usr/local/mysql/include --with-mysql-libs=/usr/local/mysql/lib
make
make install
5.查看版本,如果此时报错
/usr/local/sysbench/bin/sysbench --version
/usr/local/sysbench/bin/sysbench: error while loading shared libraries: libmysqlclient.so.20: cannot open shared object file: No such file or directory
解决: ln -s /usr/local/mysql/lib/libmysqlclient.so.20 /usr/lib64
再次看版本,正常
测试
测试过程
测试分为三大阶段
- prepare阶段:建立测试表,填充测试数据
- run阶段:执行压力测试
- cleanup阶段:清理测试数据
测试类型支持fileio,cpu,memory,threads,mutex,sysbench也支持lua脚本,也自带了部分lua脚本,位于share/sysbench下。
1.测试
测试的sbtest数据库必须提前在测试的数据库手动创建
create database sbtest
【准备数据】
sysbench ./tests/include/oltp_legacy/oltp.lua --mysql-host=10.1.2.65 --mysql-port=3306 --mysql-user=root --mysql-password=xxxx --oltp-test-mode=complex --oltp-tables-count=5 --oltp-table-size=100 --threads=10 --time=120 --report-interval=10 prepare
- mysql-host:mysql的主机IP
- –mysql-port:mysql的端口
- –mysql-user:mysql连接用户
- –mysql-password:mysql连接密码
- –mysql-db:mysql测试数据库名称,需要提前创建
- –oltp-tables-count:测试表的数量
- –oltp-table-size:每张测试表的数据量,记录数
- –report-interval:指定测试进度报告输出的间隔,单位为秒
- –oltp-test-mode:执行模式,可选值有simple(简单查询)、complex(事务模式)、nontrx(非事务模式)。默认是complex
- –oltp-read-only:是否设置为只读模式,默认为off
- –time:压力测试的持续时间,单位为秒
- –threads:并发线程
【执行测试】
sysbench ./tests/include/oltp_legacy/oltp.lua --mysql-host=10.1.2.65 --mysql-port=3306 --mysql-user=root --mysql-password=xxxx --oltp-test-mode=complex --oltp-tables-count=5 --oltp-table-size=100 --threads=10 --time=120 --mysql-db=sbtest --report- interval=10 run
Threads started!
[ 10s ] thds: 10 tps: 649.73 qps: 13523.61 (r/w/o: 9552.34/2639.12/1332.16) lat (ms,95%): 24.83 err/s: 31.69 reconn/s: 0.00
[ 20s ] thds: 10 tps: 528.10 qps: 10898.10 (r/w/o: 7682.83/2138.18/1077.09) lat (ms,95%): 27.17 err/s: 20.90 reconn/s: 0.00
[ 30s ] thds: 10 tps: 634.90 qps: 13173.80 (r/w/o: 9300.00/2574.70/1299.10) lat (ms,95%): 24.83 err/s: 29.30 reconn/s: 0.00
[ 40s ] thds: 10 tps: 729.60 qps: 15097.35 (r/w/o: 10650.46/2956.79/1490.09) lat (ms,95%): 23.52 err/s: 30.90 reconn/s: 0.00
[ 50s ] thds: 10 tps: 482.89 qps: 9978.35 (r/w/o: 7037.39/1955.17/985.79) lat (ms,95%): 27.17 err/s: 20.00 reconn/s: 0.00
[ 60s ] thds: 10 tps: 385.01 qps: 7983.44 (r/w/o: 5634.07/1561.95/787.42) lat (ms,95%): 32.53 err/s: 17.40 reconn/s: 0.00
[ 70s ] thds: 10 tps: 605.90 qps: 12551.87 (r/w/o: 8857.38/2455.99/1238.50) lat (ms,95%): 25.28 err/s: 26.70 reconn/s: 0.00
[ 80s ] thds: 10 tps: 553.69 qps: 11437.85 (r/w/o: 8066.29/2241.77/1129.78) lat (ms,95%): 26.20 err/s: 22.40 reconn/s: 0.00
[ 90s ] thds: 10 tps: 475.40 qps: 9826.06 (r/w/o: 6929.44/1926.31/970.31) lat (ms,95%): 24.83 err/s: 19.50 reconn/s: 0.00
[ 100s ] thds: 10 tps: 689.71 qps: 14317.27 (r/w/o: 10107.12/2798.33/1411.82) lat (ms,95%): 24.83 err/s: 32.40 reconn/s: 0.00
[ 110s ] thds: 10 tps: 466.89 qps: 9604.36 (r/w/o: 6766.83/1887.45/950.08) lat (ms,95%): 27.66 err/s: 16.30 reconn/s: 0.00
[ 120s ] thds: 10 tps: 613.71 qps: 12685.97 (r/w/o: 8946.32/2486.73/1252.92) lat (ms,95%): 29.19 err/s: 25.50 reconn/s: 0.00
SQL statistics:
queries performed:
read: 995358 #总的select数量
write: 276259 #总的select数量
other: 139264 #其他操作。如commit
total: 1410881 #全部总数
transactions: 68167 (567.96 per sec.) ###总事务数(TPS,每秒事务数)*****
queries: 1410881 (11755.21 per sec.) ##读事务数(QPS,每秒事务数)******
ignored errors: 2930 (24.41 per sec.) ##忽略错误
reconnects: 0 (0.00 per sec.)
General statistics:
total time: 120.0194s ### 120.0292s 总耗时
total number of events: 68167 ##共发生多少事务
Latency (ms):
min: 6.94 最小耗时
avg: 17.60 平均耗时
max: 1709.26 最长耗时
95th percentile: 25.74 95%请求的最大响应时间 ******
sum: 1199824.72 总耗时
Threads fairness: ---与线程相关的指标
events (avg/stddev): 6816.7000/32.72 ###事件(平均值/偏差)
execution time (avg/stddev): 119.9825/0.01 ###执行时间(平均值/偏差)
【清理运行结果】
sysbench ./tests/include/oltp_legacy/oltp.lua --mysql-host=10.1.2.65 --mysql-port=3306 --mysql-user=root --mysql-password=1qaz@WSX --oltp-test-mode=complex --oltp-tables-count=5 --oltp-table-size=100 --threads=10 --time=120 --mysql-db=sbtest --report-interval=10 cleanup
2.分析运行结果以及图形化展示测试结果
【创建监控脚本】
[root@backup scripts]# cat sysbench_monitor.sh 一般后台运行
#!/bin/bash
#开始前获取全局配置参数
#每五秒获取一次cpu load,MySQL全局信息,InnoDB引擎相关信息,线程信息
INTERVAL=5
PREFIX=$INTERVAL-sec-status
RUNFILE=/usr/local/mysql/sysbench/monitor/run
mysql -uroot -p -h10.1.2.65 -e 'show global variables'>>mysql-variables
while test -e $RUNFILE; do
file=$(date +%F_%H)
sleep=$(date +%s.%N |awk "{print $INTERVAL -($1 % $INTERVAL)}")
sleep $sleep
ts="$(date +"TS %s.%N %F %T")"
loadavg="$(uptime)"
echo "$ts $loadavg">> $PREFIX-${file}-status
mysql -uroot -p -h10.1.2.65-e "show global status" >> $PREFIX-${file}-status 2>/dev/null &
echo "$ts $loadavg">> $PREFIX-${file}-innodbstatus
mysql -uroot -p -h10.1.2.65 -e "show engine innodb statusG" >> $PREFIX-${file}-innodbstatus 2>/dev/null &
echo "$ts $loadavg">> $PREFIX-${file}-processlist
mysql -uroot -p -h10.1.2.65 -e "show full processlistG" >>$PREFIX-${file}-processlist 2>/dev/null &
echo $ts
done
echo Exiting because $RUNFILE not exist
【创建分析脚本,用來分析 sysbench_monitor.sh监控脚本】
[root@backup scripts]# cat sysbench_anaylyze.sh
#!/bin/bash
awk '
BEGIN{
printf "#ts date time load QPS";
fmt = " %.2f";
}
/^TS/ { # The timestamp lines begin with TS.
ts = substr($2, 1, index($2,".") - 1);
load = NF - 2;
diff = ts -prev_ts;
prev_ts = ts;
printf "
%s %s %s %s",ts,$3,$4,substr($load, 1, length($load)-1);
}
/Queries/ {
printf fmt, ($2-Queries)/diff;
Queries=$2
}
' "$@"
【使用方法】
1.创建/usr/local/mysql/sysbench/monitor/run文件
2.执行测试
sysbench ./tests/include/oltp_legacy/oltp.lua --mysql-host=10.1.2.65 --mysql-port=3306 --mysql-user=root --mysql-password=xxxx --oltp-test-mode=complex --oltp-tables-count=5 --oltp-table-size=100 --threads=10 --time=120 --mysql-db=sbtest --report- interval=10 run
在其他窗口立刻执行
sh sysbench_monitor.sh
3.测试结束后,删除/usr/local/mysql/sysbench/monitor/run文件,即可以停止监控
rm -fr /usr/local/mysql/sysbench/monitor/run
4. 进入到sysbench_monitor.sh所在目录下,可以找到三个文件
-rw-r--r-- 1 root root 361854 Apr 20 15:32 5-sec-status-2020-04-20_15-innodbstatus
-rw-r--r-- 1 root root 104644 Apr 20 15:32 5-sec-status-2020-04-20_15-processlist
-rw-r--r-- 1 root root 275907 Apr 20 15:32 5-sec-status-2020-04-20_15-status
我们在用分析脚本来进行结果分析
sh sysbench_anaylyze.sh 5-sec-status-2020-04-20_15-status >sysbench_status_out.log
[root@ksrv-dct scripts]# vim sysbench_status_out.log
#ts date time load QPS
1587367785 2020-04-20 15:29:45 0.00 0.00
1587367790 2020-04-20 15:29:50 0.64 12230.80
1587367795 2020-04-20 15:29:55 1.23 14884.00
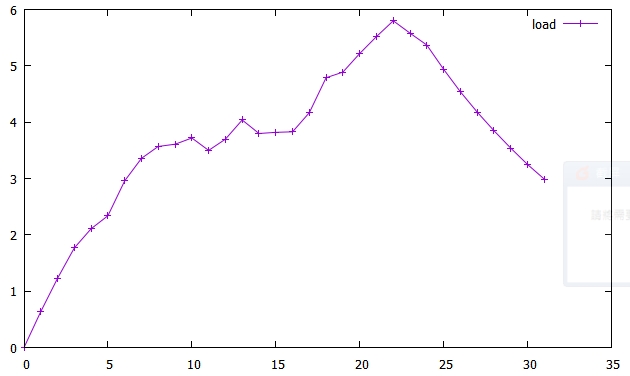
【出图】
在window下载gnuplot软件 下载地址:https://sourceforge.net/projects/gnuplot/
然后打开软件,将分析日志放到指定的路径
plot 'C:UsersMirror_liuDesktopsysbench_status_out.log' using 5 with linespoint title 'QPS',


gnuplot> plot 'C:UsersMirror_liuDesktopsysbench_status_out.log' using 4 with linespoint title 'load',