准备k8s 集群
- 前言
准备好k8s 集群,通过部署prometheus 达到获取k8s 容器资源,根据收集指标制定报警策略,从而提高监控响应能力。
$ kubectl get  node
NAME       STATUS     ROLES    AGE   VERSION
master01   Ready      master   13d   v1.16.0
master02   Ready      master   13d   v1.16.0
master03   Ready      master   13d   v1.16.0
node01     Ready      <none>   13d   v1.16.0
node02     Ready      <none>   13d   v1.16.0
node03     Ready      <none>   13d   v1.16.0
部署 prometheus node-exporter
- node-exporter 为 DaemonSet部署方式,且占用宿主机端口
# cat node-exporter-ds.yaml
apiVersion: apps/v1
kind: DaemonSet
metadata:
  labels:
    app: node-exporter
    app.kubernetes.io/managed-by: Helm
    grafanak8sapp: "true"
  name: node-exporter
  namespace: prometheus
spec:
  selector:
    matchLabels:
      app: node-exporter
  template:
    metadata:
      creationTimestamp: null
      labels:
        app: node-exporter
        grafanak8sapp: "true"
    spec:
      containers:
      - args:
        - --path.procfs=/host/proc
        - --path.sysfs=/host/sys
        - --web.listen-address=$(HOST_IP):9100
        env:
        - name: HOST_IP
          value: 0.0.0.0
        image: prom/node-exporter:v0.16.0
        imagePullPolicy: IfNotPresent
        livenessProbe:
          failureThreshold: 3
          httpGet:
            path: /
            port: 9100
            scheme: HTTP
          periodSeconds: 10
          successThreshold: 1
          timeoutSeconds: 1
        name: node-exporter
        ports:
        - containerPort: 9100
          hostPort: 9100
          name: metrics
          protocol: TCP
        readinessProbe:
          failureThreshold: 3
          httpGet:
            path: /
            port: 9100
            scheme: HTTP
          periodSeconds: 10
          successThreshold: 1
          timeoutSeconds: 1
        resources: {}
        terminationMessagePath: /dev/termination-log
        terminationMessagePolicy: File
        volumeMounts:
        - mountPath: /host/proc
          name: proc
          readOnly: true
        - mountPath: /host/sys
          name: sys
          readOnly: true
      dnsPolicy: ClusterFirst
      hostNetwork: true
      hostPID: true
      restartPolicy: Always
      schedulerName: default-scheduler
      securityContext:
        fsGroup: 65534
        runAsGroup: 65534
        runAsNonRoot: true
        runAsUser: 65534
      terminationGracePeriodSeconds: 30
      tolerations:
      - effect: NoSchedule
        operator: Exists
      volumes:
      - hostPath:
          path: /proc
          type: ""
        name: proc
      - hostPath:
          path: /sys
          type: ""
        name: sys

生成配置文件
kubectl apply  -f node-exporter-ds.yaml
部署blackbox-exporter
一、准备blackbox-exporter  deployment 配置文件
# cat blackbox-exporter-deployment.yaml
apiVersion: apps/v1
kind: Deployment
metadata:
  labels:
    app: blackbox-exporter
  name: blackbox-exporter
  namespace: prometheus
spec:
  replicas: 1
  selector:
    matchLabels:
      app: blackbox-exporter
  strategy:
    rollingUpdate:
      maxSurge: 25%
      maxUnavailable: 25%
    type: RollingUpdate
  template:
    metadata:
      creationTimestamp: null
      labels:
        app: blackbox-exporter
    spec:
      containers:
      - image: prom/blackbox-exporter
        imagePullPolicy: IfNotPresent
        name: blackbox-exporter
        resources: {}
        terminationMessagePath: /dev/termination-log
        terminationMessagePolicy: File
      dnsPolicy: ClusterFirst
      restartPolicy: Always
      schedulerName: default-scheduler
      securityContext: {}
      terminationGracePeriodSeconds: 30

二、准备blackbox-exporter-svc 文件
# cat blackbox-exporter-svc.yaml
apiVersion: v1
kind: Service
metadata:
  labels:
    app: blackbox-exporter
  name: blackbox-exporter
  namespace: prometheus
spec:
  ports:
  - name: blackbox
    port: 9115
    protocol: TCP
    targetPort: 9115
  selector:
    app: blackbox-exporter
  sessionAffinity: None
  type: ClusterIP
status:
  loadBalancer: {}

生成配置文件
kubectl apply  -f blackbox-exporter-deployment.yaml
kubectl apply  -f blackbox-exporter-svc.yaml
部署 kubernetes-kube-state 用来收集node 节点指标
wget  https://github.com/kubernetes/kube-state-metrics/tree/release-1.9/examples/standard
1. 修改名称空间 kube-system 为 prometheus
2. 增加deployment label 为 grafanak8sapp: "true"
├── cluster-role-binding.yaml
├── cluster-role.yaml
├── deployment.yaml
├── service-account.yaml
└── service.yaml

生成配置文件
kubectl  apply -f  ./
部署prometheus
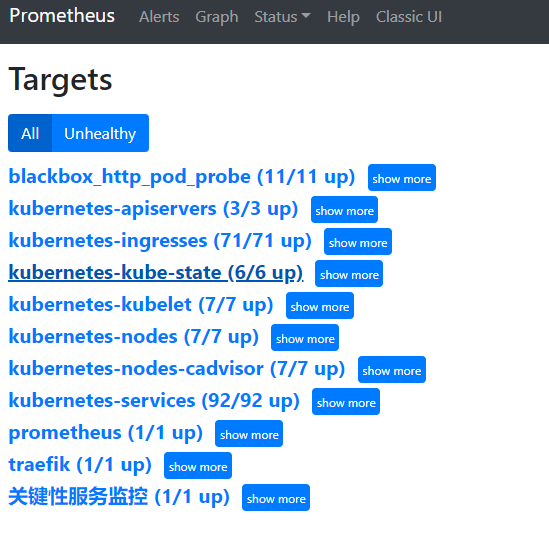
- prometheus 配置文件主要监控项目为 kubernetes-nodes (集群各个节点)
- prometheus 监控prometheus 服务
- kubernetes-services 通过blackbox-exporter 监控 service
- kubernetes-nodes-cadvisor 通过 cadvisor 收集各个node 节点Pod 信息
- kubernetes-ingresses 通过blackbox-exporter 监控 ingresses
- kubernetes-kubelet 监控各个节点 kubelet
- traefik 监控traefik 存活
- kubernetes-apiservers 监控 apiservers 存活
- 关键性服务监控 监控各个关键性服务状态
- blackbox_http_pod_probe 通过blackbox-exporter监控各个pod
- kubernetes-kube-state 通过 kube-state 可以收集各个node 节点信息
├── prometheus-conf.yaml
├── prometheus-deployment.yaml
├── prometheus-ingress.yaml
├── prometheus-pv-pvc.yaml
├── prometheus-rules.yaml
└── prometheus-svc.yaml
一、准备 pv、pvc 配置文件
# cat prometheus-pv-pvc.yaml
apiVersion: v1
kind: PersistentVolume
metadata:
name: prometheus-server
namespace: prometheus
labels:
name: prometheus-server
spec:
nfs:
path: /export/nfs_share/volume-prometheus/prometheus-server
server: 10.65.0.94
accessModes: ["ReadWriteMany","ReadOnlyMany"]
capacity:
storage: 50Gi
---
apiVersion: v1
kind: PersistentVolumeClaim
metadata:
name: prometheus-server
namespace: prometheus
spec:
accessModes: ["ReadWriteMany"]
resources:
requests:
storage: 50Gi
二、准备prometheus-conf 文件
# cat prometheus-conf.yaml
apiVersion: v1
data:
prometheus.yml: |-
# my global config
global:
scrape_interval: 15s # Set the scrape interval to every 15 seconds. Default is every 1 minute.
evaluation_interval: 15s # Evaluate rules every 15 seconds. The default is every 1 minute.
# scrape_timeout is set to the global default (10s).
# Alertmanager configuration
alerting:
alertmanagers:
- static_configs:
- targets:
- 'alertmanager-service.prometheus:9093'
# Load rules once and periodically evaluate them according to the global 'evaluation_interval'.
rule_files:
- "/etc/prometheus/rules/nodedown.rule.yml"
scrape_configs:
- job_name: 'prometheus'
static_configs:
- targets: ['localhost:9090']
- job_name: kubernetes-kube-state
honor_timestamps: true
scrape_interval: 15s
scrape_timeout: 10s
metrics_path: /metrics
scheme: http
relabel_configs:
- separator: ;
regex: __meta_kubernetes_pod_label_(.+)
replacement: $1
action: labelmap
- source_labels: [__meta_kubernetes_namespace]
separator: ;
regex: (.*)
target_label: kubernetes_namespace
replacement: $1
action: replace
- source_labels: [__meta_kubernetes_pod_name]
separator: ;
regex: (.*)
target_label: kubernetes_pod_name
replacement: $1
action: replace
- source_labels: [__meta_kubernetes_pod_label_grafanak8sapp]
separator: ;
regex: .*true.*
replacement: $1
action: keep
- source_labels: [__meta_kubernetes_pod_label_daemon, __meta_kubernetes_pod_node_name]
separator: ;
regex: node-exporter;(.*)
target_label: nodename
replacement: $1
action: replace
kubernetes_sd_configs:
- role: pod
- job_name: '关键性服务监控'
metrics_path: /probe
params:
module: [http_2xx]
static_configs:
- targets:
- https://news-gg-xy.com/healthz
relabel_configs:
- source_labels: [__address__]
target_label: __param_target
- source_labels: [__param_target]
target_label: instance
- target_label: __address__
replacement: blackbox-exporter.prometheus.svc.cluster.local:9115
- job_name: blackbox_http_pod_probe
honor_timestamps: true
params:
module:
- http_2xx
scrape_interval: 15s
scrape_timeout: 10s
metrics_path: /probe
scheme: http
relabel_configs:
- source_labels: [__meta_kubernetes_pod_annotation_blackbox_scheme]
separator: ;
regex: http
replacement: $1
action: keep
- source_labels: [__address__, __meta_kubernetes_pod_annotation_blackbox_port, __meta_kubernetes_pod_annotation_blackbox_path]
separator: ;
regex: ([^:]+)(?::d+)?;(d+);(.+)
target_label: __param_target
replacement: $1:$2$3
action: replace
- separator: ;
regex: (.*)
target_label: __address__
replacement: blackbox-exporter.prometheus.svc.cluster.local:9115
action: replace
- source_labels: [__param_target]
separator: ;
regex: (.*)
target_label: instance
replacement: $1
action: replace
- separator: ;
regex: __meta_kubernetes_pod_label_(.+)
replacement: $1
action: labelmap
- source_labels: [__meta_kubernetes_namespace]
separator: ;
regex: (.*)
target_label: kubernetes_namespace
replacement: $1
action: replace
- source_labels: [__meta_kubernetes_pod_name]
separator: ;
regex: (.*)
target_label: kubernetes_pod_name
replacement: $1
action: replace
kubernetes_sd_configs:
- role: pod
- bearer_token_file: /var/run/secrets/kubernetes.io/serviceaccount/token
job_name: kubernetes-nodes
kubernetes_sd_configs:
- role: node
relabel_configs:
- action: labelmap
regex: __meta_kubernetes_node_label_(.+)
- replacement: kubernetes.default.svc:443
target_label: __address__
- regex: (.+)
replacement: /api/v1/nodes/${1}/proxy/metrics
source_labels:
- __meta_kubernetes_node_name
target_label: __metrics_path__
scheme: https
tls_config:
ca_file: /var/run/secrets/kubernetes.io/serviceaccount/ca.crt
insecure_skip_verify: true
- job_name: 'kubernetes-services'
metrics_path: /probe
params:
module: [http_2xx]
kubernetes_sd_configs:
- role: service
relabel_configs:
- source_labels: [__meta_kubernetes_service_annotation_prometheus_io_probe]
action: keep
regex: true
- source_labels: [__address__]
target_label: __param_target
- target_label: __address__
replacement: blackbox-exporter.prometheus.svc.cluster.local:9115
- source_labels: [__param_target]
target_label: instance
- action: labelmap
regex: __meta_kubernetes_service_label_(.+)
- source_labels: [__meta_kubernetes_namespace]
target_label: kubernetes_namespace
- source_labels: [__meta_kubernetes_service_name]
target_label: kubernetes_name
- bearer_token_file: /var/run/secrets/kubernetes.io/serviceaccount/token
job_name: kubernetes-nodes-cadvisor
kubernetes_sd_configs:
- role: node
relabel_configs:
- action: labelmap
regex: __meta_kubernetes_node_label_(.+)
- replacement: kubernetes.default.svc:443
target_label: __address__
- regex: (.+)
replacement: /api/v1/nodes/${1}/proxy/metrics/cadvisor
source_labels:
- __meta_kubernetes_node_name
target_label: __metrics_path__
scheme: https
tls_config:
ca_file: /var/run/secrets/kubernetes.io/serviceaccount/ca.crt
insecure_skip_verify: true
- bearer_token_file: /var/run/secrets/kubernetes.io/serviceaccount/token
job_name: 'kubernetes-ingresses'
metrics_path: /probe
params:
module: [http_2xx]
kubernetes_sd_configs:
- role: ingress
relabel_configs:
- source_labels: [__meta_kubernetes_ingress_annotation_prometheus_io_probe]
action: keep
regex: true
- source_labels: [__meta_kubernetes_ingress_scheme,__address__,__meta_kubernetes_ingress_path]
regex: (.+);(.+);(.+)
replacement: ${1}://${2}${3}
target_label: __param_target
- target_label: __address__
replacement: blackbox-exporter.prometheus.svc.cluster.local:9115
- source_labels: [__param_target]
target_label: instance
- action: labelmap
regex: __meta_kubernetes_ingress_label_(.+)
- source_labels: [__meta_kubernetes_namespace]
target_label: kubernetes_namespace
- source_labels: [__meta_kubernetes_ingress_name]
target_label: kubernetes_name
- job_name: 'kubernetes-kubelet'
scheme: https
tls_config:
ca_file: /var/run/secrets/kubernetes.io/serviceaccount/ca.crt
bearer_token_file: /var/run/secrets/kubernetes.io/serviceaccount/token
kubernetes_sd_configs:
- role: node
relabel_configs:
- action: labelmap
regex: __meta_kubernetes_node_label_(.+)
- target_label: __address__
replacement: kubernetes.default.svc:443
- source_labels: [__meta_kubernetes_node_name]
regex: (.+)
target_label: __metrics_path__
replacement: /api/v1/nodes/${1}/proxy/metrics
- job_name: "traefik"
static_configs:
- targets: ['traefik-ingress-service.kube-system.svc.cluster.local:8080']
- bearer_token_file: /var/run/secrets/kubernetes.io/serviceaccount/token
job_name: kubernetes-apiservers
kubernetes_sd_configs:
- role: endpoints
relabel_configs:
- action: keep
regex: default;kubernetes;https
source_labels:
- __meta_kubernetes_namespace
- __meta_kubernetes_service_name
- __meta_kubernetes_endpoint_port_name
scheme: https
tls_config:
ca_file: /var/run/secrets/kubernetes.io/serviceaccount/ca.crt
insecure_skip_verify: true
kind: ConfigMap
metadata:
labels:
app: prometheus
name: prometheus-conf
namespace: prometheus
三、准备prometheus-rules 配置文件
# cat prometheus-rules.yaml
apiVersion: v1
data:
nodedown.rule.yml: |
groups:
- name: YingPuDev-Alerting
rules:
- alert: 实例崩溃
expr: up {instance !~""} == 0
for: 1m
labels:
severity: critical
annotations:
summary: "实例{{ $labels.instance }}崩溃"
description: "{{ $labels.instance }}的{{ $labels.job }}实例已经崩溃超过了1分钟。"
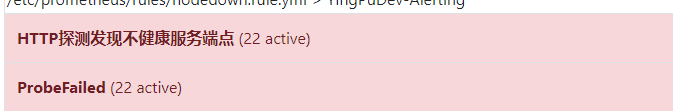
- alert: HTTP探测发现不健康服务端点
expr: probe_http_status_code >= 400 or probe_http_status_code {instance !~ "videoai-php-dev.videoai.svc:22"} == 0
for: 1m
labels:
severity: warning
annotations:
summary: "API {{ $labels.kubernetes_name }} 服务不可用"
description: "{{ $labels.kubernetes_name }}的{{ $labels.job }}服务已经超过1分钟不可用了。当前状态码为:{{ $value }}"
kind: ConfigMap
metadata:
labels:
app: prometheus
name: prometheus-rules
namespace: prometheus
四、准备prometheus-deployment 配置文件
apiVersion: apps/v1
kind: Deployment
metadata:
labels:
app: prometheus
name: prometheus
namespace: prometheus
spec:
replicas: 1
selector:
matchLabels:
app: prometheus
strategy:
rollingUpdate:
maxSurge: 25%
maxUnavailable: 25%
type: RollingUpdate
template:
metadata:
creationTimestamp: null
labels:
app: prometheus
spec:
containers:
- args:
- --config.file=/etc/prometheus/prometheus.yml
- --storage.tsdb.path=/prometheus
- --storage.tsdb.retention=30d
env:
- name: STAKATER_PROMETHEUS_CONF_CONFIGMAP
value: e4dd2838dd54e8392b62d85898083cc3d20210cc
- name: STAKATER_PROMETHEUS_RULES_CONFIGMAP
value: ca65a78fcb15d2c767166e468e8e734c6d4e267f
image: prom/prometheus:latest
imagePullPolicy: Always
name: prometheus
ports:
- containerPort: 9090
protocol: TCP
resources: {}
terminationMessagePath: /dev/termination-log
terminationMessagePolicy: File
volumeMounts:
- mountPath: /prometheus
name: prometheus-data-volume
- mountPath: /etc/prometheus/prometheus.yml
name: prometheus-conf-volume
subPath: prometheus.yml
- mountPath: /etc/prometheus/rules
name: prometheus-rules-volume
dnsPolicy: ClusterFirst
restartPolicy: Always
schedulerName: default-scheduler
securityContext:
runAsUser: 0
serviceAccount: prometheus
serviceAccountName: prometheus
terminationGracePeriodSeconds: 30
tolerations:
- effect: NoSchedule
key: node-role.kubernetes.io/master
volumes:
- name: prometheus-data-volume
persistentVolumeClaim:
claimName: prometheus-server
- configMap:
defaultMode: 420
name: prometheus-conf
name: prometheus-conf-volume
- configMap:
defaultMode: 420
name: prometheus-rules
name: prometheus-rules-volume
五、准备 prometheus-svc 配置文件
# cat prometheus-svc.yaml
apiVersion: v1
kind: Service
metadata:
labels:
app: prometheus
name: prometheus-service
namespace: prometheus
spec:
ports:
- port: 9090
protocol: TCP
targetPort: 9090
selector:
app: prometheus
sessionAffinity: None
type: ClusterIP
status:
loadBalancer: {}
六、准备 prometheus-ingress 配置文件
# cat prometheus-ingress.yaml
apiVersion: extensions/v1beta1
kind: Ingress
metadata:
name: prometheus-ingress
namespace: prometheus
spec:
rules:
- host: prometheus.movie.cn
http:
paths:
- backend:
serviceName: prometheus-service
servicePort: 9090
status:
loadBalancer: {}
依次生成配置文件
kubectl apply -f prometheus-conf.yaml
kubectl apply -f prometheus-pv-pvc.yaml
kubectl apply -f prometheus-rules.yaml
kubectl apply -f prometheus-deployment.yaml
kubectl apply -f prometheus-svc.yaml
kubectl apply -f prometheus-ingress.yaml
部署 alertmanager
- 准备好能接能收的邮件,并且获得授权码
一、准备好 alertmanager 主配置文件
# cat alertmanager-config.yaml
apiVersion: v1
data:
  config.yml: |-
    global:
      smtp_smarthost: 'smtp.exmail.qq.com:465'
      smtp_from: 'gitlab@movie.cn'
      smtp_auth_username: 'gitlab@movie.cn'
      smtp_auth_password: 'password'
      smtp_require_tls: false

    route:
      group_by: ['alertname', 'cluster']
      group_wait: 30s
      group_interval: 1m
      repeat_interval: 20m
      receiver: default
      routes:
      - receiver: email
        group_wait: 10s
        match:
          team: node
    receivers:
    - name: 'default'
      email_configs:
      - to: 'long_ma@movie.cn'
      - to: 'test_li@movie.cn'
        send_resolved: true
    - name: 'email'
      email_configs:
      - to: 'long_ma@movie.cn'
      - to: 'test_li@movie.cn'
        send_resolved: true
kind: ConfigMap
metadata:
  name: alert-config
  namespace: prometheus

二、准备alertmanager-deployment 配置文件
# cat alertmanager-deployment.yaml
apiVersion: apps/v1
kind: Deployment
metadata:
  labels:
    app: alertmanager
  name: alertmanager
  namespace: prometheus
spec:
  replicas: 1
  selector:
    matchLabels:
      app: alertmanager
  strategy:
    rollingUpdate:
      maxSurge: 25%
      maxUnavailable: 25%
    type: RollingUpdate
  template:
    metadata:
      creationTimestamp: null
      labels:
        app: alertmanager
    spec:
      containers:
      - args:
        - --config.file=/etc/alertmanager/config.yml
        - --storage.path=/alertmanager/data
        - --cluster.advertise-address=0.0.0.0:9093
        image: prom/alertmanager:v0.15.3
        imagePullPolicy: IfNotPresent
        name: alertmanager
        ports:
        - containerPort: 9093
          name: http
          protocol: TCP
        resources:
          requests:
            cpu: 100m
            memory: 256Mi
        terminationMessagePath: /dev/termination-log
        terminationMessagePolicy: File
        volumeMounts:
        - mountPath: /etc/alertmanager
          name: alertcfg
      dnsPolicy: ClusterFirst
      restartPolicy: Always
      schedulerName: default-scheduler
      securityContext: {}
      terminationGracePeriodSeconds: 30
      volumes:
      - configMap:
          defaultMode: 420
          name: alert-config
        name: alertcfg

三、准备好alertmanager-service 配置文件
# cat alertmanager-service.yaml
apiVersion: v1
kind: Service
metadata:
  labels:
    app: alertmanager
  name: alertmanager-service
  namespace: prometheus
spec:
  externalTrafficPolicy: Cluster
  ports:
  - nodePort: 31567
    port: 9093
    protocol: TCP
    targetPort: 9093
  selector:
    app: alertmanager
  sessionAffinity: None
  type: NodePort
status:
  loadBalancer: {}

生成配置文件
kubectl apply  -f alertmanager-config.yaml
kubectl apply  -f alertmanager-deployment.yaml
kubectl apply  -f alertmanager-service.yaml
部署 grafana
- grafana 在要求用户的时候需要发送邮件,因此需要将grafana 配置文件提取出来做成 configmap 并配置接收邮件内容。
├── grafana-conf.yaml
├── grafana-deployment.yaml
├── grafana-ingress.yaml
├── grafana-pv-pvc.yaml
└── grafana-service.yaml

一、准备grafana pv、pvc 配置文件
# cat grafana-pv-pvc.yaml
apiVersion: v1
kind: PersistentVolume
metadata:
  name: grafana
  namespace: prometheus
  labels:
    name: grafana
spec:
  nfs:
    path: /export/nfs_share/volume-prometheus/grafana
    server: 10.65.0.94
  accessModes: ["ReadWriteMany","ReadOnlyMany"]
  capacity:
    storage: 50Gi
---
apiVersion: v1
kind: PersistentVolumeClaim
metadata:
  name: grafana
  namespace: prometheus
spec:
  accessModes: ["ReadWriteMany"]
  resources:
    requests:
      storage: 50Gi


二、准备 grafana config 配置文件
# cat grafana-conf.yaml
apiVersion: v1
data:
  grafana.ini: |
        [paths]
        [server]
        [database]
        [remote_cache]
        [dataproxy]
        [analytics]
        [security]
        [snapshots]
        [dashboards]
        [users]
        [auth]
        [auth.anonymous]
        [auth.github]
        [auth.gitlab]
        [auth.google]
        [auth.grafana_com]
        [auth.azuread]
        [auth.okta]
        [auth.generic_oauth]
        [auth.basic]
        [auth.proxy]
        [auth.ldap]
        [smtp]
        enabled = true
        host = smtp.exmail.qq.com:465
        user = gitlab@movie.cn
        password = password
        from_address = gitlab@movie.cn
        from_name = Grafana
        [emails]
        [log]
        [log.console]
        [log.file]
        [log.syslog]
        [quota]
        [alerting]
        [annotations.dashboard]
        [annotations.api]
        [explore]
        [metrics]
        [metrics.environment_info]
        [metrics.graphite]
        [grafana_com]
        [tracing.jaeger]
        [external_image_storage]
        [external_image_storage.s3]
        [external_image_storage.webdav]
        [external_image_storage.gcs]
        [external_image_storage.azure_blob]
        [external_image_storage.local]
        [rendering]
        [panels]
        [plugins]
        [plugin.grafana-image-renderer]
        [enterprise]
        [feature_toggles]
        [date_formats]
kind: ConfigMap
metadata:
  labels:
    app: grafana
  name: grafana-conf
  namespace: prometheus

三、 准备grafana-deployment 配置文件

# cat grafana-deployment.yaml
apiVersion: apps/v1
kind: Deployment
metadata:
  labels:
    app: grafana
  name: grafana
  namespace: prometheus
spec:
  replicas: 1
  selector:
    matchLabels:
      app: grafana
  strategy:
    rollingUpdate:
      maxSurge: 25%
      maxUnavailable: 25%
    type: RollingUpdate
  template:
    metadata:
      creationTimestamp: null
      labels:
        app: grafana
    spec:
      containers:
      - env:
        - name: GF_AUTH_BASIC_ENABLED
          value: "true"
        - name: GF_AUTH_ANONYMOUS_ENABLED
          value: "false"
        image: grafana/grafana:latest
        imagePullPolicy: IfNotPresent
        name: grafana
        ports:
        - containerPort: 3000
          protocol: TCP
        readinessProbe:
          failureThreshold: 3
          httpGet:
            path: /login
            port: 3000
            scheme: HTTP
          periodSeconds: 10
          successThreshold: 1
          timeoutSeconds: 1
        resources: {}
        terminationMessagePath: /dev/termination-log
        terminationMessagePolicy: File
        volumeMounts:
        - mountPath: /var/lib/grafana
          name: grafana-data-volume
        - mountPath: /etc/grafana/grafana.ini
          name: configmap-volume
          subPath: grafana.ini
      dnsPolicy: ClusterFirst
      restartPolicy: Always
      schedulerName: default-scheduler
      securityContext:
        runAsUser: 0
      terminationGracePeriodSeconds: 30
      volumes:
      - name: grafana-data-volume
        persistentVolumeClaim:
          claimName: grafana
      - configMap:
          defaultMode: 420
          name: grafana-conf
        name: configmap-volume


四、准备 grafana-service  配置文件
# cat grafana-service.yaml
apiVersion: v1
kind: Service
metadata:
  labels:
    app: grafana
  name: grafana-service
  namespace: prometheus
spec:
  ports:
  - port: 3000
    protocol: TCP
    targetPort: 3000
  selector:
    app: grafana
  sessionAffinity: None
  type: ClusterIP
status:
  loadBalancer: {}


五、准备 grafana-ingress 配置
# cat grafana-ingress.yaml
apiVersion: extensions/v1beta1
kind: Ingress
metadata:
  name: grafana-ingress
  namespace: prometheus
spec:
  rules:
  - host: grafana.movie.cn
    http:
      paths:
      - backend:
          serviceName: grafana-service
          servicePort: 3000
status:
  loadBalancer: {}

生成配置文件
kubectl apply  -f grafana-pv-pvc.yaml
kubectl apply  -f grafana-conf.yaml
kubectl apply  -f grafana-deployment.yaml
kubectl apply  -f grafana-service.yaml
kubectl apply  -f grafana-ingress.yaml
线上ingress 配置
- ingress 要想被 prometheus 抓取,需要声明,在ingress 中要添加 prometheus.io/probe: "true" ,以下是一个示例
apiVersion: extensions/v1beta1
kind: Ingress
metadata:
  annotations:
    prometheus.io/probe: "true"
  name: signinreception-node-test
  namespace: signin
spec:
  rules:
  - host: test.signin.xx.cn
    http:
      paths:
      - backend:
          serviceName: signin-node-test
          servicePort: 80
        path: /
线上 service 配置
- service 要想被 prometheus 抓取,需要声明,在service 中要添加 prometheus.io/probe: "true" ,以下是一个示例
apiVersion: v1
kind: Service
metadata:
  annotations:
    prometheus.io/probe: "true"
  labels:
    name: signinreception-node-test
  name: signinreception-node-test
  namespace: signin
spec:
  ports:
  - name: httpd
    port: 80
    protocol: TCP
    targetPort: 80
  selector:
    name: signinreception-node-test
  sessionAffinity: None
  type: ClusterIP
线上deployment 配置
- deployment要想被 prometheus 抓取,需要声明,在deployment 中要添加
blackbox_path: /
blackbox_port: "80"
blackbox_scheme: http
--- 以下是一个示例
apiVersion: apps/v1
kind: Deployment
metadata:
  labels:
    name: videoai-node-dev
  name: videoai-node-dev
  namespace: videoai
spec:
  replicas: 1
  selector:
    matchLabels:
      name: node-dev
  template:
    metadata:
      annotations:
        blackbox_path: /
        blackbox_port: "80"
        blackbox_scheme: http
      creationTimestamp: null
      labels:
        name: node-dev
    spec:
      containers:
      - image: node_dev:20201202103938
        imagePullPolicy: IfNotPresent
        name: node-dev
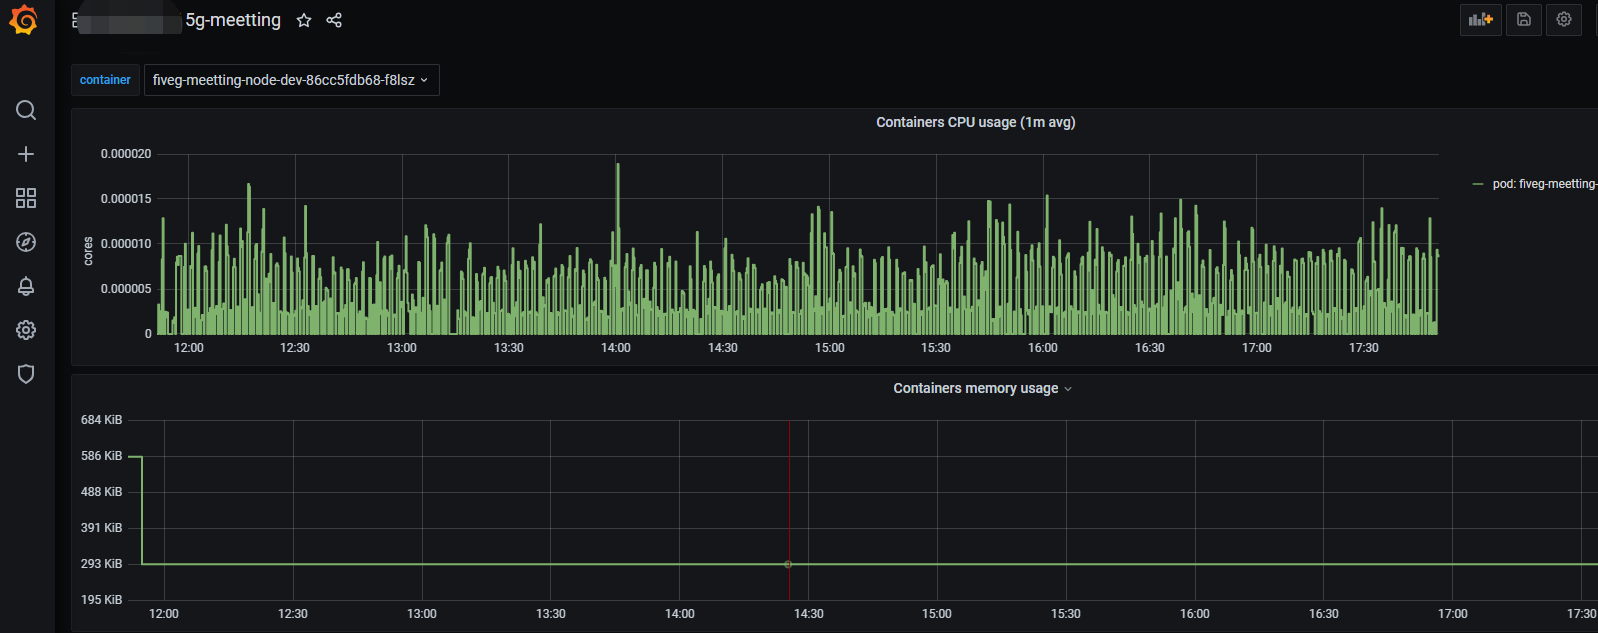
prometheus 效果展示


配置 grafana
- 需求是需要在grafana 中分业务展示pod cpu、内存等信息,pod 需要下拉框显示固定名称空间下的pod
- 需要在grafana 表达式中指定固定 namespace ,但是pod 需要使用变量指定
- 在dashboard 设置中配置变量

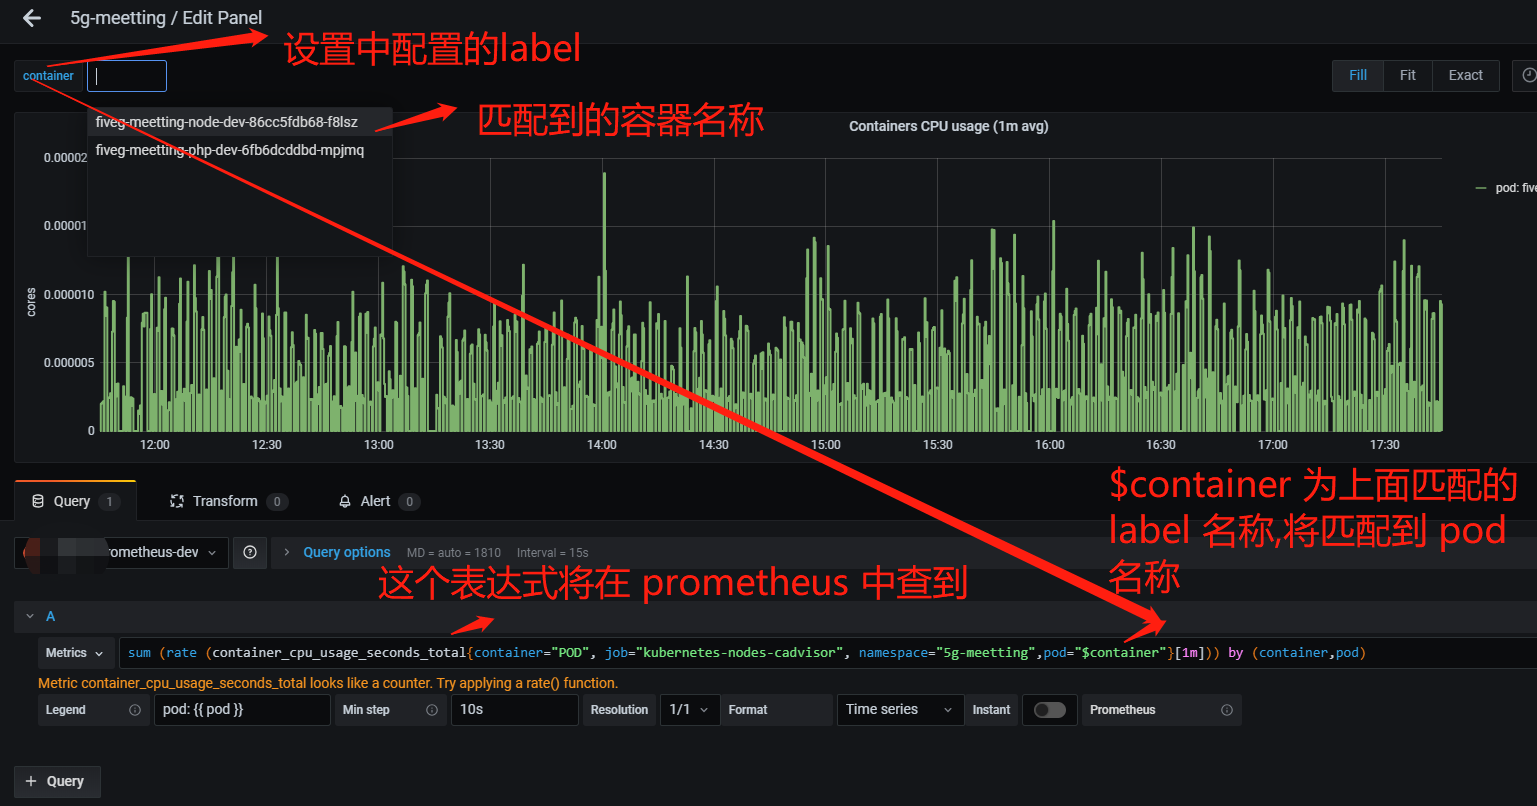
各个指标表达式
cpu 表达式:
sum (rate (container_cpu_usage_seconds_total{container="POD", job="kubernetes-nodes-cadvisor", namespace="5g-meetting",pod="$container"}[1m])) by (container,pod)
内存表达式:
sum (container_memory_working_set_bytes{container="POD", job="kubernetes-nodes-cadvisor", namespace="5g-meetting",pod="$container"}) by (container, pod)
prometheus 扩充
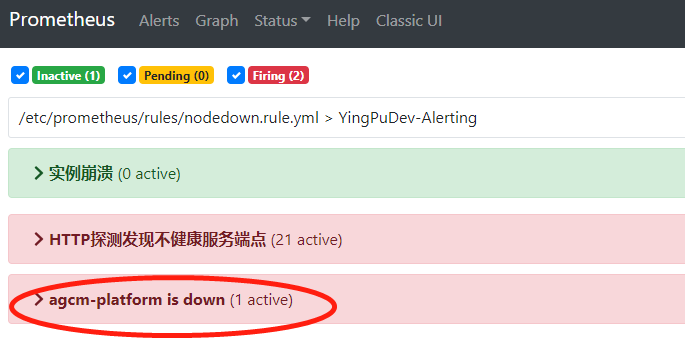
prometheus 针对单独业务发送报警
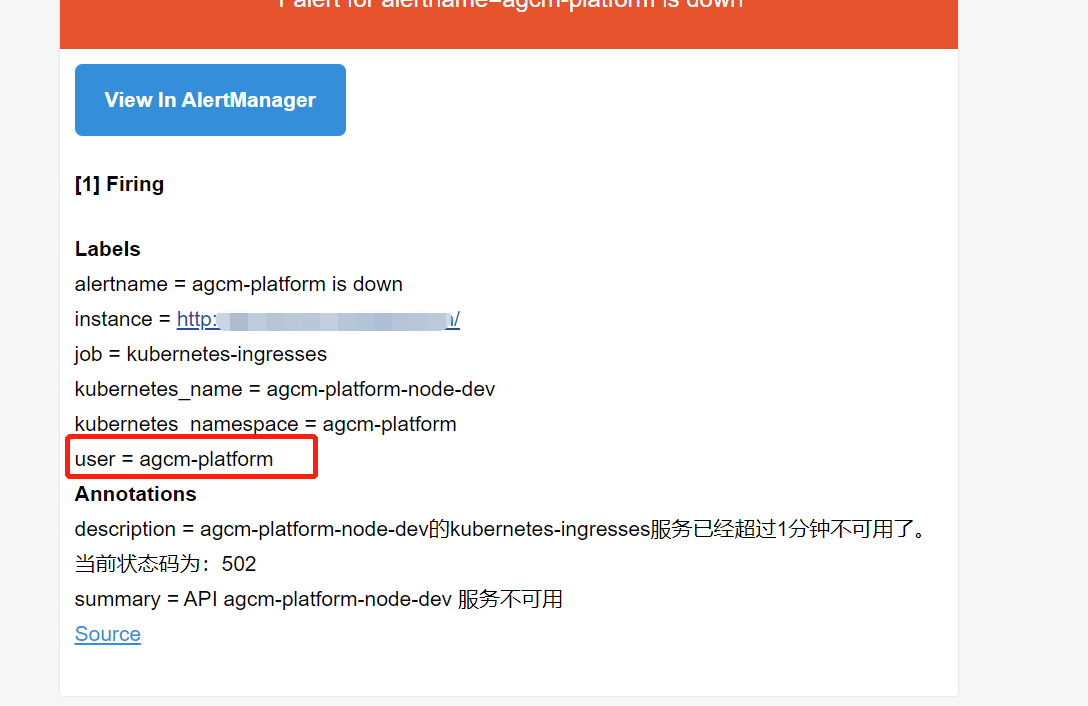
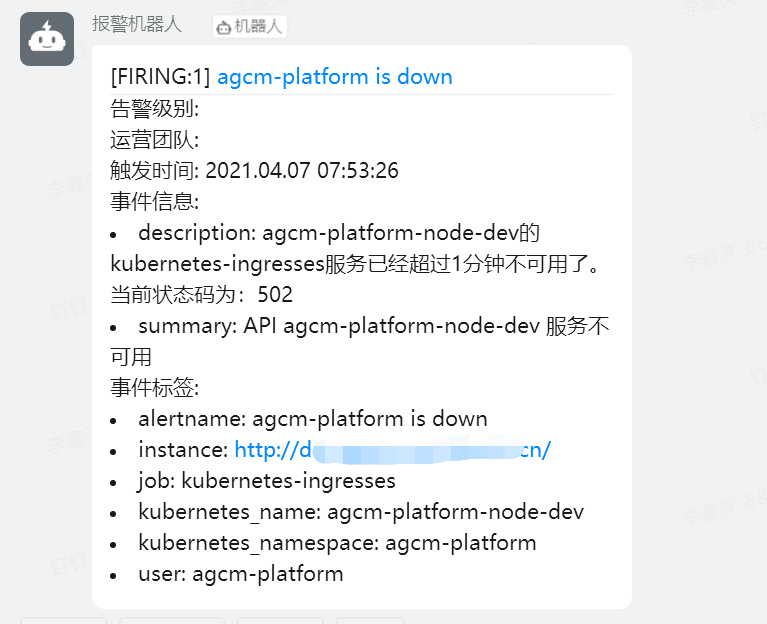
- 修改prometheus rules 配置文件,主要是修改 labels 标签值 user: agcm-platform ,因为业务是按照namespace 划分的,所以指定业务名称namespace 。 修改alert名称为: agcm-platform is down
      - alert: agcm-platform is down
        expr: probe_http_status_code {kubernetes_namespace=~"agcm-platform"} >= 400 or probe_http_status_code {kubernetes_namespace=~"agcm-platform"} == 0
        for: 1m
        labels:
          user: agcm-platform
        annotations:
          summary: "API {{ $labels.kubernetes_name }} 服务不可用"
          description: "{{ $labels.kubernetes_name }}的{{ $labels.job }}服务已经超过1分钟不可用了。当前状态码为:{{ $value }}"
- 修改 alertmanager 配置文件
routes 中新增加
      - receiver: agcm-platform
        group_wait: 10s
        match:
          user: agcm-platform

receivers 中新增加
    - name: 'agcm-platform'
      email_configs:
      - to: '1032957318@qq.com'
        send_resolved: true

prometheus 中已成功显示并能针对业务单独发送告警邮件
prometheus 接入钉钉告警
- 本文将介绍通过prometheus + alertmanager的方式实现钉钉报警。
获取自定义机器人webhook
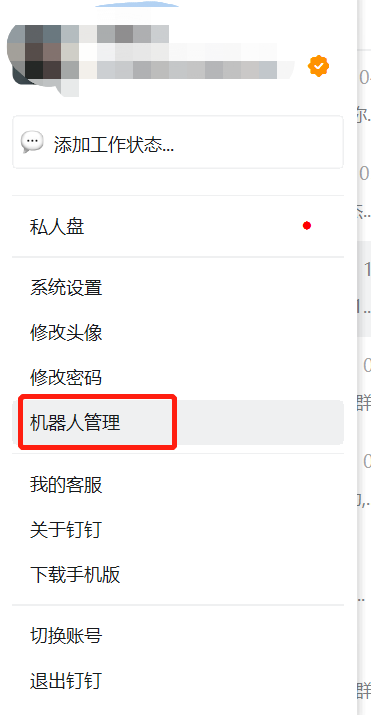
- 打开PC端钉钉,点击头像,选择“机器人管理”。
- 在机器人管理页面选择“自定义”机器人,输入机器人名字并选择要发送消息的群,同时可以为机器人设置机器人头像。
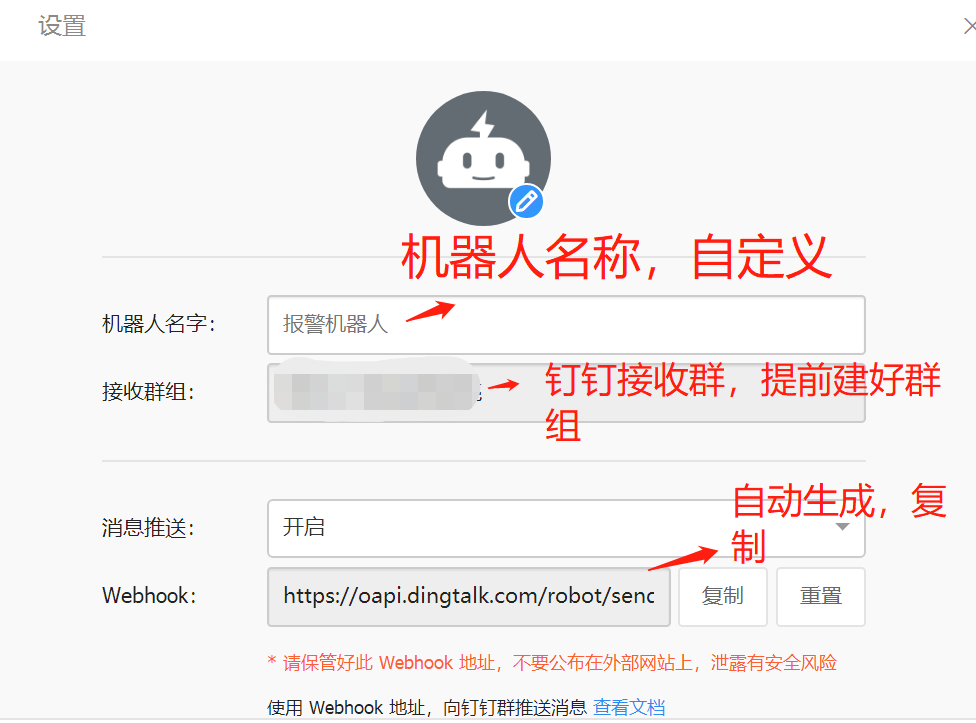
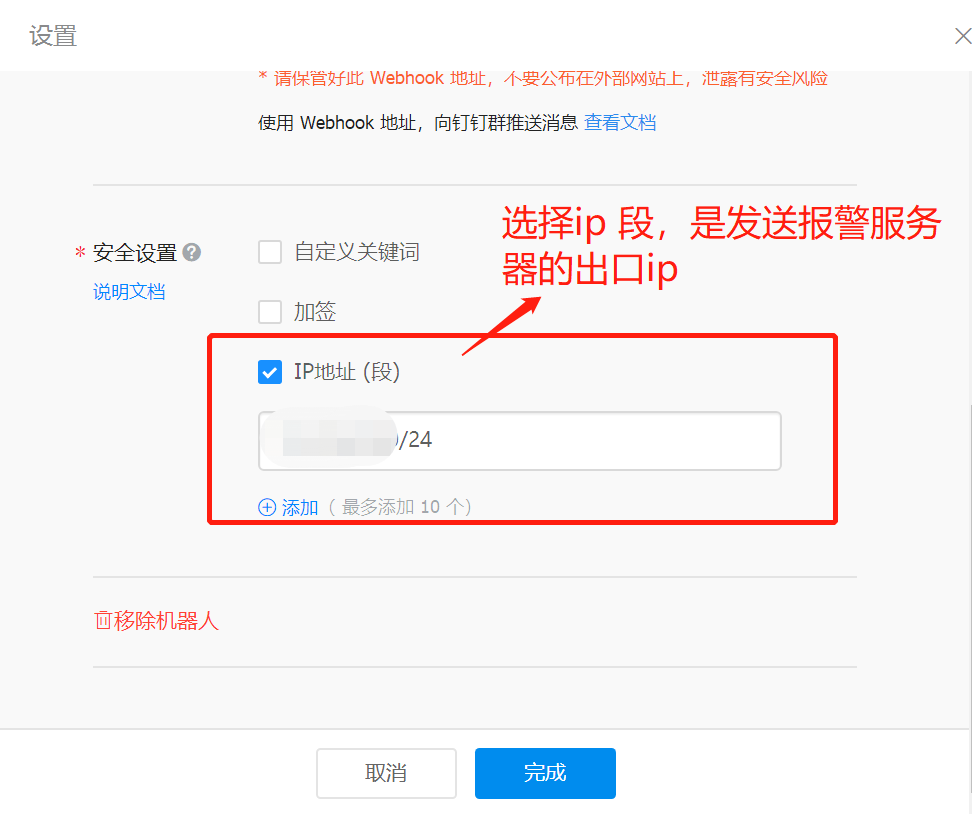
- 完成安全设置后,复制出机器人的Webhook地址,可用于向这个群发送消息,格式如下:
https://oapi.dingtalk.com/robot/send?access_token=XXXXXX
将钉钉接入 Prometheus AlertManager WebHook
#下载二进制安装包
shell> wget https://github.com/timonwong/prometheus-webhook-dingtalk/releases/download/v1.4.0/prometheus-webhook-dingtalk-1.4.0.linux-amd64.tar.gz
shell> tar zxvf prometheus-webhook-dingtalk-1.4.0.linux-amd64.tar.gz
shell> mv prometheus-webhook-dingtalk-1.4.0.linux-amd64 /usr/local/dingtalk/
- 配置钉钉告警文件
shell> cd /usr/local/dingtalk/
# 替换 config.yml 文件中的 url 后面的值信息为 复制出机器人的Webhook地址
shell> cp config.example.yml config.yml
# 修改config.yml 配置文件
shell> cat config.yml
## Request timeout
# timeout: 5s

## Customizable templates path
templates:
  - contrib/templates/legacy/template.tmpl

## You can also override default template using `default_message`
## The following example to use the 'legacy' template from v0.3.0
# default_message:
#   title: '{{ template "legacy.title" . }}'
#   text: '{{ template "legacy.content" . }}'

## Targets, previously was known as "profiles"
targets:
  webhook2:
    url: https://oapi.dingtalk.com/robot/send?access_token=xxx
  webhook_legacy:
    url: https://oapi.dingtalk.com/robot/send?access_token=xxx
    # Customize template content
    message:
      # Use legacy template
      title: '{{ template "legacy.title" . }}'
      text: '{{ template "legacy.content" . }}'
  webhook_mention_all:
    url: https://oapi.dingtalk.com/robot/send?access_token=xxx
    mention:
      all: true
- 配置钉钉告警模板
shell> cat  /usr/local/dingtalk/contrib/templates/legacy/template.tmpl

{{ define "__subject" }}[{{ .Status | toUpper }}{{ if eq .Status "firing" }}:{{ .Alerts.Firing | len }}{{ end }}] {{ .GroupLabels.SortedPairs.Values | join " " }} {{ if gt (len .CommonLabels) (len .GroupLabels) }}({{ with .CommonLabels.Remove .GroupLabels.Names }}{{ .Values | join " " }}{{ end }}){{ end }}{{ end }}
{{ define "__alertmanagerURL" }}{{ .ExternalURL }}/#/alerts?receiver={{ .Receiver }}{{ end }}

{{ define "__text_alert_list" }}{{ range . }}
**Labels**
{{ range .Labels.SortedPairs }} - {{ .Name }}: {{ .Value | markdown | html }}
{{ end }}
**Annotations**
{{ range .Annotations.SortedPairs }} - {{ .Name }}: {{ .Value | markdown | html }}
{{ end }}
**Source:** [{{ .GeneratorURL }}]({{ .GeneratorURL }})
{{ end }}{{ end }}

{{ define "default.__text_alert_list" }}{{ range . }}
---
**告警级别:** {{ .Labels.severity | upper }}

**运营团队:** {{ .Labels.team | upper }}

**触发时间:** {{ dateInZone "2006.01.02 15:04:05" (.StartsAt) "Asia/Shanghai" }}

**事件信息:**
{{ range .Annotations.SortedPairs }} - {{ .Name }}: {{ .Value | markdown | html }}


{{ end }}

**事件标签:**
{{ range .Labels.SortedPairs }}{{ if and (ne (.Name) "severity") (ne (.Name) "summary") (ne (.Name) "team") }} - {{ .Name }}: {{ .Value | markdown | html }}
{{ end }}{{ end }}
{{ end }}
{{ end }}
{{ define "default.__text_alertresovle_list" }}{{ range . }}
---
**告警级别:** {{ .Labels.severity | upper }}

**运营团队:** {{ .Labels.team | upper }}

**触发时间:** {{ dateInZone "2006.01.02 15:04:05" (.StartsAt) "Asia/Shanghai" }}

**结束时间:** {{ dateInZone "2006.01.02 15:04:05" (.EndsAt) "Asia/Shanghai" }}

**事件信息:**
{{ range .Annotations.SortedPairs }} - {{ .Name }}: {{ .Value | markdown | html }}


{{ end }}

**事件标签:**
{{ range .Labels.SortedPairs }}{{ if and (ne (.Name) "severity") (ne (.Name) "summary") (ne (.Name) "team") }} - {{ .Name }}: {{ .Value | markdown | html }}
{{ end }}{{ end }}
{{ end }}
{{ end }}

{{/* Default */}}
{{ define "default.title" }}{{ template "__subject" . }}{{ end }}
{{ define "default.content" }}#### [{{ .Status | toUpper }}{{ if eq .Status "firing" }}:{{ .Alerts.Firing | len }}{{ end }}] **[{{ index .GroupLabels "alertname" }}]({{ template "__alertmanagerURL" . }})**
{{ if gt (len .Alerts.Firing) 0 -}}

{{ template "default.__text_alert_list" .Alerts.Firing }}


{{- end }}

{{ if gt (len .Alerts.Resolved) 0 -}}
{{ template "default.__text_alertresovle_list" .Alerts.Resolved }}


{{- end }}
{{- end }}

{{/* Legacy */}}
{{ define "legacy.title" }}{{ template "__subject" . }}{{ end }}
{{ define "legacy.content" }}#### [{{ .Status | toUpper }}{{ if eq .Status "firing" }}:{{ .Alerts.Firing | len }}{{ end }}] **[{{ index .GroupLabels "alertname" }}]({{ template "__alertmanagerURL" . }})**
{{ template "__text_alert_list" .Alerts.Firing }}
{{- end }}

{{/* Following names for compatibility */}}
{{ define "ding.link.title" }}{{ template "default.title" . }}{{ end }}
{{ define "ding.link.content" }}{{ template "default.content" . }}{{ end }}
- 启动 prometheus-webhook-dingtalk
shell> /usr/local/dingtalk/prometheus-webhook-dingtalk --config.file=/usr/local/dingtalk/config.yml 2>&1 &
- 查看服务已启动
# netstat  -ntpl |grep 8060
tcp6       0      0 :::8060                 :::*                    LISTEN      8874/prometheus-web
配置 alertmanager webhook
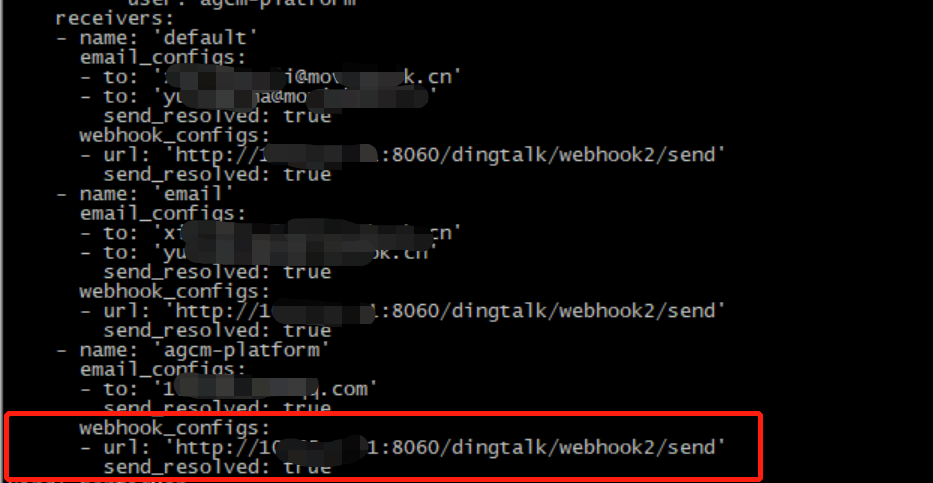
- 在 alertmanager 中新增加 webhook 内容
    receivers:
    - name: 'default'
      email_configs:
      - to: 'xi@mov.cn'
        send_resolved: true
      webhook_configs:
      - url: 'http://10.6.9.9:8060/dingtalk/webhook2/send'
        send_resolved: true
- 查看钉钉告警内容
prometheus 之告警收敛
- 抑制(Inhibition):当警报发出后,停止重复发送由此警报引发的其他警报
配置 alertmanager

    inhibit_rules:
      - source_match:            #匹配当前告警发生后其他告警抑制掉
          severity: 'error'      #指定告警级别
        target_match:            #抑制告警
          severity: 'warning'    #指定抑制告警级别
        equal: ['instance','kubernetes_name']  #只有包含指定标签才可成立规则
例如有两个告警邮件,发出报警内容一致,只是在告警规则 labels:  severity: error/warming  中配置不一致;
因此根据 alertmanager 中设置只有告警级别为  error 的才能发出警报