-
25s 准备时间:决定用什么模板,用模板cover那些信息点
-
Content: 数字和文字哪个多,就多说哪个,均匀覆盖
-
Fluency : 保持流利度
-
不要纠结时态,单复数,人称代词等
-
时间要求: 尽量35‘ 说完,直接点击next(防止周围声音混入)
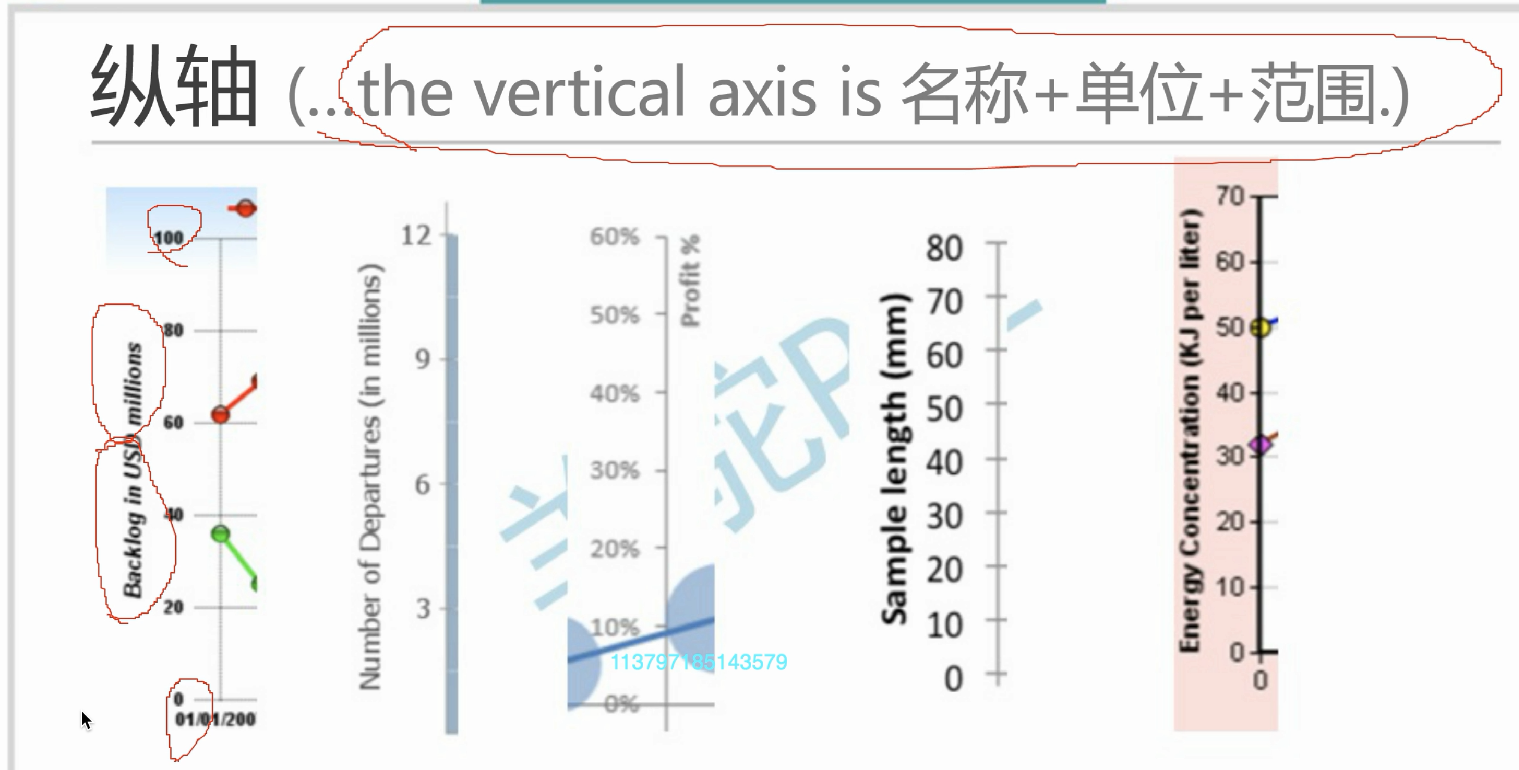
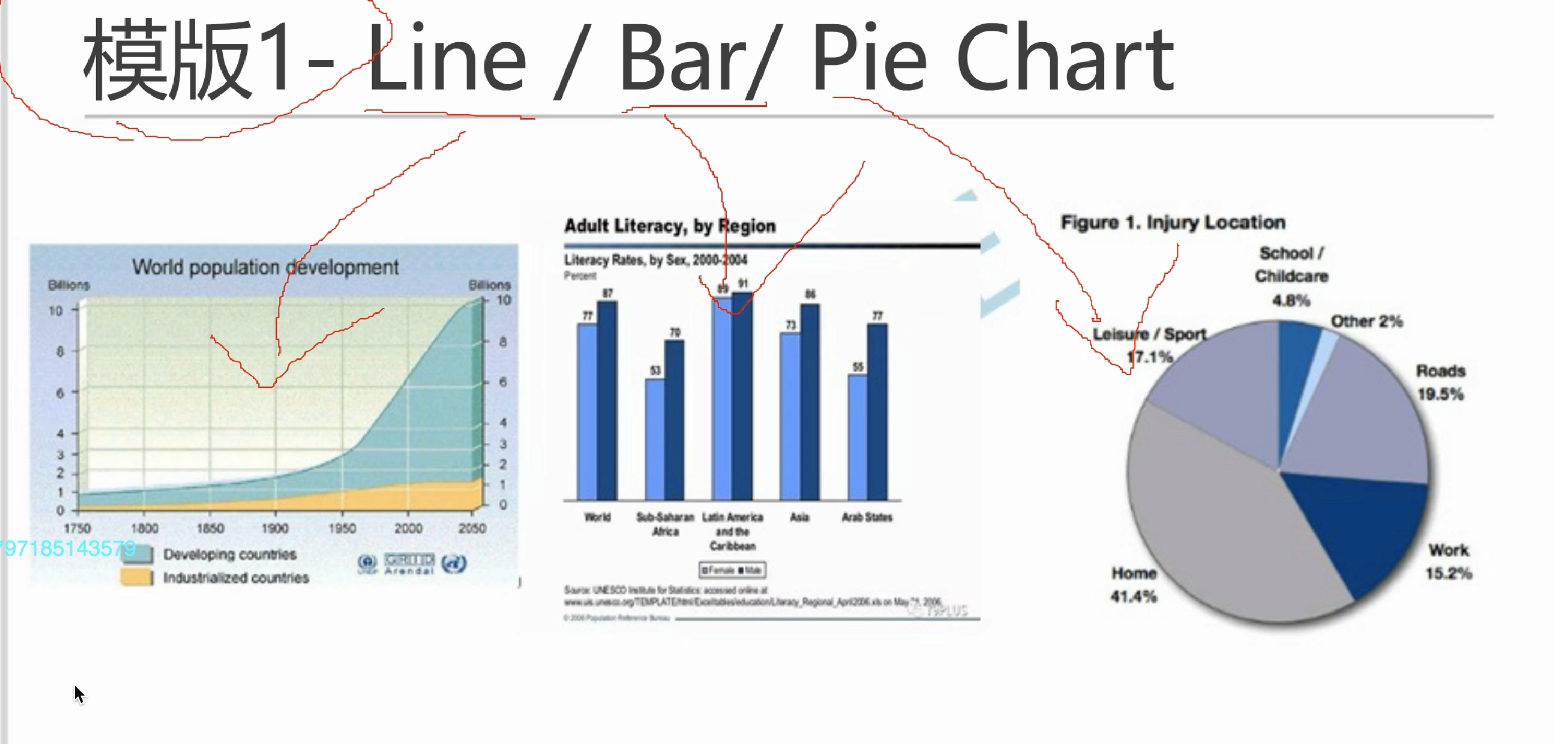
模板1 - Line /Bar / Pie Chart
-
The following graph shows the data of the survey and it is about__(标题)__.(标题丝毫都不变)
-
It is shown that the items include __(3点相关,看图有什么说什么)___and the vertical axis is _名字,in单位,范围from * to*.有什么说什么. 横轴变为horizontal axis
-
According to this graph, it can be seen that the highest value is______,which is around______. 最大
-
On the contrary, the lowest value is ,which is around__. 最小
-
It is clear that the number of is much higher than that of_____. 对比随便挑。看哪个顺眼读哪个
-
In conclusion,this trend will continue in the future.
同一个词说一次就够了,再提没分。