grid包是一个底层的绘图系统,能够灵活地控制图形输出的外观和布局,但是grid包不提供创建完整图形的高级绘图系统,例如,ggplot2和lattice,而是提供绘制开发这些高级绘图的基础接口,例如:定制lattice的输出,产生高水平图或非统计图,为输出添加复杂注释。在绘图时,有时候会遇到这样一种情景,客户想把多个代表不同KPI的图形分布到同一个画布(Page)上,而且每一个图形都是单独绘制的。对于这种需求,可以使用grid包来实现,grid包能把图形逐个地添加到画布中,并按照业务的需求,把图形摆放到合适的位置上去。在布局完成之后,把图形绘制出来。
一,grid包概述
grid包不仅可以输出图形,还可以产生可编辑的图形组件,这些图形组件可以被复用和重组,并能把图形输出到指定的位置上。在使用grid包之前,需要安装和载入grid包:
install.packages("grid")
library(grid)
1,绘图原语
常用的绘图原语的明明格式是grid.**,用于输出图形:
grid.rect(...)
grid.lines(...)
grid.polygon(...)
grid.circle(...)
grid.text(...)
用户可以通过参数修改绘图函数输出的图形:
grid.rect(x = unit(0, “native"), y = unit(1.5, “npc"), height = unit(0.5, "inches"), width = unit(0.8, “lines”),
    gp=gpar(col="red", lwd=2, fill="yellow", lty="dotted"))
2,Grob对象
每一个绘图原语都对应一个Grob,grob的命名格式是**Grob,Grob对象是一个可编辑的图形组件,该组件保留图形的所有属性,但不会立即输出图形:
rectGrob(...)
linesGrob(...)
polygonGrob(...)
circleGrob(...)
textGrob(..)
要输出Grob表示的图形,可以使用grid.draw()函数绘制图形:
rect <- rectGrob(...)
grid.draw(rect)
二,核心对象viewport
绘制图形需要画布,是R的绘图设备,在grid包中,画布被定义为page,通过函数newpage()创建一个新的画布:
grid.newpage()
viewport是grid包的核心对象,简单来说,它就是画布中的一个矩形的绘图区域,直译为视口,通过viewport()函数新建一个viewport对象:
viewport(x = unit(0.5, "npc"), y = unit(0.5, "npc"),
         width = unit(1, "npc"), height = unit(1, "npc"),
         default.units = "npc", just = "centre",
         gp = gpar(), clip = "inherit",
         xscale = c(0, 1), yscale = c(0, 1),
         angle = 0,
         layout = NULL,
         layout.pos.row = NULL, layout.pos.col = NULL,
         name = NULL)
参数注释:
- x:视口的几何中心点相对页面左下角原点的x坐标轴,默认单位是npc
- y:视口的几何中心点相对页面左下角原点的y坐标轴,默认单位是npc
- width:视口的宽度(x轴方向)
- height:视口的高度(y轴方向)
- default.units:默认单位为npc (Normalised Parent Coordinates),含义是规范化化的父区域坐标
- just:x和y所指的位置,默认为矩形中心位置
- gp:gpar对象,用于设置图形参数;
- clip:裁剪区域,有效值是“on”,“inherit”或“off”,指示剪裁到视口范围内,从父视口继承剪裁区域,或者完全关闭剪裁。 为了后向兼容性,逻辑值TRUE对应于“on”,而FALSE对应于“inherit”
- xscale,yscale:两个数值元素的向量,用于表示坐标轴的最小值和最大值。
- angle:把视口逆时针旋转的角度
- layout:布局(grid.layout)对象,用于把视口划分为多个子区域
- layout.pos.row,layout.pos.col:子区域在父布局中的行位置和列位置
- name:此视口的名字,用于搜索和定位
viewport是绘图的基础,创建一个viewport:
vp <- viewport(x = 0.5, y = 0.5, width = 0.5, height = 0.25, angle=45)
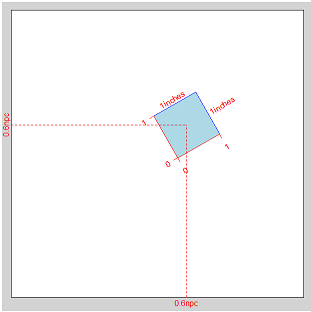
通过函数grid.show.viewport()查看创建的视口:
grid.show.viewport(viewport(x=0.6, y=0.6, width=unit(1, "inches"), height=unit(1, "inches"), angle=30))
height和width是矩形的长和宽,x和y是视口中心点(也就是,矩形的几何中心点)距离x坐标抽和y坐标轴的距离:
三,基于viewport绘制图形
使用grid包绘图时,首先要创建一个空的画布:
grid.newpage()
在画布中创建viewport对象:
vp <- viewport(x = 0.5, y = 0.5, width = 0.5, height = 0.25, angle=45)
此时,画布中是空的,需要把viewport推到画布中:
pushViewport(vp)
viewport是绘图的区域,也就是说,基于viewport绘制图形,在视口规定的范围内作图,例如,向视口中绘制矩形。
grid.rect()

四,viewport树
grid包为每一个画布维护了一个由viewport构成的树,树的根节点是由系统创建的,名字是ROOT的viewport,每一个节点都是一个viewport。活跃viewport是树的当前位置,在树中是唯一的,用户只能向活跃viewport中绘图,所有的操作都是基于活跃viewport。viewport()函数用于创建viewport,而一个viewport只有被push到viewport树中,才能在其区域中绘图。
通过5个函数实现对viewport树的遍历和更新:
- pushViewport()函数:向活跃viewport中添加一个viewport,作为树中的活跃viewport,原活跃viewport变成父viewport,这意味着,当一个viewport被push到树中时,该viewport变成活跃viewport,是原活跃viewport的子viewport。
- popViewport()函数:把活跃viewport从树中删除,其父viewport变成活跃viewport。
- upViewport()函数:导航到活跃viewport的父viewport,当前viewport变成活跃viewport,原viewport不会被删除;
- downViewport()函数:导航到活跃viewport的父viewport,当前viewport变成活跃viewport,原viewport不会被删除;
- searchViewport()函数:根据viewport的名字,导航到任意viewport,当前viewport变成活跃viewport,原viewport不会被删除。
注意:当向树中push一个viewport时,如果树中存在一个级别(level)相同,名字相同的viewport,那么push操作会把该viewport替换掉。
There is only ever one current viewport, which is the current position within the viewport tree. All drawing and viewport operations are relative to the current viewport. When a viewport is pushed it becomes the current viewport. When a viewport is popped, the parent viewport becomes the current viewport. Use upViewport to navigate to the parent of the current viewport, without removing the current viewport from the viewport tree. Use downViewport to navigate to a viewport further down the viewport tree and seekViewport to navigate to a viewport anywhere else in the tree.
查看当前的viewport树结构:
current.vpTree()
例如,下面我们连续push三个viewport到一个图形中。
grid.newpage()
colvec <- c('red', 'green', 'blue')
xvec <- c(0.3, 0.4, 0.5)
for (i in 1 : 3) {
  vp <- viewport(x = xvec[i], y = 0.5, width = 0.4, height = 0.4,
                 gp = gpar(col = colvec[i]))
  pushViewport(vp)
  grid.rect()
}
绘制的图形依次嵌套,这说明,每push一次,原活跃viewport都变成父节点,把当前的veiwport作为子viewport:

五,布局
grid包中定义了布局对象,布局是矩形的子分区,也就是说,布局(layout)把一个矩形区域细分为更小的分区。
grid.layout(nrow = 1, ncol = 1,
    widths = unit(rep_len(1, ncol), "null"), heights = unit(rep_len(1, nrow), "null"),
    default.units = "null", respect = FALSE, just="centre")
参数注释:
- nrow,ncol:布局分为多少个行和列,每一个行和列构成的单元叫做分区(subdivision)
- widths,heights:每一个分区的宽和高
- default.units:默认单位
- respect:逻辑值,如果为true,指定行高度和列宽度都遵守。
- just:指定对齐方式,有效的值是:"left", "right", "centre", "center", "bottom", 和 "top".
1,创建布局
把top.vp视口分割为3X3的分区,使用函数grid.show.layout()查看布局,创建的布局如下图所示:
layout <- grid.layout(nrow=3, ncol=3,
                   widths=unit(c(5, 1, 2), c("lines", "null", "lines")),
                   heights=unit(c(5, 1, 4), c("lines", "null", "lines")))

top.vp <-viewport(layout=layout, name="top")

grid.show.layout(layout)
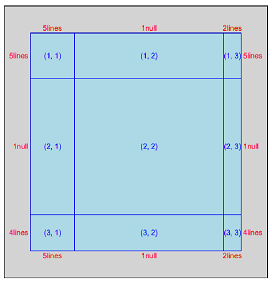
创建一系列的viewport,占用布局的各个分区,由于没有push任何viewport,因此画布中没有绘制任何图形。在为每个视口命名时,使用统一的格式:margin+数值,如下代码所示:
margin1 <- viewport(layout.pos.col = 2, layout.pos.row = 3, name = "margin1") #(3,2)
margin2 <- viewport(layout.pos.col = 1, layout.pos.row = 2, name = "margin2") #(2,1)
margin3 <- viewport(layout.pos.col = 2, layout.pos.row = 1, name = "margin3") #(1,2)
margin4 <- viewport(layout.pos.col = 3, layout.pos.row = 2, name = "margin4") #(2,3)
plot <- viewport(layout.pos.col = 2, layout.pos.row = 2, name = "plot")       #(2,2)
R用数字来表示位置,数值代表的含义是:1=Buttom,2=Left,3=Top,4=Right,视口被布局分割的分区如下图所示:

2,创建viewport树
使用vpList()把视口排列成一个树形结构,并把top.vp作为视图的父节点,把所有其他视口作为子节点,使用vpTree()创建一个viewport树:
splot <- vpTree(top.vp, vpList(margin1, margin2, margin3, margin4, plot))
把整个viewport树push到活跃视口中,这样,在绘图区域中,我们可以在不同的散点视口中绘制图形。
pushViewport(splot)
在把整个树push到活跃视口之后,就可以在不同的区域内绘制图形,使用seekViewport()函数按照视口名称切换到指定的视口,并把当前视口激活。
seekViewport("plot")
grid.xaxis()
grid.yaxis()
grid.rect()
grid.points(x, y)
完整的代码如下:
library(grid)

layout <- grid.layout(nrow=3, ncol=3,
                      widths=unit(c(5, 1, 2), c("lines", "null", "lines")),
                      heights=unit(c(5, 1, 4), c("lines", "null", "lines")))
#grid.show.layout(layout)

top.vp <-viewport(layout=layout,name="top")
#grid.show.viewport(top.vp)

x <- runif(10)
y <- runif(10)
xscale <- extendrange(x)
yscale <- extendrange(y)

margin1 <- viewport(layout.pos.col = 2, layout.pos.row = 3, name = "margin1")
margin2 <- viewport(layout.pos.col = 1, layout.pos.row = 2, name = "margin2")
margin3 <- viewport(layout.pos.col = 2, layout.pos.row = 1, name = "margin3")
margin4 <- viewport(layout.pos.col = 3, layout.pos.row = 2, name = "margin4")
plot <- viewport(layout.pos.col = 2, layout.pos.row = 2, name = "plot",xscale = xscale, yscale = yscale)

splot <- vpTree(top.vp, vpList(margin1, margin2, margin3, margin4, plot))
#grid.show.viewport(splot)

pushViewport(splot)

seekViewport("plot")
grid.xaxis()
grid.yaxis()
grid.rect()
grid.points(x, y,pch=20)

seekViewport("margin1")
grid.text("Random X", y = unit(1, "lines"))

seekViewport("margin2")
grid.text("Random Y", x = unit(1, "lines"), rot = 90)
3,把图形逐个打印到视口中
利用布局在同一个画布中绘制多个图形的另外一种方法是使用print()函数,代码摘抄于《R统计绘图(2):grid布局》。
step1,创建多个图形
library(grid)
library(ggplot2)
# prepare ggplot charts
p.hist.len <- ggplot(iris) + geom_histogram(aes(x=Sepal.Length))
p.hist.wid <- ggplot(iris) + geom_histogram(aes(x=Sepal.Width)) + coord_flip()
p.scatter <- ggplot(iris) + geom_point(aes(x=Sepal.Length, y=Sepal.Width))
step2,创建布局,分割视口,并push当前视口
grid.newpage()
pushViewport(viewport(layout = grid.layout(3, 3)))
step3,把图形输出到布局的不同区域中
print(p.scatter, vp=viewport(layout.pos.row=2:3, layout.pos.col=1:2))
print(p.hist.len, vp=viewport(layout.pos.row=1, layout.pos.col=1:2))
print(p.hist.wid, vp=viewport(layout.pos.row=2:3, layout.pos.col=3))
六,unit对象和gpar对象
在grid包中,unit对象用于表示:长度和单位,gpar对象用于设置:图形参数
1,unit对象
用unit对象表示长度的大小和单位:
unit(x, units, data=NULL)
参数注释:
- x:数值向量
- units:单位向量
2,gpar对象
用gapr对象表示图形参数:
- col: Colour for lines and borders.
- fill: Colour for filling rectangles, polygons, ...
- alpha: Alpha channel for transparency
- lty: Line type
- lwd: Line width
- lex: Multiplier applied to line width
- lineend: Line end style (round, butt, square)
- linejoin: Line join style (round, mitre, bevel)
- linemitre: Line mitre limit (number greater than 1)
- fontsize: The size of text (in points)
- cex: Multiplier applied to fontsize
- fontfamily: The font family
- fontface: The font face (bold, italic, ...)
- lineheight: The height of a line as a multiple of the size of text
- font: Font face (alias for fontface; for backward compatibility)
参考文档: