1 Metricbeat 部署
1.Metricbeat组成
Metricbeat有2部分组成,一部分是Module,另一部分为Metricset。
(1)Module
收集的对象,如:mysql、redis、nginx、操作系统等;
(2)Metricset
收集指标的集合,如:cpu、memory、network等;
2.部署Metricbeat
#yum install -y metricbeat
#cd /etc/metricbeat
#cp -apr /etc/metricbeat/metricbeat.yml /etc/metricbeat/metricbeat.yml.bak
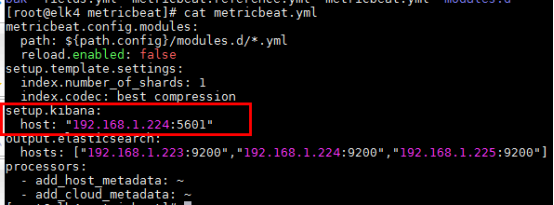
#cat /etc/metricbeat/metricbeat.yml
metricbeat.config.modules:
path: ${path.config}/modules.d/*.yml
reload.enabled: false
setup.template.settings:
index.number_of_shards: 1
index.codec: best_compression
setup.kibana:
host: "192.168.1.224:5601"
output.elasticsearch:
hosts: ["192.168.1.223:9200","192.168.1.224:9200","192.168.1.225:9200"]
processors:
- add_host_metadata: ~
- add_cloud_metadata: ~
#metricbeat -e
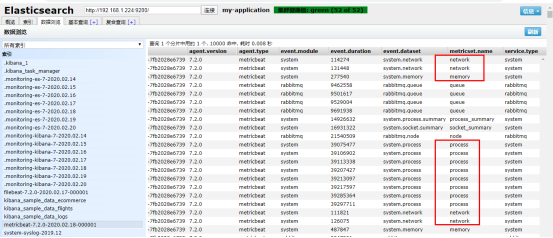
在ELasticsearc-head中可以看到,系统的一些指标数据已经写入进去了:
2 Metricbeat Module
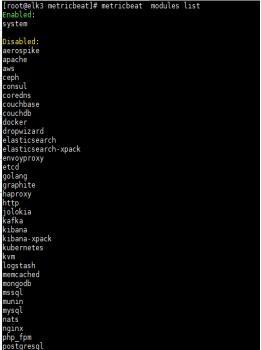
1.查看列表(system模版默认启用 )
#metricbeat modules list
2.启用Nginx Module
#metricbeat modules enable rabbitmq
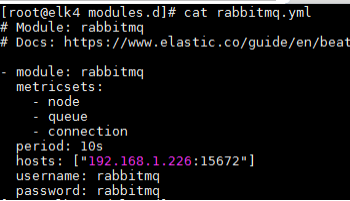
#修改Nginx Module配置
#cat /etc/metricbeat/modules.d/rabbitmq.yml
#启动
#metricbeat -e
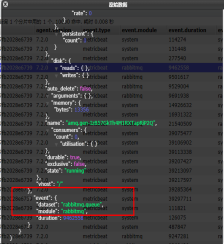
在ELasticsearc-head中可以看到相应数据
更多的Module使用参见官方文档:
https://www.elastic.co/guide/en/beats/metricbeat/current/metricbeat-modules.html
3 Metricbeat 指标仪表板
可以将Metricbeat的数据在Kibana中展示。
#修改metricbeat配置
#cat metricbeat.yml
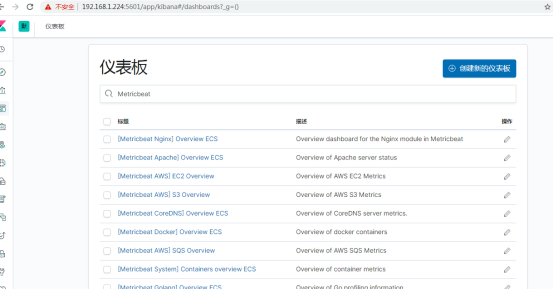
#安装仪表盘到Kibana
#metricbeat setup --dashboards
#启动metricbeat
#systemctl start metricbeat
即可在Kibana中看到仪表盘数据:

其他生成图表参考:
https://www.cnblogs.com/minseo/p/10607540.html