想通过图形化的方式显示社交网络特定用户的好友关系,上网找了一下这方面的图形库有networkx、graphviz等,找了好久我选择了iGraph这个图形库。
igraph在Windows下的安装稍微有点麻烦,详情参见:https://my.oschina.net/stu51/blog/335455
fans.txt 和 follow.txt分别保存了爬取下来的粉丝昵称以及关注人昵称。
#coding=utf-8
from igraph import *

count_fans=0            #粉丝数
count_following=0       #关注人数
fans_name=[]            #粉丝昵称
following=[]            #关注人昵称
#打开爬取下的昵称文件
with open('fans.txt','r') as f:
    lines=f.readlines()
    for line in lines:
        if (line!=None)&(line!='\n'):
            fans_name.append(line)
            # print fans_name
            count_fans+=1
with open('follow.txt','r') as c:
    lines=c.readlines()
    for line in lines:
        if (line!=None)&(line!='\n'):
            following.append(line)
            count_following+=1

g = Graph()          #创建
g.add_vertices(3+count_fans+count_following)
g.add_edges([(0,1),(1,2)])

g.vs[0]["name"]='Ta的粉丝'
g.vs[1]["name"]='目标用户'
g.vs[2]["name"]='Ta的关注'
g.es["trunk"] = [True, True]
g.vs["main_node"]=[1.5,3,1.5]

for i in range(3,count_fans+3):
    g.add_edges((0,i))
    g.es[i-1]["trunk"]=False
for j in range(count_fans+3,3+count_fans+count_following):
    g.add_edges((2,j))
    g.es[j-1]["trunk"]=False

index=3
for fans in fans_name:
    g.vs[index]["name"]=fans
    g.vs[index]["main_node"]=False
    index+=1
for name in following:
    g.vs[index]["name"]=name
    g.vs[index]["main_node"]=False
    index+=1

visual_style = {}
color_dic={1.5:"#cfe6ff",3:"#7299a7",False:"#cfe6ff"}
visual_style["vertex_label_size"]=11
visual_style["vertex_label_dist"]=1
visual_style["vertex_shape"]="circle"
visual_style["vertex_size"] = [7+ 10*int(main_node) for main_node in g.vs["main_node"]]
visual_style["edge_width"] = [1 + 2 * int(trunk) for trunk in g.es["trunk"]]
visual_style["vertex_color"] =[color_dic[main_node] for main_node in g.vs["main_node"]]
visual_style["vertex_label"] = g.vs["name"]
visual_style["bbox"] = (1000, 1000)
visual_style["margin"] = 150
layout = g.layout("grid_fr")
visual_style["layout"] = layout
plot(g, **visual_style)
最终结果如图:
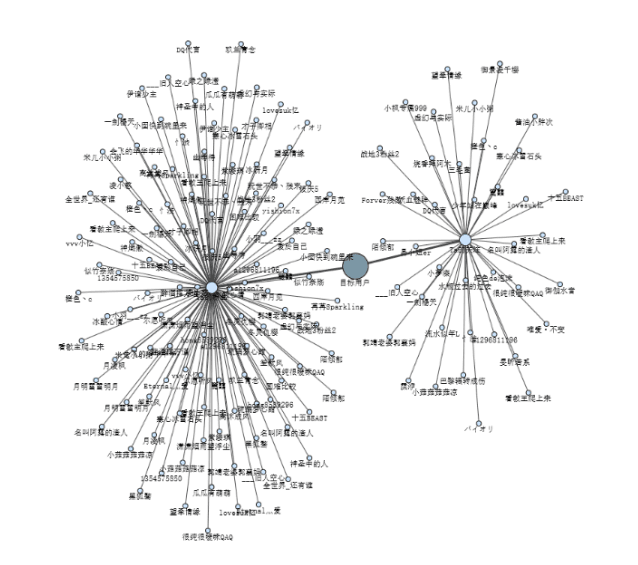
以上只演示了一个用户的社交关系图,有精力的话可以尝试递归地一层一层爬下去,想象一下最终绘出来的图也是挺炫酷的。