在线性回归的基础上加上正则项:
 1 # -*-coding:utf-8 -*-
 2 '''
 3 Created on 2016年12月15日
 4
 5 @author: lpworkdstudy
 6 '''
 7 import numpy as np
 8 from numpy.core.multiarray import dtype
 9 import matplotlib.pyplot as plt
10
11
12 filename = "ex1data1.txt"
13 alpha = 0.01
14
15
16 f = open(filename,"r")
17 data = []
18 y = []
19 for item in f:
20     item = item.rstrip().split(",")
21     data.append(item[:-1])
22     y.append(item[-1:])
23 Data = np.array(data,dtype= "float64")
24 Y = np.array(y,dtype = "float64")
25 Y = (Y-Y.mean())/(Y.max()-Y.min())
26 One = np.ones(Data.shape[0],dtype = "float64")
27 Data = np.insert(Data, 0, values=One, axis=1)
28 for i in range(1,Data.shape[1]):
29     Data[:,i] = (Data[:,i]-Data[:,i].mean())/(Data[:,i].max()-Data[:,i].min())
30 theta = np.zeros((1,Data.shape[1]),dtype= "float64")
31
32 def CostFunction(Data,Y,theta):
33     h = np.dot(Data,theta.T)
34     cost = 1/float((2*Data.shape[0]))*(np.sum((h-Y)**2) + np.sum(theta[0,1:]**2) )
35     return cost
36 def GradientDescent(Data,Y,theta,alpha):
37     costList = []
38     for i in range(100000):
39         temp = theta[0,0] - (alpha/Data.shape[0]*np.dot(Data[:,:1].T,(np.dot(Data,theta.T)-Y))).T
40         theta[0,1:] =  (1-alpha/Data.shape[0])*theta[0,1:]- (alpha/Data.shape[0]*np.dot(Data[:,1:].T,(np.dot(Data,theta.T)-Y))).T
41         theta[0,0] = temp
42         cost = CostFunction(Data, Y, theta)
43         costList.append(cost)
44     plt.figure(1, figsize=(12,10), dpi=80, facecolor="green", edgecolor="black", frameon=True)
45     plt.subplot(111)
46
47     plt.plot(range(100000),costList)
48     plt.xlabel("the no. of iterations")
49     plt.ylabel("cost Error")
50     plt.title("LinearRegression")
51
52     plt.savefig("LinearRegressionRegularized.png")
53     return theta
54 if __name__ == "__main__":
55     weight = GradientDescent(Data,Y,theta,alpha)
56     print weight
57     cost = CostFunction(Data, Y, weight)
58     print cost

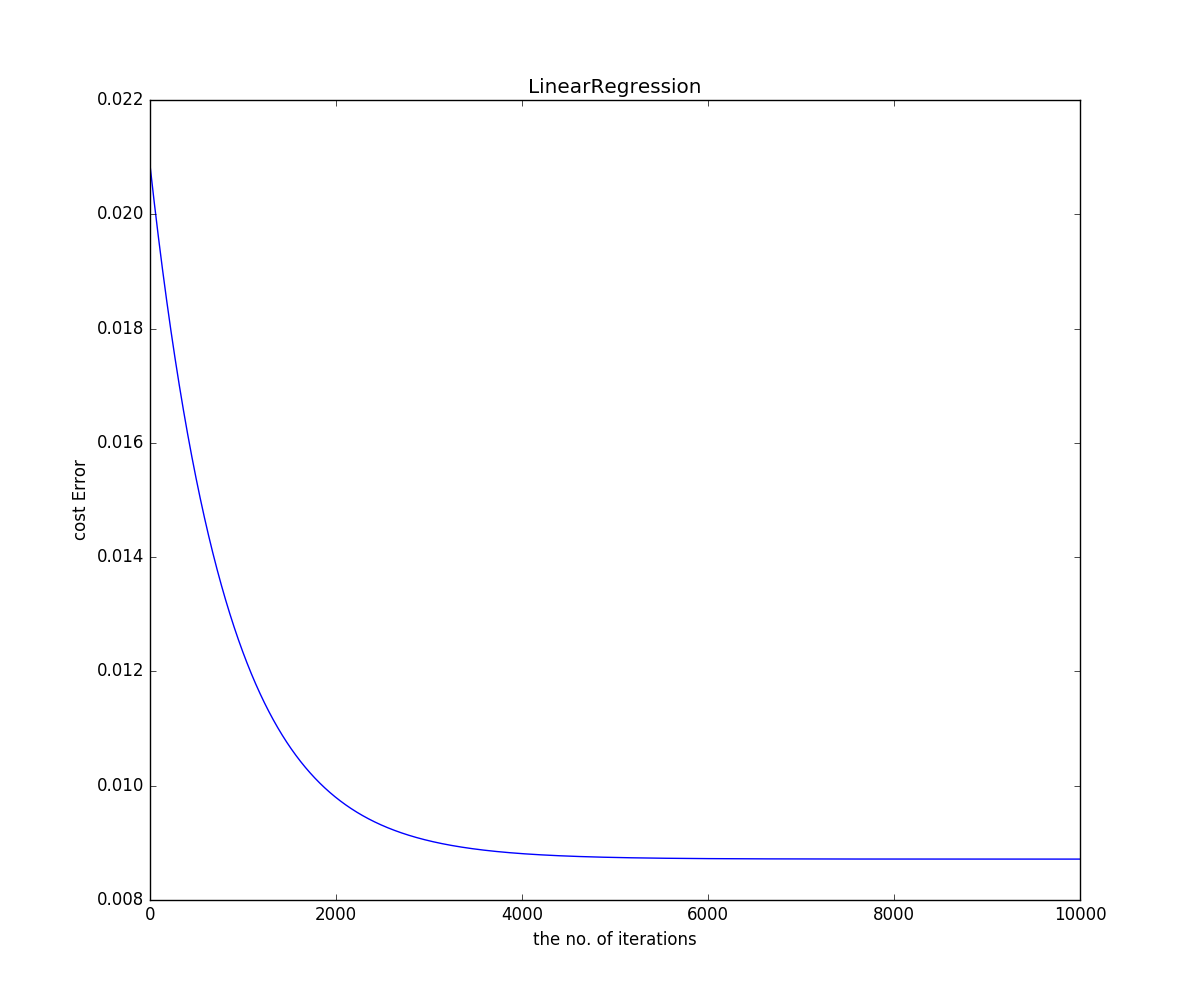
运行得出损失函数随迭代次数的变化曲线如下图:

可以看出加入正则项并没有优化我们的模型,反而产生了不好的
影响,所以我们在解决问题时,不要盲目使用正则化项。