说明:任何一个运行的平台都需要一个很清楚的报表来显示,那么作为Java开源生鲜电商平台而言,我们应该如何设计报表呢?或者说我们希望报表来看到什么数据呢?
通过报表我们可以分析出目前整个公司的运营情况,以及下一步的调整方向,这样更加有理有据的掌握整个市场与决策。
设计基础维度:
1. 今日订单,今日营业额,总订单数,总营业额
2. 今日的注册买家,总的注册买家。
3. 实时的营收,实时的下单买家。
4. 今日下单买家,空降A(空降A指的是今天注册同时下单的客户)
数据的力量在于清楚的明白的告诉整个系统运营人员,昨天我们的销售团队创造了多少的业绩,以及整个趋势是怎么样的,今天的努力方向是怎么样的,昨天的所获是怎么样的
如何进行一起努力与学习。
业务分析: 今日订单,今日营业额,总订单数,总营业额等来源于订单表以及订单汇总表。鉴于数据量并不是很大,所以可以实时的进行查询。
如果存在数据量过大,比如订单表我们有100w的数量,那么可以采用定时器在规定的时间内进行执行,然后把统计结果放在统计表中
统计表的系统设计如下:

CREATE TABLE `report_days` (
  `id` bigint(20) DEFAULT NULL,
  `order_number_count` int(11) DEFAULT NULL COMMENT '今日订单数',
  `order_rmb_count` decimal(12,2) DEFAULT NULL COMMENT '今日营业额',
  `order_number_amount` int(11) DEFAULT NULL COMMENT '总订单数',
  `order_rmb_amount` decimal(12,2) DEFAULT NULL COMMENT '总营业额',
  `create_time` datetime DEFAULT NULL COMMENT '创建时间'
) ENGINE=InnoDB DEFAULT CHARSET=utf8 COMMENT='每日报表';
说明:其实就是向这里面进行数据的更新与增加操作即可,每天进行报表的读取与显示
不过有些网友提出采用缓存来处理,我个人的意见是不需要。数据也没那么多,而且都是定时器来执行,缓存的价值与意义很小。
相关的执行代码如下:
@Component
public class TaskReport {

    private static final Logger logger=LoggerFactory.getLogger(TaskReport.class);

    @Autowired
    private BuyerOrderReportService buyerOrderReportService;

    @Autowired
    private ReportDayService reportDayService;

    @Autowired
    private BillService billService;
    /**
     * 计算每天报表;
     *    每日上午6:00触发
     */
    @Scheduled(cron="0 0 6 * * ?")
    protected void day(){
        try{
            logger.info("TaskReport.day.start");
            //统计每天订单报表;
            Integer today = 0;//0表示今天    1表示昨天;
            reportDayService.insertBatch(today);
            //统计买家每日订单金额;
            buyerOrderReportService.insertBatch(today);
        }catch(Exception e){
            logger.error("TaskReport.day.exception",e);
        }finally {
            logger.info("TaskReport.day.end");
        }
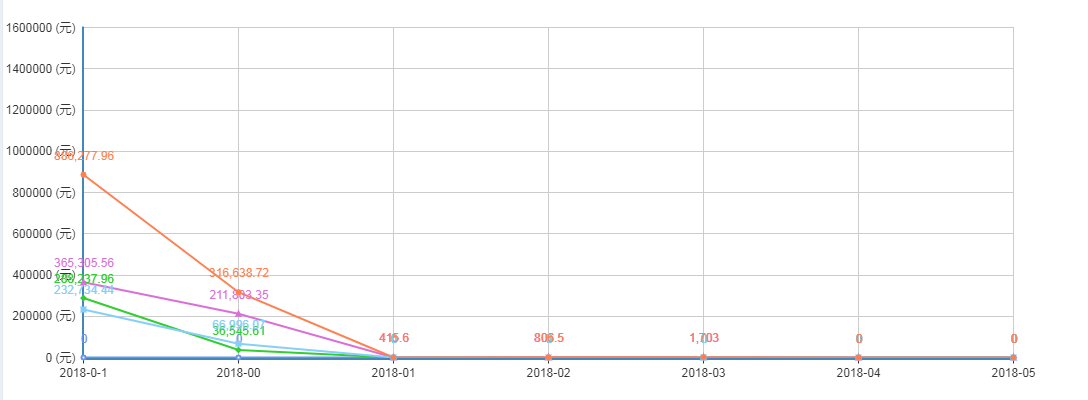
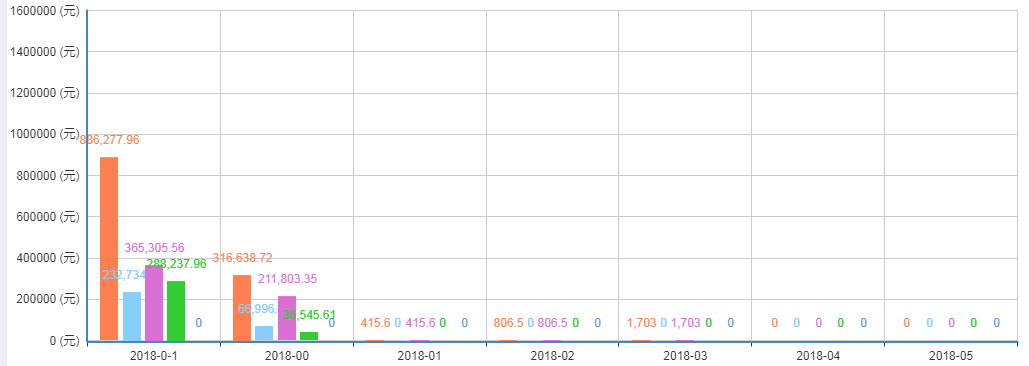
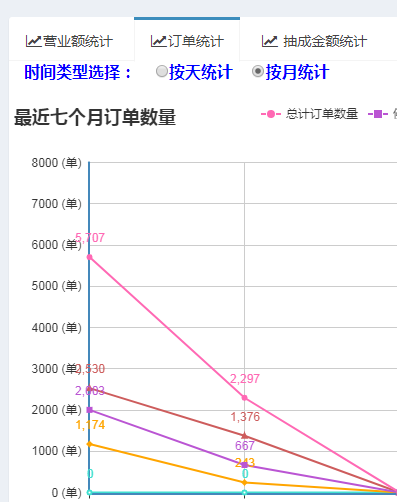
2. 相关的报表的形状显示,目前折线图,柱状图是比较理想的一种方式,采用百度的echarts进行显示
相关的运行实例如下:
补充说明:相关的echarts的用法,这边就不列举了,的确蛮简单的,返回json给echarts所需要的数据格式即可。
代码这里只贴出相对核心的代码:
public class IndexController extends BaseController {

    private static final Logger logger = LoggerFactory.getLogger(IndexController.class);

    @Autowired
    private OrderInfoService orderInfoService;

    @Autowired
    private OrderItemService orderItemService;

    @Autowired
    private SalesService salesService;

    @Autowired
    private BuyerService buyerService;

    @Autowired
    private SellerService sellerService;

    @Autowired
    private ReportedService reportedService;

    @RequestMapping(value = "/index", method = { RequestMethod.GET, RequestMethod.POST })
    public String index(HttpServletRequest request, HttpServletResponse response, Model model, Long areaId) {

        logger.info("[IndexController][index] :查询订单统计数据");
        try {

            // 查询订单总数量和金额
            Map<String, Object> totalMap = orderInfoService.getCountAndAmount();
            int totalCount = (int) totalMap.get("count");
            BigDecimal totalAmount = (BigDecimal) totalMap.get("amount");
            if (totalAmount == null) {
                totalAmount = BigDecimal.ZERO;
            }
            // 查询今日的订单总数量和金额
            Map<String, Object> todayMap = orderInfoService.getOrderCountAndAmountByToday();
            int todayOrderCount = (int) todayMap.get("count");
            BigDecimal todayOrderAmount = (BigDecimal) todayMap.get("amount");
            if (todayOrderAmount == null) {
                todayOrderAmount = BigDecimal.ZERO;
            }

            // 查询实时的订单总数量和金额
            Map<String, Object> realTimeRevenueMap = orderInfoService.getRealTimeRevenueCount();
            int realTimeOrderCount = (int) realTimeRevenueMap.get("count");
            BigDecimal realTimeOrderAmount = (BigDecimal) realTimeRevenueMap.get("amount");
            if (realTimeOrderAmount == null) {
                realTimeOrderAmount = BigDecimal.ZERO;
            }

            // 入驻买家数量
            int totalBuyerCount = buyerService.getBuyerCount(null);
            // 当日注册买家数量
            int todayBuyercount = buyerService.getDailyBuyerCount();
            // 当日入驻卖家数量
            int todaySellerCount = sellerService.getDailySellerCount();

            model.addAttribute("totalCount", totalCount);
            model.addAttribute("totalAmount", totalAmount);
            model.addAttribute("todayOrderCount", todayOrderCount);
            model.addAttribute("todayOrderAmount", todayOrderAmount);
            model.addAttribute("totalBuyerCount", totalBuyerCount);
            model.addAttribute("todayBuyercount", todayBuyercount);
            model.addAttribute("todaySellerCount", todaySellerCount);
            model.addAttribute("realTimeOrderAmount", realTimeOrderAmount);
            model.addAttribute("realTimeOrderCount", realTimeOrderCount);

            // 查询今儿下单买家数量和空降A;
            int order_buyerCount = orderInfoService.getBuyerCountByTodayOrder();
            int newBuyerNum = orderInfoService.getBuyerNumByThatDay();
            model.addAttribute("order_buyerCount", order_buyerCount);
            model.addAttribute("newBuyerNum", newBuyerNum);
            Reported reported = new Reported();
            reported.setrSolveStatus(1);
            int count = reportedService.getCount(reported);
            model.addAttribute("count", count);
        } catch (Exception ex) {
            logger.error("[IndexController][index] :exception", ex);
        }
        return "index";
    }
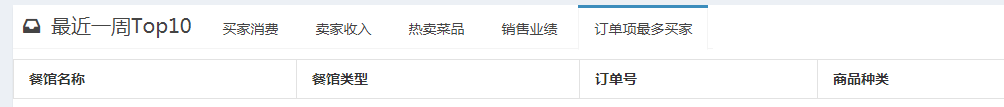
3.对于卖家而言,我们的报表需要有以下几个维度来统计(统计最新的TOP的卖家)
3.1 买家消费。
3. 2 卖家收入
3.3 热卖的菜品
3.4 销售业绩
3. 5 订单项最多的买家。
这里面也是些统计的数据,相对而言跟上面的买家维度差不多,代码方面也类似,无外乎需要的是多点数据库的查询与统计即可。
总结:其实整个报表的设计与实现过程并不难,难的是你为什么要这样设计,你通过这个运营的后台给整个项目的运营能够带来怎么样的用户体验与指导,
你需要通过数据来诊断这个销售团队过程中是否存在什么问题。有没什么刷单以及其他的作弊嫌疑在里面。
最后:很多人说系统功能很强大很好,但是我的一种思维方式是不一定,强大固然好,但是你需要通过这么多的系统数据中来分析出问题的关键,而不是所谓的代码堆积。
你所需要的是思考,再思考,最终思考。
转载自-- https://www.cnblogs.com/jurendage/p/9108863.html