案例1:使用逻辑回归模型,预测客户的信用评级
数据集中采用defect为因变量,其余变量为自变量
1.加载包和数据集
library(pROC)
library(DMwR)
model.df <- read.csv('E:\Udacity\Data Analysis High\R\R_Study\高级课程代码\数据集\第一天\4信用评级\customer defection data.csv',sep=',',header=T
2.查看数据集,
dim(model.df)
head(model.df)
str(model.df)
summary(model.df)
结论:一共有10000行数据,56个变量,其数据集中没有空值,但是有极大值存在
3,数据清洗
# 将Na的值补0
z <- model.df[,sapply(model.df, is.numeric)]
z[is.na(z)] = 0
summary(z)

# 去掉客户id和defect列
exl <- names(z) %in% c('cust_id','defect')
z <- z[!exl]
head(z)
# 将极大值点和取99%分位,极小值取1%分位
qs <- sapply(z, function(z) quantile(z,c(0.01,0.99)))
system.time(for (i in 1:ncol(z)){
  for( j in 1:nrow(z)){
    if(z[j,i] < qs[1,i]) z[j,i] = qs[1,i]
    if(z[j,i] > qs[2,i]) z[j,i] = qs[2,i]
  }
})
# 重新构建数据集
model_ad.df <- data.frame(cust_id=model.df$cust_id,defect=model.df$defect,z)
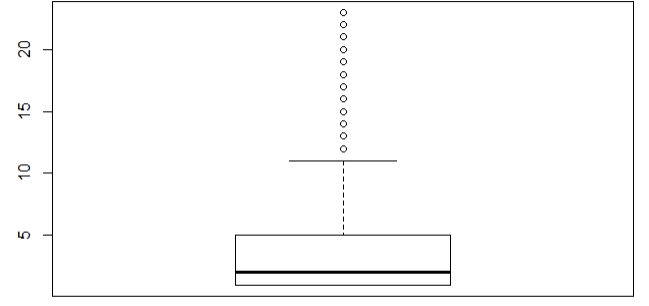
boxplot(model_ad.df$visit_cnt)

修改前 修改后
结论:visit_cnt不再有不符合业务的极大值出现
4.建模
set.seed(123)
# 将数据集分成训练集和测试集,一般是(70%是训练集,30%是测试集)
s <- sample(nrow(model_ad.df),floor(nrow(model_ad.df)*0.7),replace = F)
train_df <- model_ad.df[s,]
test_df <- model_ad.df[-s,]

# 去除掉cust_id
n <- names(train_df[-c(1,34)])
# 生成逻辑回归的公式
f <- as.formula(paste('defect ~',paste(n[!n %in% 'defect'],collapse = ' + ')))
# 建模
model_full <- glm(f,data=train_df[-c(1,34)],family = binomial)
summary(model_full)
# 模型检验direction 有三类参数both,backword,forward
# backword每次检验都减少一个因子,forword每次增加一个因子
# 同时AIC的值越小说明模型越好
step <- step(model_full,direction = 'both')
summary(step)
5.检验模型
# 使用测试集去预测模型
pred <- predict(step,test_df,type='response')
head(pred)
fitted.r <- ifelse(pred>0.5,1,0)
# 模型的精度
accuracy <- table(fitted.r,test_df$defect)
#做出roc的图像
roc <- roc(test_df$defect,pred)
roc
plot(roc)

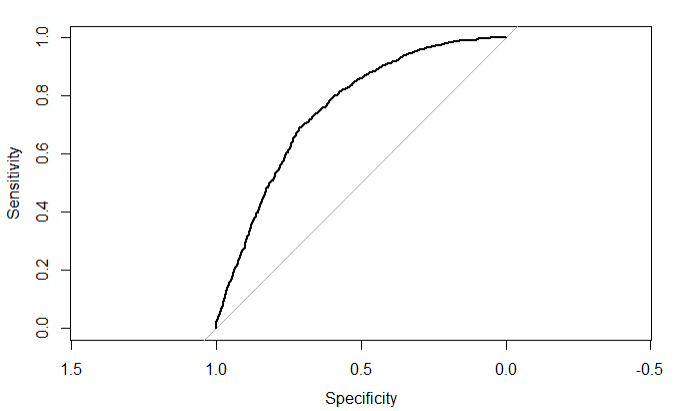
结论:roc的值是0.75说明模型有较好的的预测功能,一般模型的准确率要达到75%左右,否则需要进行调整
案例2:研究哪类用户是不良用户
1.数据集字段说明
 1 # SeriousDlqin2yrs 超过90天的逾期欠款
 2 # RevolvingUtilizationOfUnsecuredLines 无担保贷款的循环利用,除了车,房除以信用额度的综合的无分期债务的信用卡贷款
 3 # age 贷款人年龄
 4 # NumberOfTime30-59DaysPastDueNotWorse 30~59天逾期次数
 5 # DebtRatio 负债比例
 6 # MonthlyIncome 月收入
 7 # NumberOfOpenCreditLinesAndLoans 开放式和信贷的数量
 8 # NumberOfTimes90DaysLate 大于等于90天逾期的次数
 9 # NumberRealEstateLoansOrLines 不动产的数量
10 # NumberOfTime60-89DaysPastDueNotWorse 60~90天逾期次数
11 # NumberOfDependents 不包括本人的家属数量
2.导入数据集和包
library(pROC)
library(DMwR)
cs.df <- read.csv('E:\Udacity\Data Analysis High\R\R_Study\第二天数据\cs-data.csv',header=T,sep=',')
summary(cs.df)

结论:月收入这一栏出现的Na值较多
有一些值有异常值的存在,比如负债比,不动产数量,和家属成员数量,这些值会给模型带来不好的影响,所以要去除
3.数据清洗
# 使用knn邻近算法,补充缺失的月收入
cs.df_imp <- knnImputation(cs.df,k=3,meth = 'weighAvg')
#去除掉 30~60天逾期超过80的极大值
cs.df_imp <- cs.df_imp[-which(cs.df_imp$NumberOfTime30.59DaysPastDueNotWorse>80)]
# 去除掉负债比大于10000的极值
cs.df_imp <- cs.df_imp[-which(cs.df_imp$DebtRatio > 100000)]
# 去除掉月收入大于50万的极值
cs.df_imp <- cs.df_imp[-which(cs.df_imp$MonthlyIncome > 500000)]
4.建模
set.seed(123)
# 将数据集分成训练集和测试集,防止过拟合
s <- sample(nrow(cs.df_imp),floor(nrow(cs.df_imp)*0.7),replace = F)
cs.train <- cs.df_imp[s,]
cs.test <- cs.df_imp[-s,]
# 使用逻辑线性回归生成全量模型
# family=binomia表示使用二项分布
# maxit=1000 表示需要拟合1000次
model_full <- glm(SeriousDlqin2yrs~.,data=cs.train,family=binomial,maxit=1000)
# 使用回归的方式找出最小的AIC的值
step <- step(model_full,direction='both')
summary(step)

结论:pr的值小于0.05的因子才是有效因子,*越多越重要
5.查看模型
pred <- predict(step,cs.test,type = 'response')
fitted.r <- ifelse(pred>0.5,1,0)
accuracy <- table(fitted.r,cs.test$SeriousDlqin2yrs)
misClasificError <- mean(fitted.r!=cs.test$SeriousDlqin2yrs)
roc <- roc(cs.test$SeriousDlqin2yrs,pred)
plot(roc)
roc
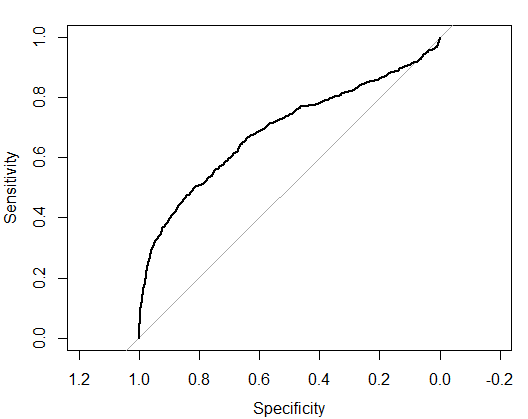

结论:预测的成功率只有69%
6.修改模型
6.1 查看数据集
table(cs.train$SeriousDlqin2yrs)
prop.table(table(cs.train$SeriousDlqin2yrs))

结论:只有6%左右的用户违约,说明数据集并不平衡
6.2 平衡结果
cs.train$SeriousDlqin2yrs <- as.factor(cs.train$SeriousDlqin2yrs)
# 采用bootstrasp自助抽样法,目的:减小0的个数,增加1的个数,再平衡模型
trainSplit <- SMOTE(SeriousDlqin2yrs~.,cs.train,perc.over = 30,perc.under = 550)
cs.train$SeriousDlqin2yrs <- as.numeric(cs.train$SeriousDlqin2yrs)
prop.table(table(trainSplit$SeriousDlqin2yrs))

结论:数据集的分布达到了基本平衡
6.3 重新建模
model_full =  glm(SeriousDlqin2yrs~.,data=trainSplit,family=binomial,maxit=1000)

step = step(model_full,direction = "both")
summary(step)
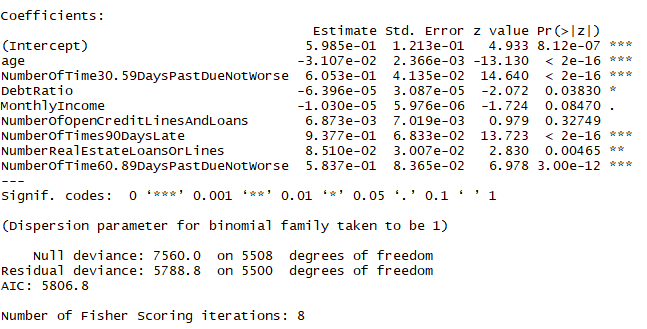
结论:找到了8个对结果有影响的变量,不同于开始建模的变量选择
6.4 预测模型
pred = predict(step,cs.test,type="response")


fitted.r=ifelse(pred>0.5,1,0)
accuracy = table(fitted.r,cs.test$SeriousDlqin2yrs)

misClasificError = mean(fitted.r!=cs.test$SeriousDlqin2yrs)

roc = roc(cs.test$SeriousDlqin2yrs,pred)
plot(roc)
roc
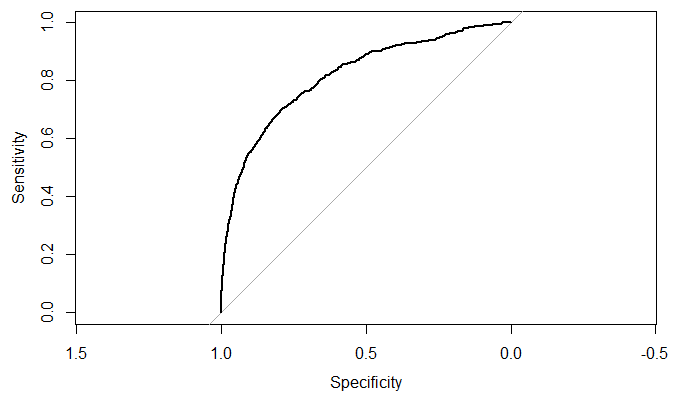

结论:模型预测的精度从69%提升到了81.6%
数据集:https://github.com/Mounment/R-Project