Java 8
Spring Boot 2.5.2
Postman
actuator 翻译:执行器
Spring Boot Actuator 是一种 生产级别 的功能,提供了 JMX、Web 两种方式 来 1)监控应用数据、2)和应用交互。
除了内置的 端点(Endpoint),还可以 自建端点。
端点可用 的两个条件都需要满足:1)启用的(enabled)2)暴露的(exposed),默认内建端点(除了shutdown)都启用了,但对JMX全部暴露,而Web方式只暴露了health(本文没有发现 info暴露出来)。
依赖包:
<dependencies>
  <dependency>
  <groupId>org.springframework.boot</groupId>
  <artifactId>spring-boot-starter-actuator</artifactId>
  </dependency>
</dependencies>
注:JMX(Java Management Extensions)是一个为应用程序植入管理功能的框架。可以通过Java的 jconsole 访问JMX中的数据。

引入依赖包后,启动应用,此时,可以通过JMX访问所有 端点(endpoint) 的数据(如上图),而通过Web则 默认只能访问 health(其它文档说 还可以访问 info端点,但没找到)。
访问 /actuator,得到下面的:
{
    "_links": {
        "self": {
            "href": "http://localhost:9090/actuator",
            "templated": false
        },
        "health": {
            "href": "http://localhost:9090/actuator/health",
            "templated": false
        },
        "health-path": {
            "href": "http://localhost:9090/actuator/health/{*path}",
            "templated": true
        }
    }
}
其中只有 3种 url可以访问。
访问/actuator/health,得到下面的:
{
    "status": "UP"
}
疑问:
/actuator/health/{*path} 是干啥的?
内置端点列表:
auditevents
beans
caches
conditions
configprops
env
flyway
health
httptrace
info
integrationgraph
loggers
liquibase
metrics
mappings
scheduledtasks
sessions
shutdown
startup
threaddump
下面四个端点是 Web应用(Spring MVC, Spring WebFlux, or Jersey)独有的:
heapdump
jolokia
logfile
prometheus
端点默认是 启用的,配置时,从 启用 配置为 禁用。
也可以添加下面的配置,使得端点 默认禁用,配置部分启用:
management.endpoints.enabled-by-default=false
management.endpoint.info.enabled=true
通过 下面的配置 来配置内置端点暴露:
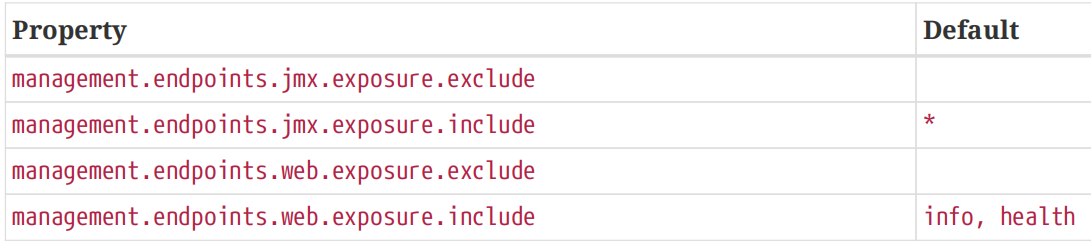
其中,management.endpoints.web.exposure.include 默认是暴露了 info,但我这边没有,配置了试试。
添加配置:
management.endpoints.web.exposure.include=info,health
配置后访问 /actuator,此时出现了 /actuator/info:
        "health-path": {
            "href": "http://localhost:9090/actuator/health/{*path}",
            "templated": true
        },
        "info": {
            "href": "http://localhost:9090/actuator/info",
            "templated": false
        }
    }
}
访问 /actuator/info 得到:
{}
疑问:
没有数据,怎么回事?
配置 通过Web暴露更多端点:
management.endpoints.web.exposure.include=info,health,beans,caches,conditions,env,configprops,
					loggers,metrics,mappings,sessions,threaddump,heapdump,prometheus
注意,第一行末尾的 反斜杠() 后面不能有任何字符;第二行loggers 前面不能 没有字符。
访问 /actuator:
{
    "_links": {
        "self": {
            "href": "http://localhost:9090/actuator",
            "templated": false
        },
        "beans": {
            "href": "http://localhost:9090/actuator/beans",
            "templated": false
        },
        "caches-cache": {
            "href": "http://localhost:9090/actuator/caches/{cache}",
            "templated": true
        },
        "caches": {
            "href": "http://localhost:9090/actuator/caches",
            "templated": false
        },
        "health": {
            "href": "http://localhost:9090/actuator/health",
            "templated": false
        },
        "health-path": {
            "href": "http://localhost:9090/actuator/health/{*path}",
            "templated": true
        },
        "info": {
            "href": "http://localhost:9090/actuator/info",
            "templated": false
        },
        "conditions": {
            "href": "http://localhost:9090/actuator/conditions",
            "templated": false
        },
        "configprops": {
            "href": "http://localhost:9090/actuator/configprops",
            "templated": false
        },
        "configprops-prefix": {
            "href": "http://localhost:9090/actuator/configprops/{prefix}",
            "templated": true
        },
        "env": {
            "href": "http://localhost:9090/actuator/env",
            "templated": false
        },
        "env-toMatch": {
            "href": "http://localhost:9090/actuator/env/{toMatch}",
            "templated": true
        },
        "loggers": {
            "href": "http://localhost:9090/actuator/loggers",
            "templated": false
        },
        "loggers-name": {
            "href": "http://localhost:9090/actuator/loggers/{name}",
            "templated": true
        },
        "heapdump": {
            "href": "http://localhost:9090/actuator/heapdump",
            "templated": false
        },
        "threaddump": {
            "href": "http://localhost:9090/actuator/threaddump",
            "templated": false
        },
        "metrics-requiredMetricName": {
            "href": "http://localhost:9090/actuator/metrics/{requiredMetricName}",
            "templated": true
        },
        "metrics": {
            "href": "http://localhost:9090/actuator/metrics",
            "templated": false
        },
        "mappings": {
            "href": "http://localhost:9090/actuator/mappings",
            "templated": false
        }
    }
}
测试其中部分端点:
- /actuator/metrics
{
    "names": [
        "jvm.buffer.count",
        "jvm.buffer.memory.used",
        "jvm.buffer.total.capacity",
        "jvm.classes.loaded",
        "jvm.classes.unloaded",
        "jvm.gc.live.data.size",
        "jvm.gc.max.data.size",
        "jvm.gc.memory.allocated",
        "jvm.gc.memory.promoted",
        "jvm.gc.pause",
        "jvm.memory.committed",
        "jvm.memory.max",
        "jvm.memory.used",
        "jvm.threads.daemon",
        "jvm.threads.live",
        "jvm.threads.peak",
        "jvm.threads.states",
        "logback.events",
        "process.cpu.usage",
        "process.start.time",
        "process.uptime",
        "system.cpu.count",
        "system.cpu.usage",
        "tomcat.sessions.active.current",
        "tomcat.sessions.active.max",
        "tomcat.sessions.alive.max",
        "tomcat.sessions.created",
        "tomcat.sessions.expired",
        "tomcat.sessions.rejected"
    ]
}
查看其中的 system.cpu.count : /actuator/metrics/system.cpu.count
{
    "name": "system.cpu.count",
    "description": "The number of processors available to the Java virtual machine",
    "baseUnit": null,
    "measurements": [
        {
            "statistic": "VALUE",
            "value": 8.0
        }
    ],
    "availableTags": []
}
其它的类似。
注意,有些端点的数据量很大,比如,env、beans——返回结果多达几十上百KB。
接口 /actuator/heapdump 是 文件下载,几十MB。postman看不了内容,使用:

分析方法请看 参考文档。
注意,配置了 prometheus ,但没有这个端点。原因是 项目 没有依赖 micrometer-registry-prometheus 包。
添加下面的依赖就有了——和本文的 spring boot搭配的默认版本 1.7.1:
<!-- https://mvnrepository.com/artifact/io.micrometer/micrometer-registry-prometheus -->
<dependency>
    <groupId>io.micrometer</groupId>
    <artifactId>micrometer-registry-prometheus</artifactId>
</dependency>
重启项目后访问:
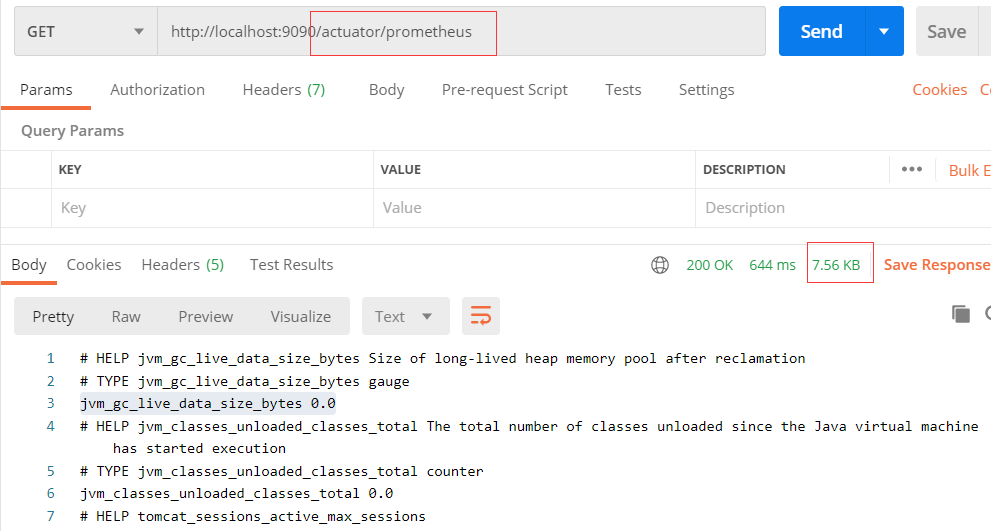
注,prometheus 是由 SoundCloud 开源监控告警解决方案。
更多端点,请根据需要做配置。
actuator的Web访问端口
Spring boot的默认端口是8080,而Spring boot actuator的默认端口和S.B.是相同的——8080,而本文前面的 actuator的端点的端口是 9090。
这是通过配置实现的:
management.server.port=9090
配置为 9090后,启动日志显示启动了两个Tomcat容器:
o.s.b.w.embedded.tomcat.TomcatWebServer  : Tomcat initialized with port(s): 8080 (http)
o.apache.catalina.core.StandardService   : Starting service [Tomcat]
org.apache.catalina.core.StandardEngine  : Starting Servlet engine: [Apache Tomcat/9.0.48]
o.a.c.c.C.[Tomcat].[localhost].[/]       : Initializing Spring embedded WebApplicationContext
w.s.c.ServletWebServerApplicationContext : Root WebApplicationContext: initialization completed in 964 ms
o.s.b.w.embedded.tomcat.TomcatWebServer  : Tomcat started on port(s): 8080 (http) with context path ''

o.s.b.w.embedded.tomcat.TomcatWebServer  : Tomcat initialized with port(s): 9090 (http)
...
o.s.b.a.e.web.EndpointLinksResolver      : Exposing 13 endpoint(s) beneath base path '/actuator'
o.s.b.w.embedded.tomcat.TomcatWebServer  : Tomcat started on port(s): 9090 (http) with context path ''
禁止其它主机访问
默认情况下,actuator的端点 可以在其它主机访问,添加下面的配置后,即只允许本机访问:来自 博客园
management.server.address=127.0.0.1
日志级别:查看、动态设置
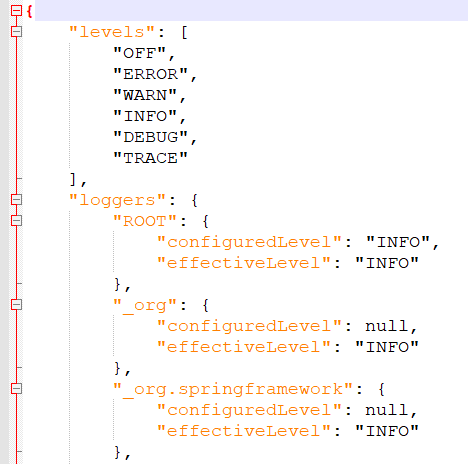
访问 /actuator/loggers:
测试代码:
1     @GetMapping(path="sayHello")
2     @ResponseBody
3     public Greeting sayHello(@RequestParam(name="name", required=false, defaultValue="Stranger") String name) {
4         log.info("info访问sayHello:" + new Date());
5         log.warn("warn访问sayHello:" + new Date());
6         log.error("error访问sayHello:" + new Date());
7         return new Greeting(counter.incrementAndGet(), String.format(template, name));
8     }
日志默认级别:来自 博客园
        "com.example.actuator.controller.HelloController": {
            "configuredLevel": null,
            "effectiveLevel": "INFO"
        },
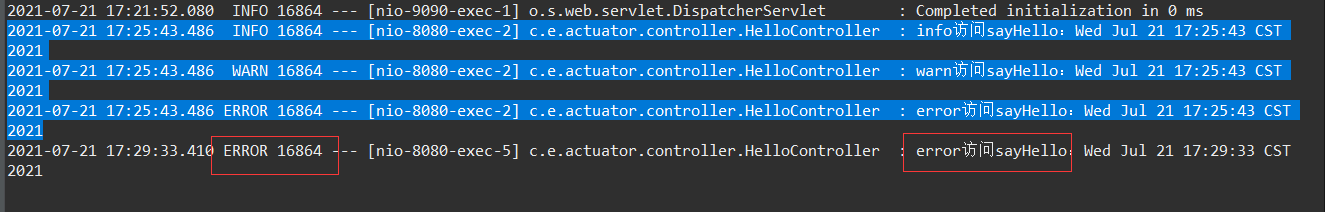
默认情况下测试 接口的日志输出:
2021-07-21 17:25:43.486  INFO 16864 --- [nio-8080-exec-2] c.e.actuator.controller.HelloController  : info访问sayHello:Wed Jul 21 17:25:43 CST 2021
2021-07-21 17:25:43.486  WARN 16864 --- [nio-8080-exec-2] c.e.actuator.controller.HelloController  : warn访问sayHello:Wed Jul 21 17:25:43 CST 2021
2021-07-21 17:25:43.486 ERROR 16864 --- [nio-8080-exec-2] c.e.actuator.controller.HelloController  : error访问sayHello:Wed Jul 21 17:25:43 CST 2021
GET请求查看 日志级别:
/actuator/loggers/com.example.actuator.controller.HelloController
{
    "configuredLevel": null,
    "effectiveLevel": "INFO"
}
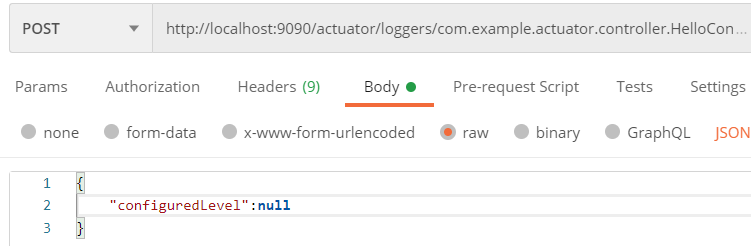
POST请求 修改 日志级别为 error:
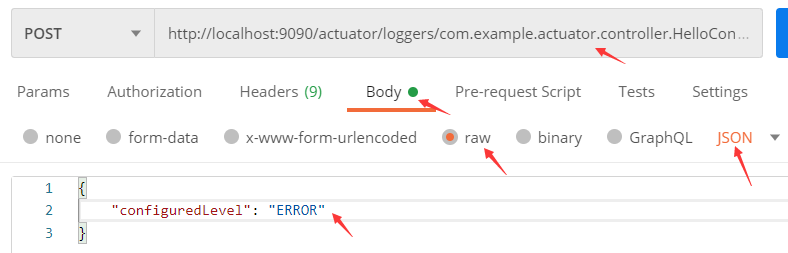
修改后查看结果:
{
    "configuredLevel": "ERROR",
    "effectiveLevel": "ERROR"
}
测试接口访问:只输出了一条 ERROR 日志了
将默认为 INFO 改为 DEBUG,可以输出更多信息——系统响应也会慢一些,调试用;
将INFO 提高到 WARN,可以少打印一些 INFO级别的日志;
设置后,怎么还原设置呢?如下参数执行POST请求:来自 博客园
修改url前缀路径
默认是以 /actuator开头,可以配置在其前面添加一个 开头:
management.server.servlet.context-path=/abc
启动日志会多一句:
o.s.b.a.e.web.EndpointLinksResolver      : Exposing 13 endpoint(s) beneath base path '/actuator'
o.s.b.w.embedded.tomcat.TomcatWebServer  : Tomcat started on port(s): 9090 (http) with context path '/abc'
配置后访问 /abc/actuator:

注意,S.B.官方文档说是 management.endpoints.web.base-path 属性,但配置了没有用。
配置地址映射:将 health 改为 healthcheck
management.endpoints.web.path-mapping.health=healthcheck
得到新url:来自 博客园
        "health": {
            "href": "http://localhost:9090/abc/actuator/healthcheck",
            "templated": false
        },
        "health-path": {
            "href": "http://localhost:9090/abc/actuator/healthcheck/{*path}",
            "templated": true
        },
测试效果同 之前的 health。
shutdown端点试玩
使能 & 暴露:
management.endpoint.shutdown.enabled=true
management.endpoints.web.exposure.include=info,health,beans,caches,conditions,env,configprops,
					loggers,metrics,mappings,sessions,threaddump,heapdump,prometheus,shutdown
启动后可见:
        "shutdown": {
            "href": "http://localhost:9090/abc/actuator/shutdown",
            "templated": false
        },
执行shutdown——POST请求:
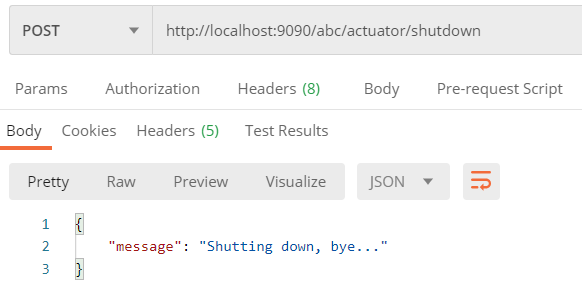
执行后,服务已停止了,连actuator的端口也访问不了了——整个S.B.应用被关闭了。
疑问:
都被关闭了,怎么执行 startup 端点呢?来自 博客园
info端点
前面打开info端点,但是,没有信息。
添加:在application.properties中添加
info.app.encoding=UTF-8
info.app.location=lib
访问 info端点,得到:
{
    "app": {
        "encoding": "UTF-8",
        "location": "lib"
    }
}
除了上面的 hardcode的方式,还可在 (2)编译时(build)获取一些信息、还可以 (3)实现 InfoContributor 接口 提供动态信息 S.B.官方文档。来自 博客园
更多信息需要看 官方文档:actuator还有更多好玩的功能,比如,单独配置HTTPS访问、自定义端点、Kubernetes探查……
参考资料:
1、spring boot官方文档 之 Spring Boot Actuator: Production-ready Features
5、