运行环境:
PHPSTORM版本 : 8.0.1
PHP版本 : 5.6.2
xdebug版本:php_xdebug-2.2.5-5.6-vc11-x86_64.dll
ps : php版本和xdebug版本一定要相对应
1. PHP安装xdebug扩展
php.ini的配置,下面的配置仅供参考,路径要换成自己的!
- [xdebug]
- zend_extension="D:wampphp-5.6.2-x64extphp_xdebug-2.2.5-5.6-vc11-x86_64.dll"
- xdebug.remote_enable = On
- xdebug.remote_handler = dbgp
- xdebug.remote_host= localhost
- xdebug.remote_port = 9000
- xdebug.idekey = PHPSTORM
[xdebug]
zend_extension="D:wampphp-5.6.2-x64extphp_xdebug-2.2.5-5.6-vc11-x86_64.dll"
xdebug.remote_enable = On
xdebug.remote_handler = dbgp
xdebug.remote_host= localhost
xdebug.remote_port = 9000
xdebug.idekey = PHPSTORM
ps : remote_handler 、remote_host、remote_port 这些都有默认值,但还是建议设置下,至少知道要设置这些参数~
查看phpinfo~

【或者使用PHPstudy:其他选项菜单/PHP扩展设置/PHP扩展/XDEBUG打上对钩】
2.PHPSTORM设置
楼主以前一直用zendstudio,刚开始用phpstorm非常蛋疼,用了一段时间后发现还挺好用的~
1.首先检查phpstorm的xdebug配置
这里的debug port要和php.ini里面的xdebug.remote_port相一致!默认是9000,如果9000端口被占用的话,可以改成其他端口。


phpstorm配置
- 客户端调试,打开phpStorm,进入File>Settings>PHP>Servers,这里要填写服务器端的相关信息,name填localhost,host填localhost,port填80,debugger选XDebug
- 进入File>Settings>PHP>Debug,看到XDebug选项卡,port填9000,其他默认
- 进入File>Settings>PHP>Debug>DBGp Proxy,IDE key 填 phpStorm,host 填localhost,port 填80
- 点OK退出设置。

从这一步开始有两种方式
第一种:
2. 设置debug.(也可以使用监听模式)


添加本地的 web server~
www.mall.com是我本地的服务


3.开始调试
-
打好第一个断点,shift + F9就可以了
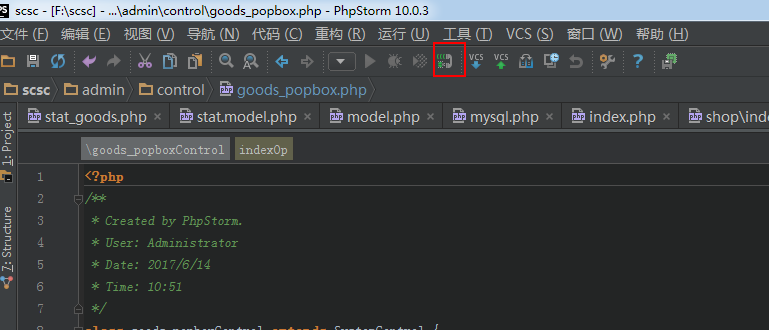
-
打好第一个断点,选中配置的debug, 按旁边的臭虫 按钮

第二种:
2.使用google浏览器,安装一个插件:xdebug helper
2.1右键选择
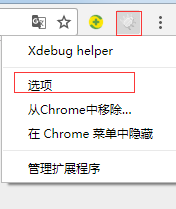
选择
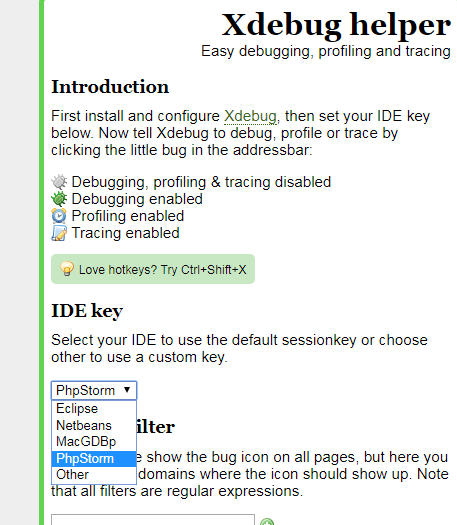
点击
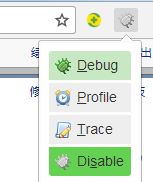
点亮甲虫,打上断点,刷新页面即可
或者还是看不懂,好吧,那请看下面链接:
常见问题:
- Debug session was finished without being paused
- It may be caused by path mappings misconfiguration or not synchronized local and remote projects.
- To figure out the problem check path mappings configuration for 'www.test.com' server at PHP|Servers or enable Break at first line in PHP scripts option (from Run menu).
Debug session was finished without being paused
It may be caused by path mappings misconfiguration or not synchronized local and remote projects.
 To figure out the problem check path mappings configuration for 'www.test.com' server at PHP|Servers or enable Break at first line in PHP scripts option (from Run menu).
没有打断点或者调试没有被监测到,碰到这个问题,看看路径配置对了吗是否能访问到
本文地址:http://blog.csdn.NET/ty_hf/article/details/50768702