平时经常做一些性能测试,比如查看mysql的响应时间,绘制一些曲线,可以帮我们更清楚直观的发现问题,当然也可以使用监控来实现,更简单一些。
1、安装gnuplot
yum -y install gnuplot
rpm -ivh chkfontpath-1.10.1-2.el6.nux.x86_64.rpm --nodeps --force
rpm -ivh msttcore-fonts-2.0-3.noarch.rpm
vim /etc/profile
export GDFONTPATH=“/usr/share/fonts/msttcore/”
export GNUPLOT_DEFAULT_GDFONT=“arial”
2、设置模板
模板信息如下,比如这个模板文件叫做muban.conf
set terminal gif small size 900,780 #指定输出成gif图片,且图片大小为550×25
set output “RT.gif” #指定输出gif图片的文件名
set autoscale
set xdata time
set timefmt “%s”
set format x “%S”
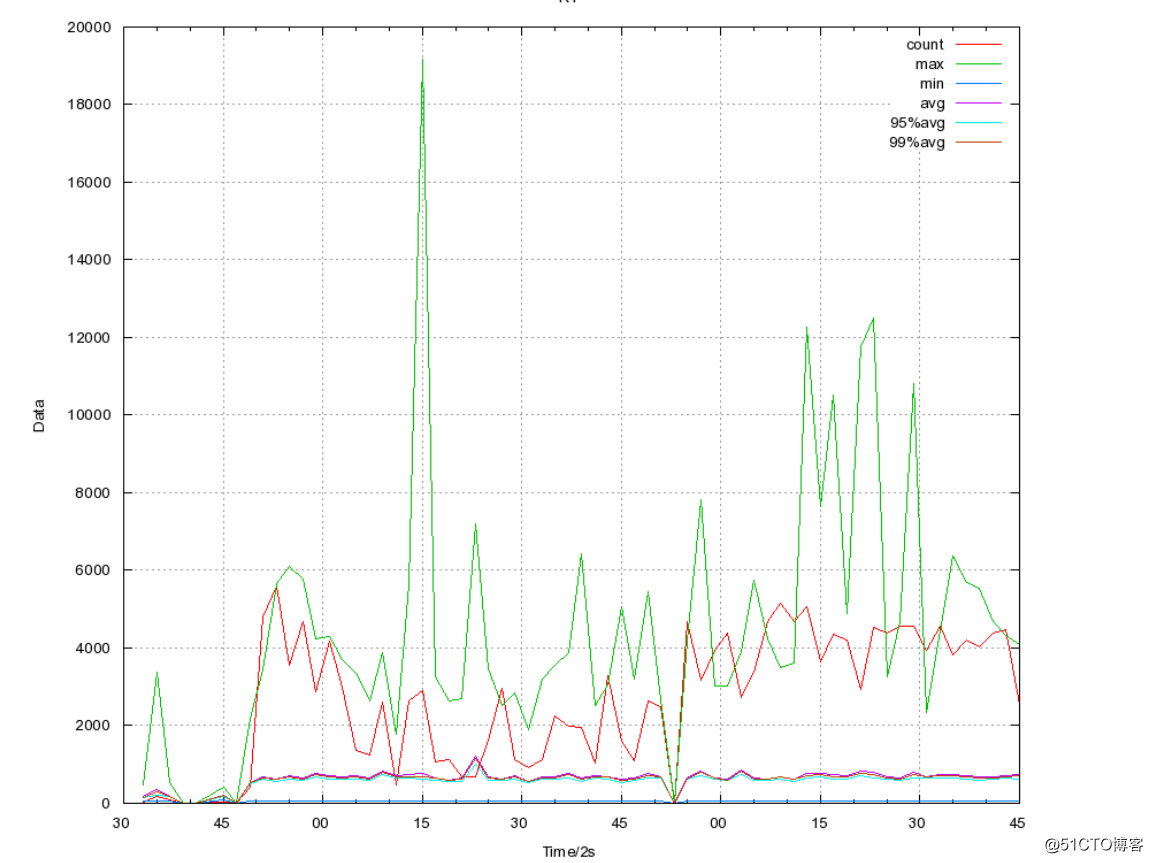
set title “RT” #图片标题
set style data lines #显示网格
set xlabel “Time/2s” #X轴标题
set ylabel “Data” #Y轴标题
set grid #显示网格
plot
“mysql_rt.txt” using 1:2 title “count” ,‘’ using 1:3 title “max” ,‘’ using 1:4 title “min” ,‘’ using 1:5 title “avg” ,‘’ using 1:9 title “95%avg” ,‘’ using 1:12 title “99%avg”
上面mysql_rt.txt是我们的数据文件,文件内容如下,一列一列的,这些数据是使用tcprstat采集的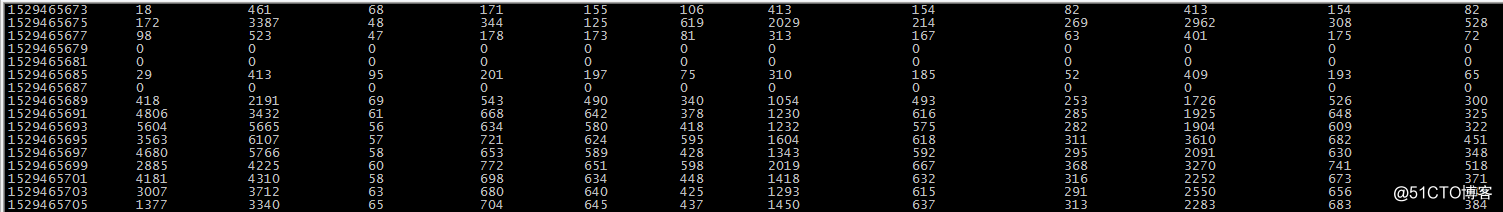
using 1:2就是第一列是x轴和第二列是y轴的数据,我同一时间有很多指标,所以1是固定的,2、3、5、9等代表各指标在1这个时间点的数据。
3、绘制图形
命令行输入:
cat muban.conf |gnuplot
生成了模板里指定的图形文件
打开RT.gif查看