<!DOCTYPE html>
<html lang="en">
<head>
    <meta charset="UTF-8">
    <title>Title</title>
    <style>
        canvas {
            border: 1px solid #ccc;
        }
    </style>
</head>
<body>
<canvas width="600" height="400"></canvas>
<script>
    var myCanvas = document.querySelector('canvas');
    var ctx = myCanvas.getContext('2d');
    /*1.根据37期的年龄分布绘制饼图*/
    /*2.准备统计的数据*/
    /*15-20岁 6个*/
    /*20-25岁 30个*/
    /*25-30岁 10个*/
    /*30-35岁 8个*/
    var data = [6, 30, 10, 8];
    /*3.在饼图表示出来*/
    /*4.需要把数据转出弧度*/
    var angleList = [];
    var total = 0;
    data.forEach(function (item, i) {
        total += item;
    });
    console.log(total);
    /*第二是转换成弧度的时候就可以去绘制扇形 减少一次遍历*/
    data.forEach(function (item, i) {
        var angle = Math.PI * 2 * (item/total);
        angleList.push(angle);
    });
    console.log(angleList);
    /*5.根据弧度绘制扇形*/
    var w = ctx.canvas.width;
    var h = ctx.canvas.height;
    var x0 = w/2;
    var y0 = h/2;
    /*获取随机颜色*/
    var getRandomColor = function () {
        var r = Math.floor(Math.random() * 256);
        var g = Math.floor(Math.random() * 256);
        var b = Math.floor(Math.random() * 256);
        return 'rgb(' + r + ',' + g + ',' + b + ')';
    }
    var startAngle = 0;
    angleList.forEach(function (item,i) {
        /*上一次绘制的结束弧度等于当前次的起始弧度*/
        var endAngle = startAngle + item;
        ctx.beginPath();
        ctx.moveTo(x0,y0);
        ctx.arc(x0,y0,150,startAngle,endAngle);
        ctx.fillStyle = getRandomColor();
        ctx.fill();
        /*记录当前的结束位置作为下一次的起始位置*/
        startAngle = endAngle;
    });
</script>
</body>
</html>
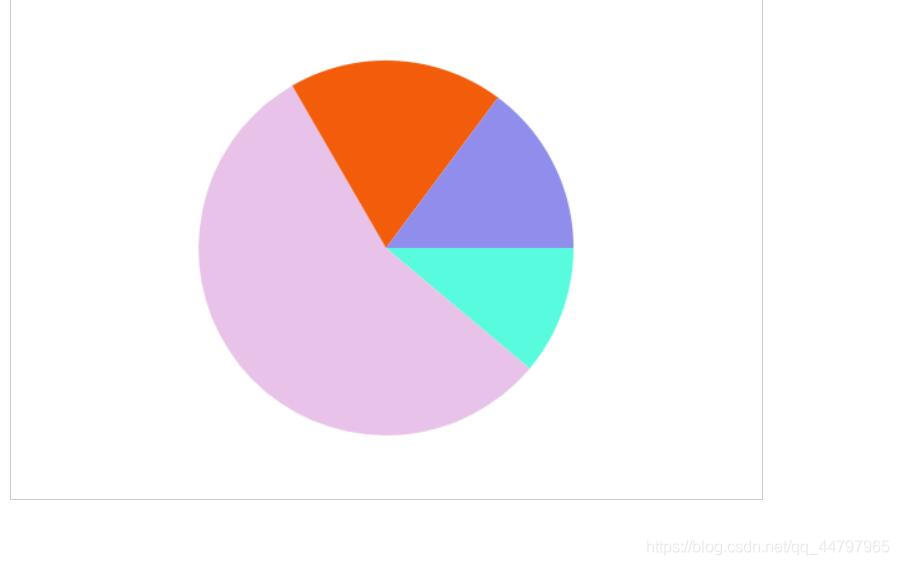
运行结果如下:
