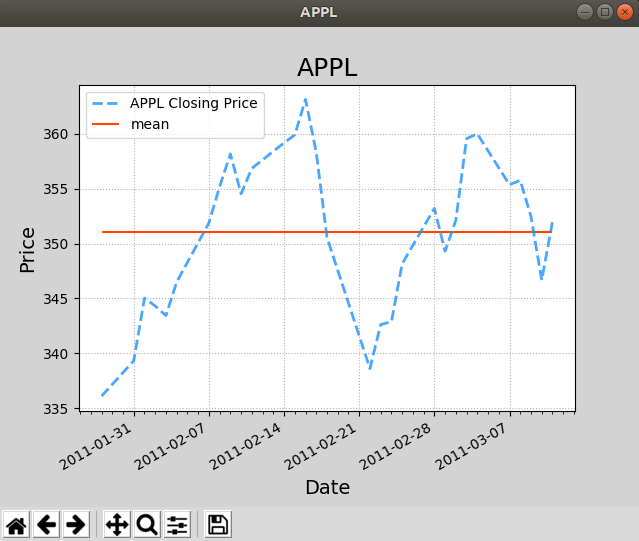
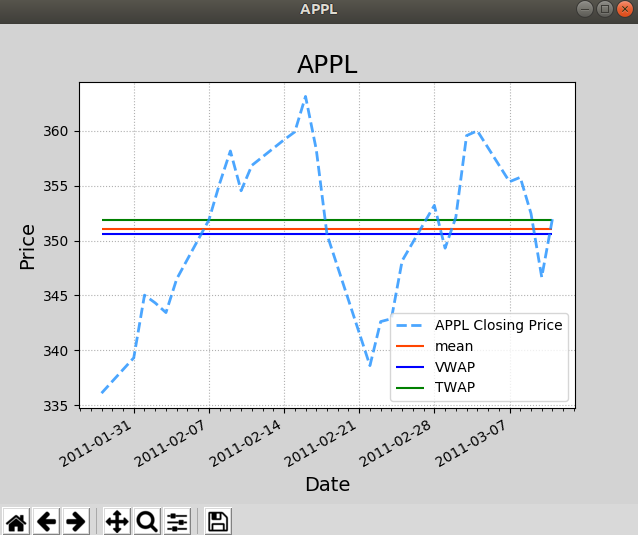
算数平均值:
m = (s1 + s2 + ... + sn) / n
算数平均值表示对真值的无偏估计。
np.mean(array)
array.mean()
案例:计算收盘价的算术平均值。
#算数平均值
import numpy as np
import matplotlib.pyplot as mp
import datetime as dt
import matplotlib.dates as md


def dmy2ymd(dmy):
  """
  把日月年转年月日
  :param day:
  :return:
  """
  dmy = str(dmy, encoding='utf-8')
  t = dt.datetime.strptime(dmy, '%d-%m-%Y')
  s = t.date().strftime('%Y-%m-%d')
  return s


dates, opening_prices,
highest_prices, lowest_prices,
closing_prices =
  np.loadtxt('aapl.csv',
             delimiter=',',
             usecols=(1, 3, 4, 5, 6),
             unpack=True,
             dtype='M8[D],f8,f8,f8,f8',
             converters={1: dmy2ymd})  # 日月年转年月日

# 绘制收盘价的折现图
mp.figure('APPL', facecolor='lightgray')
mp.title('APPL', fontsize=18)
mp.xlabel('Date', fontsize=14)
mp.ylabel('Price', fontsize=14)
mp.grid(linestyle=":")

# 设置刻度定位器
# 每周一一个主刻度,一天一个次刻度

ax = mp.gca()
ma_loc = md.WeekdayLocator(byweekday=md.MO)
ax.xaxis.set_major_locator(ma_loc)
ax.xaxis.set_major_formatter(md.DateFormatter('%Y-%m-%d'))
ax.xaxis.set_minor_locator(md.DayLocator())
# 修改dates的dtype为md.datetime.datetiem
dates = dates.astype(md.datetime.datetime)
mp.plot(dates, closing_prices,
        color='dodgerblue',
        linewidth=2,
        linestyle='--',
        alpha=0.8,
        label='APPL Closing Price')
#计算收盘价的均值
mean = np.mean(closing_prices)
# mean = closing_prices.mean()
print(mean)
mp.hlines(mean,dates[0],dates[-1],colors='orangered',label='mean')
mp.legend()
mp.gcf().autofmt_xdate()
mp.show()

加权平均值
样本:S = [s1, s2, ..., sn]
加权平均值:a = (s1w1+s2w2+...+snwn)/(w1+w2+...+wn)
np.average(closing_prices, weights=volumes)
VWAP - 成交量加权平均价格(成交量体现了市场对当前交易价格的认可度,成交量加权平均价格将会更接近这支股票的真实价值)
import numpy as np
closing_prices, volumes = np.loadtxt(
    '../../data/aapl.csv', delimiter=',',
    usecols=(6, 7), unpack=True)
vwap, wsum = 0, 0
for closing_price, volume in zip(
        closing_prices, volumes):
    vwap += closing_price * volume
    wsum += volume
vwap /= wsum
print(vwap)
vwap = np.average(closing_prices, weights=volumes)
print(vwap)
TWAP - 时间加权平均价格(时间越晚权重越高,参考意义越大)
import datetime as dt
import numpy as np

def dmy2days(dmy):
    dmy = str(dmy, encoding='utf-8')
    date = dt.datetime.strptime(dmy, '%d-%m-%Y').date()
    days = (date - dt.date.min).days
    return days

days, closing_prices = np.loadtxt(
    '../../data/aapl.csv', delimiter=',',
    usecols=(1, 6), unpack=True,
    converters={1: dmy2days})
twap = np.average(closing_prices, weights=days)
print(twap)
# 加权平均值
import numpy as np
import matplotlib.pyplot as mp
import datetime as dt
import matplotlib.dates as md


def dmy2ymd(dmy):
  """
  把日月年转年月日
  :param day:
  :return:
  """
  dmy = str(dmy, encoding='utf-8')
  t = dt.datetime.strptime(dmy, '%d-%m-%Y')
  s = t.date().strftime('%Y-%m-%d')
  return s


dates, opening_prices,
highest_prices, lowest_prices,
closing_prices ,volumes=
  np.loadtxt('aapl.csv',
             delimiter=',',
             usecols=(1, 3, 4, 5, 6,7),
             unpack=True,
             dtype='M8[D],f8,f8,f8,f8,f8',
             converters={1: dmy2ymd})  # 日月年转年月日
print(dates)
# 绘制收盘价的折现图
mp.figure('APPL', facecolor='lightgray')
mp.title('APPL', fontsize=18)
mp.xlabel('Date', fontsize=14)
mp.ylabel('Price', fontsize=14)
mp.grid(linestyle=":")

# 设置刻度定位器
# 每周一一个主刻度,一天一个次刻度

ax = mp.gca()
ma_loc = md.WeekdayLocator(byweekday=md.MO)
ax.xaxis.set_major_locator(ma_loc)
ax.xaxis.set_major_formatter(md.DateFormatter('%Y-%m-%d'))
ax.xaxis.set_minor_locator(md.DayLocator())
# 修改dates的dtype为md.datetime.datetiem
dates = dates.astype(md.datetime.datetime)
mp.plot(dates, closing_prices,
                  color='dodgerblue',
                  linewidth=2,
                  linestyle='--',
                  alpha=0.8,
                  label='APPL Closing Price')
# 计算收盘价的均值
mean = np.mean(closing_prices)
# mean = closing_prices.mean()
mp.hlines(mean, dates[0], dates[-1], colors='orangered',
          label='mean')
# VWP成交量加权平均值
vwap = np.average(closing_prices, weights=volumes)
mp.hlines(vwap, dates[0], dates[-1], color='blue', label='VWAP')
#TWAP事件加权平均价格
w = np.linspace(1,4,30)
twap = np.average(closing_prices,weights=w)
mp.hlines(twap,dates[0],dates[-1],color='green',label='TWAP')
mp.legend()
mp.gcf().autofmt_xdate()
mp.show()
