Introduction
PerformancePoint Services is a SharePoint Server 2013 service application. It enables users to create business intelligence (BI) dashboards that provide insight into an organization's performance. You can create custom reports, filters, tabular data sources, and scorecard transforms to extend the native functionality of PerformancePoint Services.
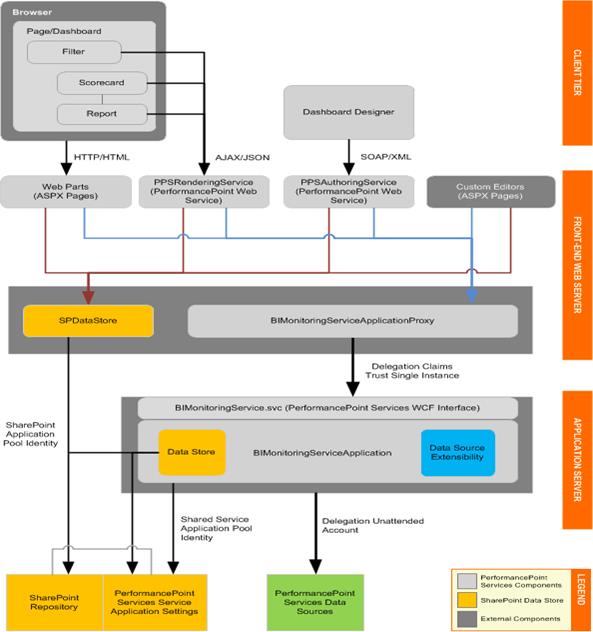
Extensibility architecture for PerformancePoint Services in SharePoint Server 2013:
Fundamentals of PerformancePoint Services Development
PerformancePoint Services architecture: Its multitier architecture includes components on the client tier, the front-end web server, and the back-end application server. The following diagram shows a generalized view of the PerformancePoint Services architecture.
PerformancePoint Dashboard Designer
Dashboard Designer provides a rich authoring environment for creating and managing dashboard content. Dashboard Designer installs on a client computer by using ClickOnce, a Web-based deployment technology. Dashboard Designer communicates with the PPSAuthoringService Web service by sending SOAP requests and receiving XML responses. Users can also perform simple design tasks in edit mode in SharePoint Server 2013, such as adding Web Parts to a dashboard.
Editors for Custom PerformancePoint Services Objects
An editor runs within a PerformancePoint Services application instance on the front-end Web server, typically as an ASPX page. Web applications that run within a PerformancePoint Services application instance and in a SharePoint process are located in the /_layouts virtual directory and are installed by default to the LAYOUTS folder in the path %ProgramFiles%Common FilesMicrosoft Sharedweb server extensions15TEMPLATE.
Integrating with Dashboard Designer
To integrate into the Dashboard Designer authoring experience, your editor must be able to open from a uniform resource identifier (URI), and the URI must be registered for the custom object in the PerformancePoint Servicesweb.config file.
To create a custom object, Dashboard Designer retrieves the object's metadata from the PerformancePoint Services web.config file and then creates the object as a content type in the PerformancePoint Services repository. Data sources are created in a SharePoint document library, and report and filter objects are created in a SharePoint list. After creating the custom object, Dashboard Designer displays a link to the editor.
PerformancePoint Services uses the following process to open a custom editor:
When a user attempts to edit a custom object from Dashboard Designer (or a content type in the repository), a query string is passed to a Web server control. The query string provides the location of the object in the repository.
The Web server control interrogates the object to identify its type and subtype. The object's subtype indicates whether the object is native or custom.
If the object is custom, the Web server control looks up the URI of the object's editor in the PerformancePoint Services web.config file.
The Web server control appends query string parameters to the editor path and then opens the editor.
PerformancePoint Services Filters
In PerformancePoint Services in Microsoft SharePoint Server 2010, a filter typically appears on a dashboard page as a Web server control. The filter control is rendered in a Web Part that implements standard SharePoint connection interfaces. The control enables users to select parameter values, which are then sent to connected scorecards and reports.
Filtering Process in PerformancePoint Services
The filtering process in a dashboard occurs as follows:
The server renders a filter Web Part on a dashboard page. The Web Part hosts a Web server control, such as a list or tree.
The filter's data provider connects to the underlying data source. It retrieves data and stores it in a data table (referred to as the display-data table).
The retrieved data is used to populate the filter control.
A user selects one or more values from the filter control, and then clicks OK.
The data provider stores the user's selections in a data table (referred to as the message-data table).
The filter control sends the message data (user-selected values) to the server.
The server retrieves the results of the new query from the data source and then sends the updated data to scorecard and report consumers.
The server renders the consumers with the new data.
Filter Data
A filter uses a data provider to handle two datasets:
Display data that is used to define connection points and to populate the filter control.
Message data that the filter passes to consumers to represent the user's selection from the filter control.
Filter Connections
Filters are providers; they send data to connected scorecard and report consumers. Dashboard authors define a connection between a filter and a consumer by mapping a filter begins point to a consumer endpoint in PerformancePoint Dashboard Designer. An endpoint represents a parameter in a scorecard or report query, and a begin point represents the value of the parameter. For example, a filter displays the geographic regions North, South, East, and West, and a report returns the gross revenue for the region that is selected in the filter. In this example, region is the parameter in the report's query—its value is not specifically defined. The report must obtain the parameter value to use in the query (North, South, East, or West) from the filter.
Filter Selection Controls
In a PerformancePoint Services dashboard page, a filter Web Part hosts a Web server control. The filter control typically displays enumerated data values and enables dashboard users to select one or more values. The control is populated with data during the rendering process.
The control that a filter uses is identified by its renderer class. The default control for a filter type is specified by theRenderer Class attribute in the PerformancePoint Services web.config file. However, the RendererClassNameproperty overrides the default control for a filter instance, so authors can specify a different run-time renderer in the filter editor.
Custom filters can use a custom or third-party control or one of the following PerformancePoint Services controls:
SingleSelectDropDownControlSingleSelectTreeViewControlMultiSelectTreeViewControl
PerformancePoint Services Scorecards
In PerformancePoint Services in Microsoft SharePoint Server 2013, scorecards are first class objects (FCOs) that are stored as content types in the PerformancePoint Services repository. They are rendered in Web Parts as grid-based views that display key performance indicators (KPIs) and dimension data.
How to create a simple Analytics Reports using PerformancePoint Services
Create a new site and use the site template as “Business Intelligence Center”.

Click on the Site Contents.
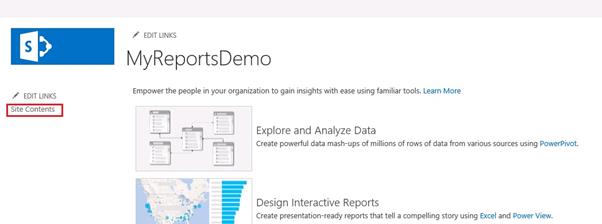
Then go to “PerformancePoint Content”.
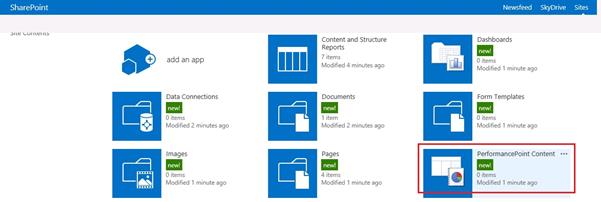
Click on the new item.
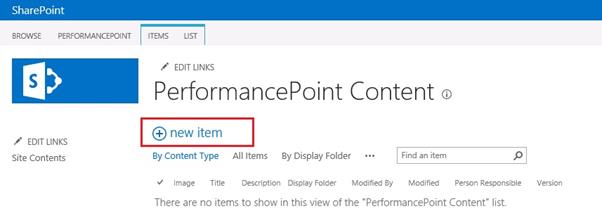
Now the Dashboard Designer will open.
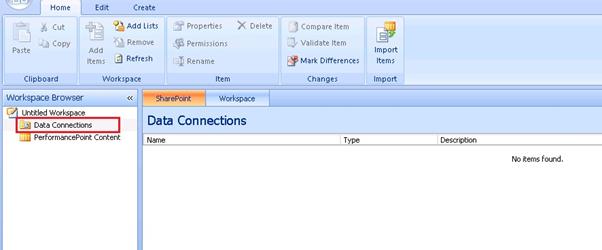
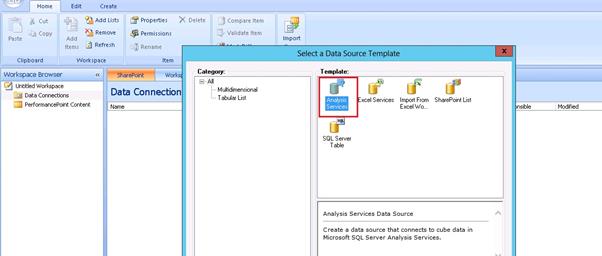
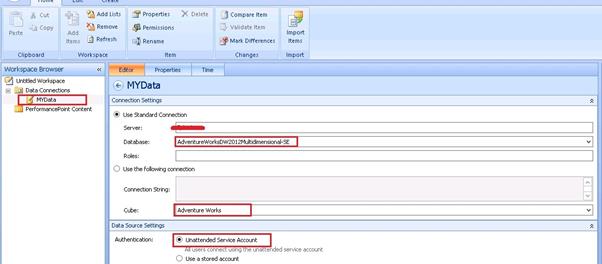
Here, we need to create a new Data Connection, for this right click on the data connection and click on the New Data Source.

Here we have multiple options to select which type data source we need to select. Here, we are selecting “Analysis Services”.
In this screen, we need to enter the server name, database name and select the cube.
Please refer my previous article:
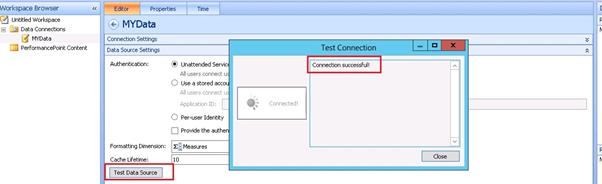
Click on the Test Data Source and it's showing the message Connection successful.
Now our Data Connection part is completed and next, we are going to create a report.
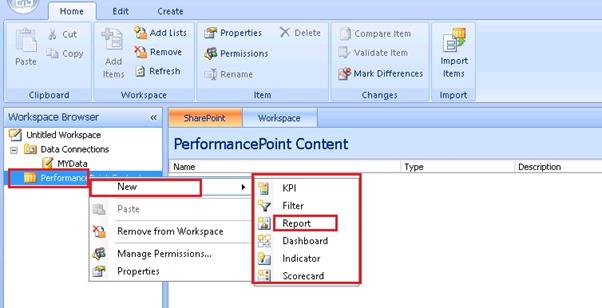
Right click on the PerformancePoint Content then New.
Here we have multiple options to select, we are selecting Report and others I will explain latter.
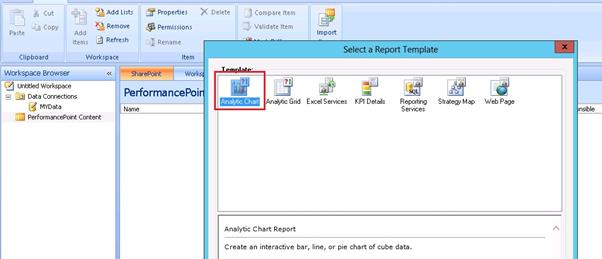
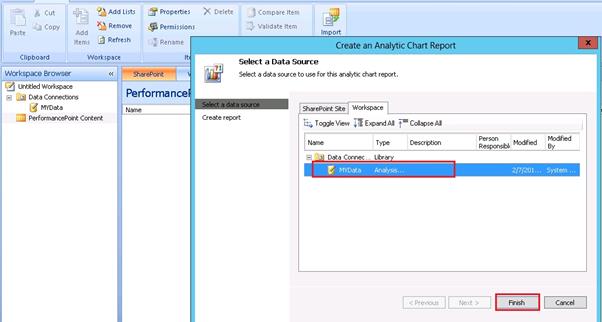
Click on the Analytic Chart.
Select a data source to use for this analytic chart report.
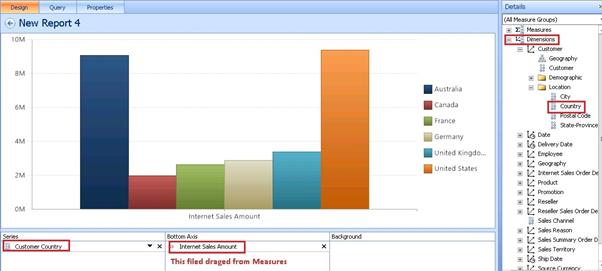
Thanks to Microsoft for the wonderful features, just drag and drop the values from Measures and Dimensions to generate the Reports.
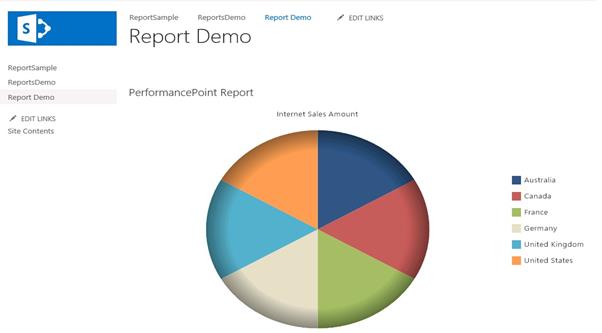
In our case, we dragged Internet sales Amount from Measures and Customer Country from Dimensions.
Our Report is generated successfully.
Just right click on the Report =>Report Type
Again Thanks to Microsoft, just a button click we can convert the chart as user wish.
Here we are converting this report as Pie Chart.
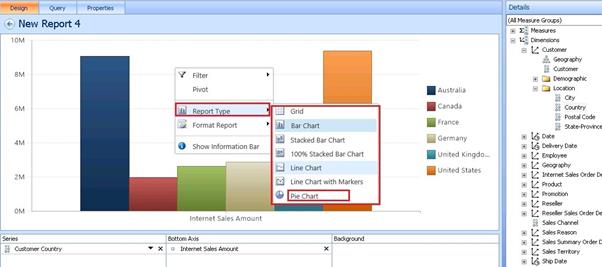
Yes, it’s converted as Pie Chart.

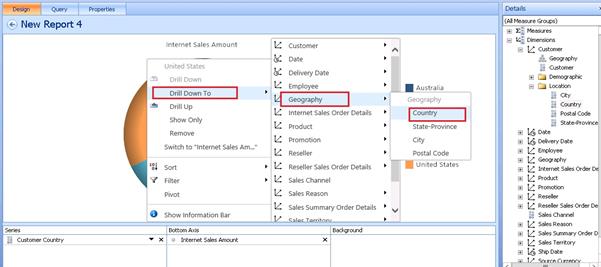
Drill Down options
Right click on the pie chart => Drill Down To
Now it’s showing all the dimensions from the cube, as per the user requirements they can create specific reports.
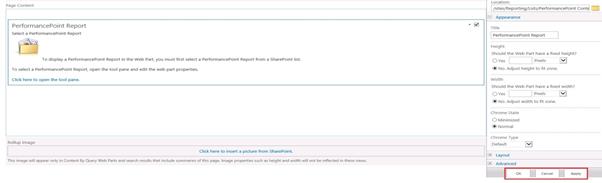
The next step creates a page in SharePoint site and inserts a PerformancePoint Report Web part.
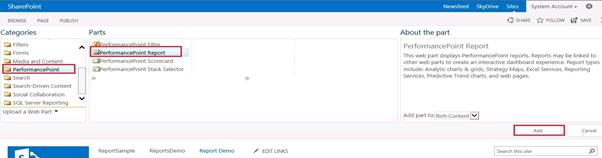
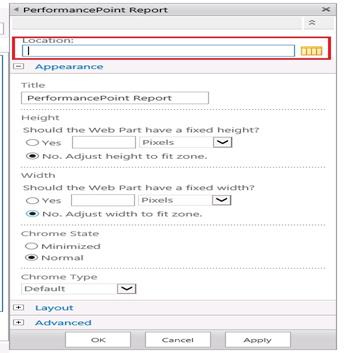
In the tool pane:
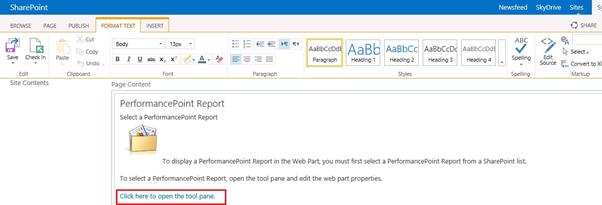
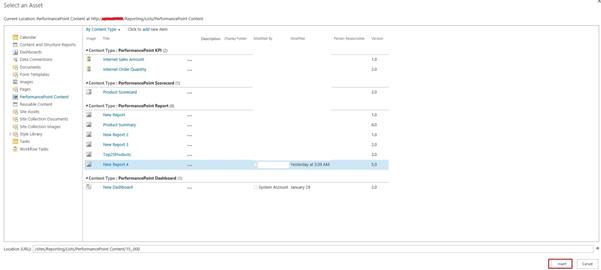
Click here to select the report which we need to display in the page:
Select one report and click Insert:
Click on the Apply Button:
Now our reports are showing in the page:
Filter
Right click on the Report =>Filter, and then click on Top 10.
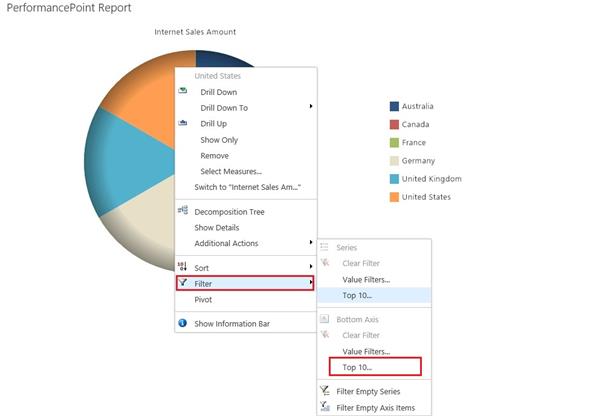
In this window, we can use the filter values for this report.

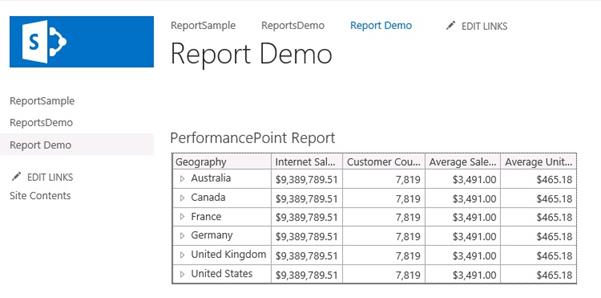
Here our Pie chart Report gets converted to Grid Report (We already learned about the report type.).
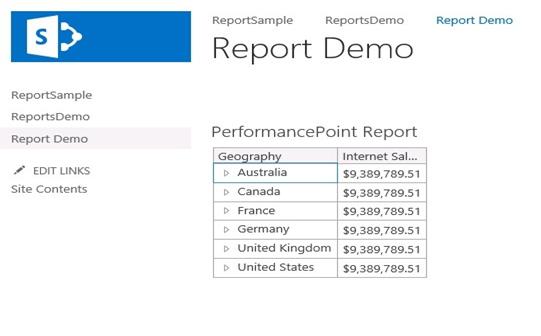
In this report, it's showing two columns Geography and Internet Sales. Our requirement is we need to add some more columns in this report.
For this purpose, we need to follow the below steps:
Right Click on the report => Select Measures

Here, it’s showing all the Measures and check which are the fields we need to add in the reports.
I checked three more fields, then click OK.
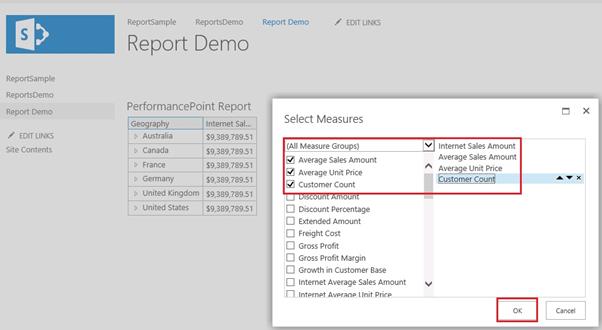
Yes. It worked, now our reports are showing 5 columns.