Canvas
Canvas是H5新增的一个标签,我们可以通过JS在这个标签上绘制各种图案,Canvas拥有多种绘制路径、矩形、圆形、字符以及图片的方法。
canvas标签有默认的宽度和高度, 默认的宽度是300px, 默认的高度是150px。
// 在body中创建一个canvas标签
<canvas></canvas>
<script>
    // 通过js代码拿到canvas标签
    let oCanvas = document.querySelector("canvas");
    // 从canvas标签中获取到绘图工具
    let oCtx = oCanvas.getContext("2d"); // 获取绘图工具

    // 通过绘图工具在canvas标签上绘制图形
    // 设置路径的起点
    oCtx.moveTo(50, 50);
    // 设置路径的终点
    oCtx.lineTo(200, 50);
    // 告诉canvas将这些点连接起来
    oCtx.stroke();
</script>
注意点:
- canvas有默认的宽度和高度:默认宽300px, 高150px
- 不能通过CSS设置画布的宽高,通过CSS设置画布宽高会在默认宽高的基础上拉伸,如果需要设置canvas宽高请通过元素行内属性width和height设置。
<canvas width="500" height="500"></canvas>
- 线条默认宽度和颜色,通过canvas绘制的线条默认宽度是1px,颜色是纯黑色;由于默认情况下canvas会将线条的中心点和像素的底部对齐,所以会导致显示效果是2px和非纯黑色问题。
// 解决办法
oCtx.moveTo(50, 50.5); // 往上移动0.5px, 线条中心点刚好是上边像素的底部
// 设置路径的终点
oCtx.lineTo(200, 50.5);
线条属性
lineWidth: 线条宽度
strokeStyle: 线条颜色
lineCap: 线末端类型:(butt默认)、round、square
let oCanvas = document.querySelector("canvas");
let oCtx = oCanvas.getContext("2d");
// 修改线条的高度
oCtx.lineWidth = 50; // 修改默认宽度,就不会出现默认宽度引起的问题
// 修改线条的颜色
oCtx.strokeStyle = "blue";
// 修改线条的两端样式
oCtx.lineCap = "round";
oCtx.moveTo(50, 50.5);
oCtx.lineTo(200, 50.5);
oCtx.stroke();
多根线条
多根线条:如果是同一个路径, 那么路径样式会被重用(第二次绘制会复用第一次的样式)。后设置的路径样式会覆盖先设置的路径样式。
为了不让样式互相影响,每根线条都开启一个新的路径。
beginPath: 重新开启一个路径
let oCanvas = document.querySelector("canvas");
let oCtx = oCanvas.getContext("2d");
oCtx.moveTo(50, 50);
oCtx.lineTo(200, 50);
oCtx.lineWidth = 20;
oCtx.strokeStyle = "blue";
oCtx.stroke();

oCtx.beginPath(); // 重新开启一个路径
oCtx.moveTo(50, 100);
oCtx.lineTo(200, 100);
oCtx.lineWidth = 10; // 重新设置当前路径样式,不会影响到之前的路径
oCtx.strokeStyle = "red";
oCtx.stroke();
简单图形
closePath:自动创建从当前点回到起始点的路径。
lineJoin:设置相交线的拐点样式 miter(默认)、round、bevel。
let oCanvas = document.querySelector("canvas");
let oCtx = oCanvas.getContext("2d");
oCtx.moveTo(50, 50);
oCtx.lineTo(200, 50);
oCtx.lineTo(200, 200);
// 注意点: 如果通过lineTo来闭合图形, 那么是不能很好的闭合
// oCtx.lineTo(50, 50);
oCtx.closePath();
oCtx.lineWidth = 20;
oCtx.lineJoin = "round";
// 注意点: 默认情况下不会自动从最后一个点连接到起点
oCtx.stroke();
lineTo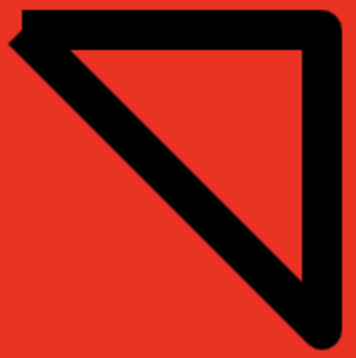
closePath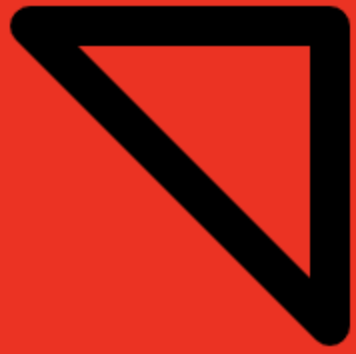
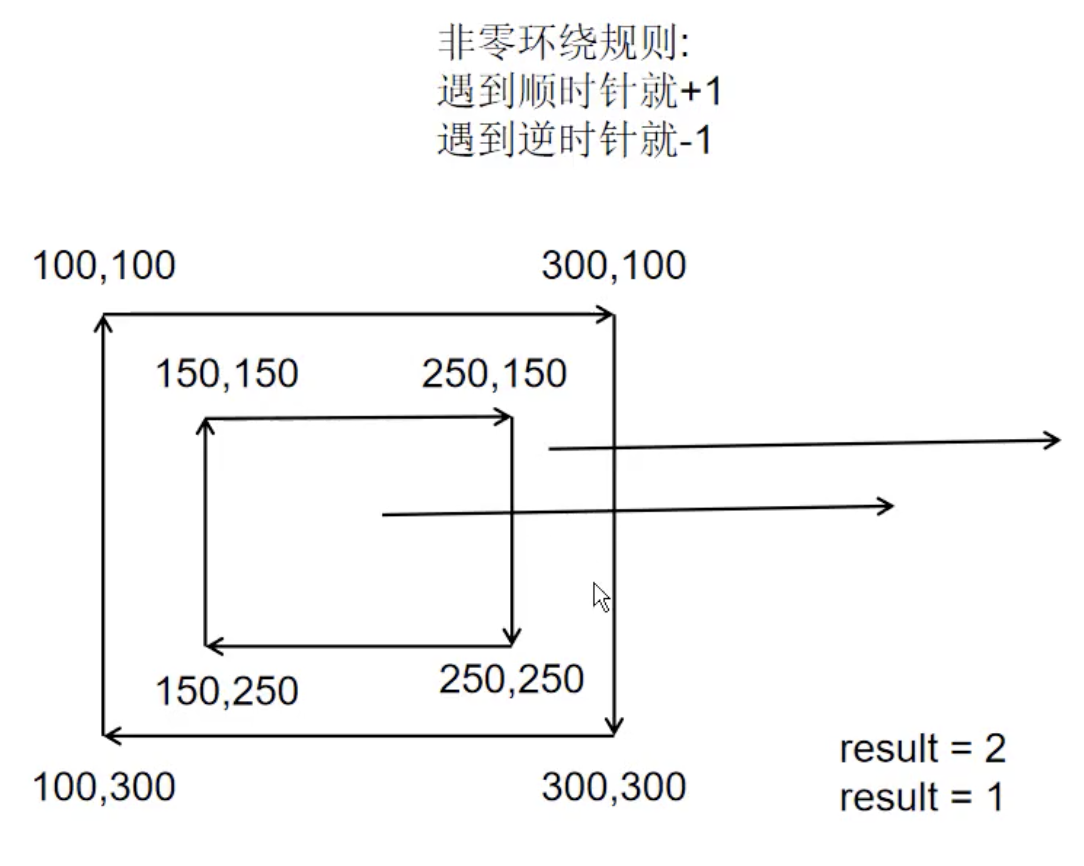
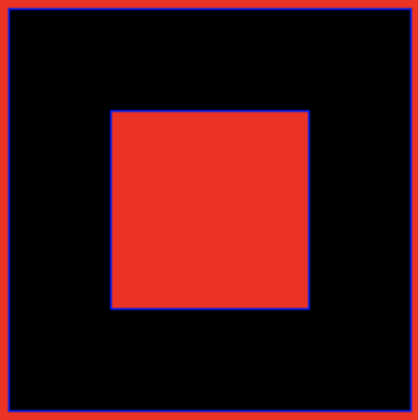
填充图形
stroke: 绘制已定义的路径
fill: 填充已定义的路径
对于同一路径,在填充的时候会遵循非零环绕规则,从当前的区域拉出一条直线, 遇到顺时针相交的线就+1, 遇到逆时针相交的线就-1,最终计算的结果如何是0就不填充,如果不是0就填充。
let oCanvas = document.querySelector("canvas");
let oCtx = oCanvas.getContext("2d");
// 顺时针画一个矩形
oCtx.moveTo(100, 100);
oCtx.lineTo(300, 100);
oCtx.lineTo(300, 300);
oCtx.lineTo(100, 300);
oCtx.closePath();
// 逆时针画一个矩形
oCtx.moveTo(250, 150);
oCtx.lineTo(150, 150);
oCtx.lineTo(150, 250);
oCtx.lineTo(250, 250);
oCtx.closePath();

oCtx.strokeStyle = "blue";
oCtx.lineWidth = 2;
oCtx.stroke();
oCtx.fill(); // 填充
虚线
setLineDash: 数组是用来描述你的虚线排列方式,索引偶数表示线条长度,基数表示间距
getLineDash: 获取虚线的排列方式 获取的是不重复的那一段的排列方式
lineDashOffset: 设置虚线的偏移位
let oCanvas = document.querySelector("canvas");
let oCtx = oCanvas.getContext("2d");
oCtx.moveTo(100, 100);
oCtx.lineTo(400, 100);
oCtx.lineWidth = 20;
oCtx.strokeStyle = "blue";
// oCtx.setLineDash([5, 20]);
oCtx.setLineDash([5, 10, 20]);
console.log(oCtx.getLineDash()); // [5, 10, 20, 5, 10, 20]
// oCtx.lineDashOffset = -50; // 当前虚线向着x轴左边偏移50px
oCtx.stroke();
 第一个线条宽度5px,第二个间隔10px,第三个宽度20px;前6个样式为一组不断重复,所以getLineDash打印数组长度为6。
绘制表格
// 1.拿到canvas
let oCanvas = document.querySelector("canvas");
// 2.从canvas中拿到绘图工具
let oCtx = oCanvas.getContext("2d");
// 3.定义变量保存小方格的尺寸
let gridSize = 50;
// 4.拿到canvas的宽高
let canvasWidth = oCtx.canvas.width;
let canvasHeight = oCtx.canvas.height;
// 5.计算在垂直方向和水平方向可以绘制多少条横线
let row = Math.floor(canvasHeight / gridSize);
let col = Math.floor(canvasWidth / gridSize);
// 6.绘制垂直方向的横线
for(let i = 0; i < row; i++){
    oCtx.beginPath();
    oCtx.moveTo(0, i * gridSize - 0.5);
    oCtx.lineTo(canvasWidth, i * gridSize - 0.5);
    oCtx.strokeStyle = "#ccc";
    oCtx.stroke();
}
// 7.绘制水平方向的横线
for(let i = 0; i < col; i++){
    oCtx.beginPath();
    oCtx.moveTo(i * gridSize - 0.5, 0);
    oCtx.lineTo(i * gridSize - 0.5, canvasHeight);
    oCtx.strokeStyle = "#ccc";
    oCtx.stroke();
}

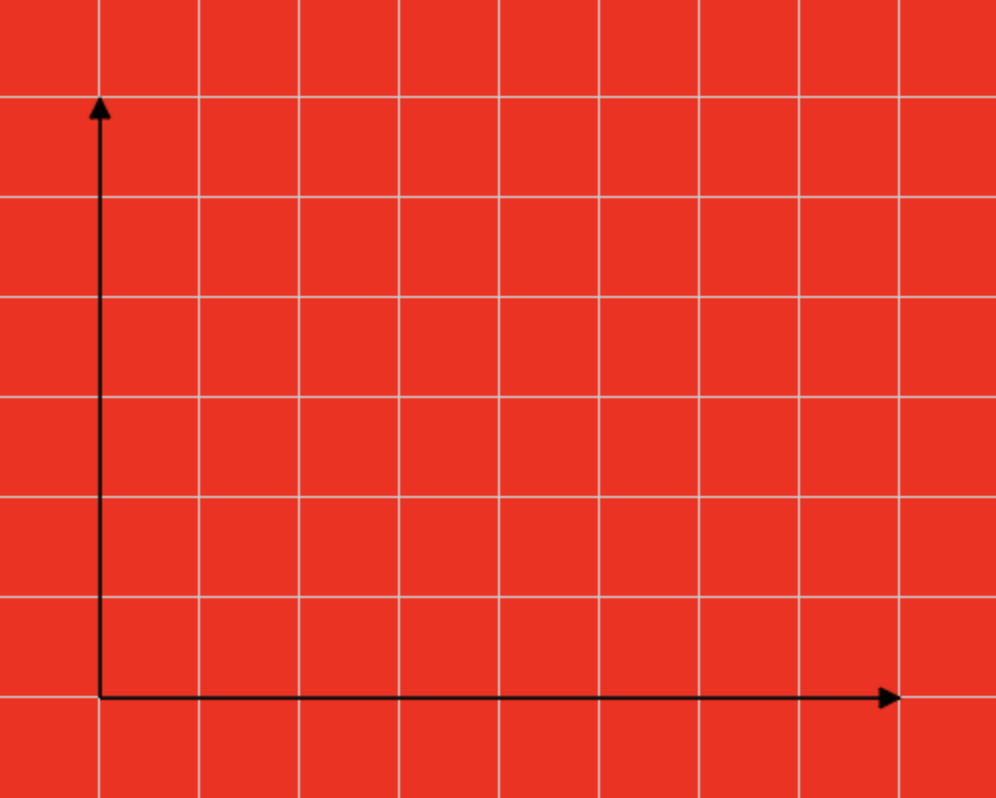
绘制坐标系
// 1.计算坐标系原点的位置
let originX = gridSize;
let originY = canvasHeight - gridSize;
// 2.计算X轴终点的位置
let endX = canvasWidth - gridSize;
// 3.绘制X轴
oCtx.beginPath();
oCtx.moveTo(originX, originY);
oCtx.lineTo(endX, originY);
oCtx.strokeStyle = "#000";
oCtx.stroke();
// 4.绘制X轴的箭头
oCtx.lineTo(endX - 10, originY + 5);
oCtx.lineTo(endX - 10, originY - 5);
oCtx.lineTo(endX, originY);
oCtx.closePath();
oCtx.strokeStyle = "#000";
oCtx.stroke();
oCtx.fill();

// 5.计算Y轴终点的位置
let endY = gridSize;
// 3.绘制Y轴
oCtx.beginPath();
oCtx.moveTo(originX, originY);
oCtx.lineTo(originX, endY);
oCtx.strokeStyle = "#000";
oCtx.stroke();
// 4.绘制X轴的箭头
oCtx.lineTo(originX - 5, endY + 10);
oCtx.lineTo(originX + 5, endY + 10);
oCtx.lineTo(originX, endY);
oCtx.closePath();
oCtx.strokeStyle = "#000";
oCtx.stroke();
oCtx.fill();
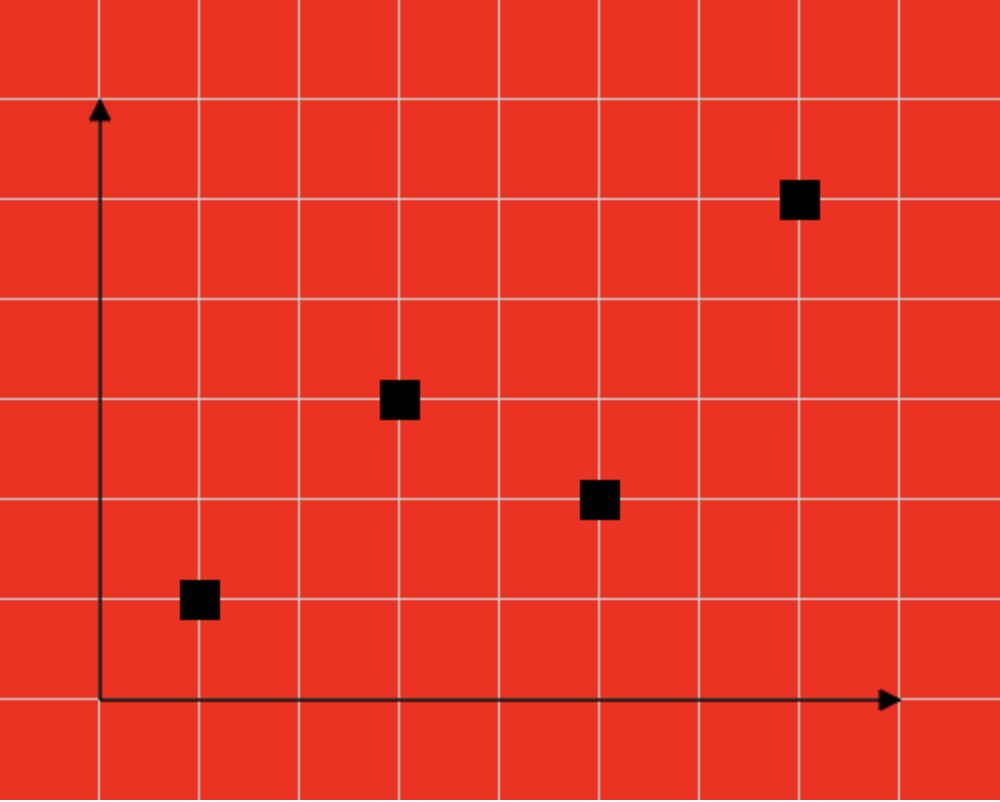
绘制数据点
// 1.拿到服务器返回数据
let list = [ { x: 100, y: 300 }, { x: 200, y: 200 }, { x: 300, y: 250 }, { x: 400, y: 100 }];
let dotSize = 20;
// 2.绘制数据点
for(let i = 0; i < list.length; i++){
    oCtx.beginPath();
    oCtx.moveTo(list[i].x - dotSize / 2, list[i].y - dotSize / 2);
    oCtx.lineTo(list[i].x + dotSize / 2, list[i].y - dotSize / 2);
    oCtx.lineTo(list[i].x + dotSize / 2, list[i].y + dotSize / 2);
    oCtx.lineTo(list[i].x - dotSize / 2, list[i].y + dotSize / 2);
    oCtx.closePath();
    // oCtx.stroke(); // 加上这个会多1px的默认边框
    oCtx.fill();
}
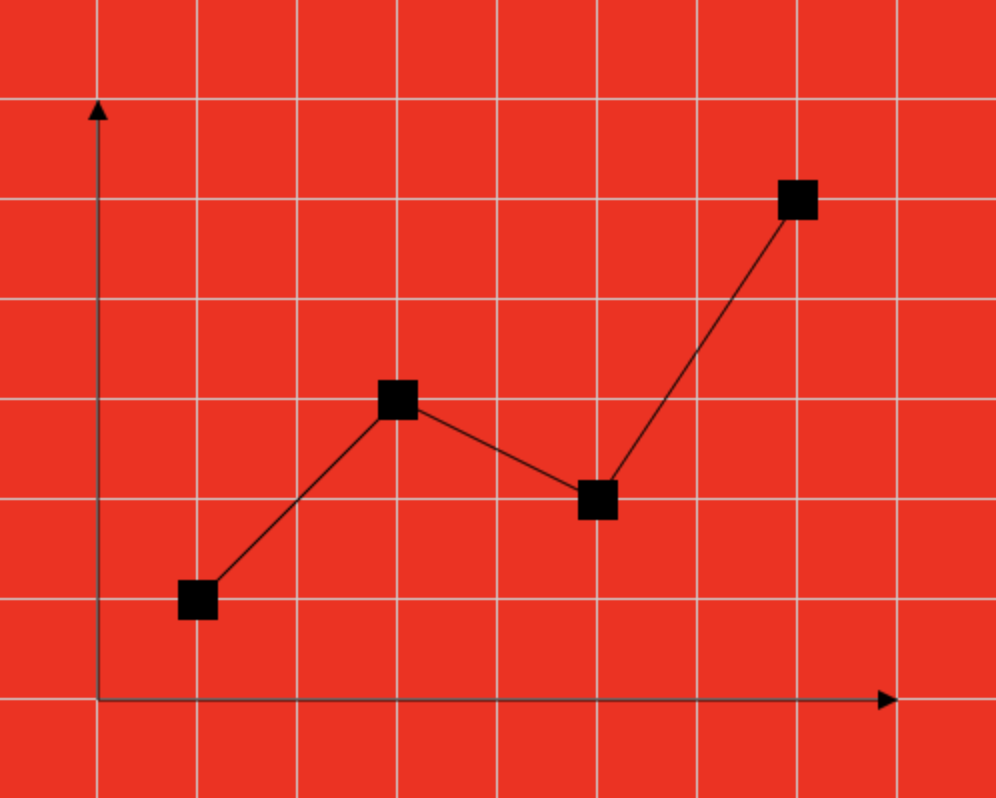
绘制折线图
// 1.绘制折线
oCtx.beginPath();
for(let i = 0; i < list.length; i++){
    if(i === 0){
        oCtx.moveTo(list[i].x, list[i].y);
    }else{
        oCtx.lineTo(list[i].x, list[i].y);
    }
}
oCtx.stroke();
折线图封装
class LineChart{
    constructor(width=300, height=150){
        // 1.创建canvas
        this.canvas = document.createElement("canvas");
        this.canvas.width = width;
        this.canvas.height = height;
        document.body.appendChild(this.canvas);
        // 2.拿到绘图工具
        this.ctx = this.canvas.getContext("2d");
    }
    drawGrid(gridSize=20){
        let oCtx = this.ctx;
        // 4.拿到canvas的宽高
        let canvasWidth = oCtx.canvas.width;
        let canvasHeight = oCtx.canvas.height;
        // 5.计算在垂直方向和水平方向可以绘制多少条横线
        let row = Math.floor(canvasHeight / gridSize);
        let col = Math.floor(canvasWidth / gridSize);
        // 6.绘制垂直方向的横线
        for(let i = 0; i < row; i++){
            oCtx.beginPath();
            oCtx.moveTo(0, i * gridSize - 0.5);
            oCtx.lineTo(canvasWidth, i * gridSize - 0.5);
            oCtx.strokeStyle = "#ccc";
            oCtx.stroke();
        }
        // 7.绘制水平方向的横线
        for(let i = 0; i < col; i++){
            oCtx.beginPath();
            oCtx.moveTo(i * gridSize - 0.5, 0);
            oCtx.lineTo(i * gridSize - 0.5, canvasHeight);
            oCtx.strokeStyle = "#ccc";
            oCtx.stroke();
        }
    }
    drawCoor(gridSize=20){
        let oCtx = this.ctx;
        let canvasWidth = this.ctx.canvas.width;
        let canvasHeight = this.ctx.canvas.height;

        // 1.计算坐标系原点的位置
        let originX = gridSize;
        let originY = canvasHeight - gridSize;
        // 2.计算X轴终点的位置
        let endX = canvasWidth - gridSize;
        // 3.绘制X轴
        oCtx.beginPath();
        oCtx.moveTo(originX, originY);
        oCtx.lineTo(endX, originY);
        oCtx.strokeStyle = "#000";
        oCtx.stroke();
        // 4.绘制X轴的箭头
        oCtx.lineTo(endX - 10, originY + 5);
        oCtx.lineTo(endX - 10, originY - 5);
        oCtx.lineTo(endX, originY);
        oCtx.fill();

        // 5.计算Y轴终点的位置
        let endY = gridSize;
        // 3.绘制Y轴
        oCtx.beginPath();
        oCtx.moveTo(originX, originY);
        oCtx.lineTo(originX, endY);
        oCtx.strokeStyle = "#000";
        oCtx.stroke();
        // 4.绘制X轴的箭头
        oCtx.lineTo(originX - 5, endY + 10);
        oCtx.lineTo(originX + 5, endY + 10);
        oCtx.lineTo(originX, endY);
        oCtx.fill();
    }
    drawDot(list, dotSize=10){
        let oCtx = this.ctx;
        // 2.绘制数据点
        for(let i = 0; i < list.length; i++){
            oCtx.beginPath();
            oCtx.moveTo(list[i].x - dotSize / 2, list[i].y - dotSize / 2);
            oCtx.lineTo(list[i].x + dotSize - dotSize / 2, list[i].y - dotSize / 2);
            oCtx.lineTo(list[i].x + dotSize - dotSize / 2, list[i].y + dotSize - dotSize / 2);
            oCtx.lineTo(list[i].x - dotSize / 2, list[i].y + dotSize - dotSize / 2);
            oCtx.closePath();
            oCtx.fill();
        }
    }
    drawLine(list){
        let oCtx = this.ctx;
        oCtx.beginPath();
        for(let i = 0; i < list.length; i++){
            if(i === 0){
                oCtx.moveTo(list[i].x, list[i].y);
            }else{
                oCtx.lineTo(list[i].x, list[i].y);
            }
        }
        oCtx.stroke();
    }
}

let list = [ { x: 100, y: 300 }, { x: 200, y: 200 }, { x: 300, y: 250 }, { x: 400, y: 100 }];
let lineChart = new LineChart(500, 400);
lineChart.drawGrid(50);
lineChart.drawCoor(50);
lineChart.drawDot(list);
lineChart.drawLine(list);
绘制柱状图
// 绘制矩形
for(let i = 0; i < list.length; i++){
    let barHeight = originY - list[i].y;
    oCtx.fillRect(list[i].x, list[i].y, gridSize, barHeight);
}
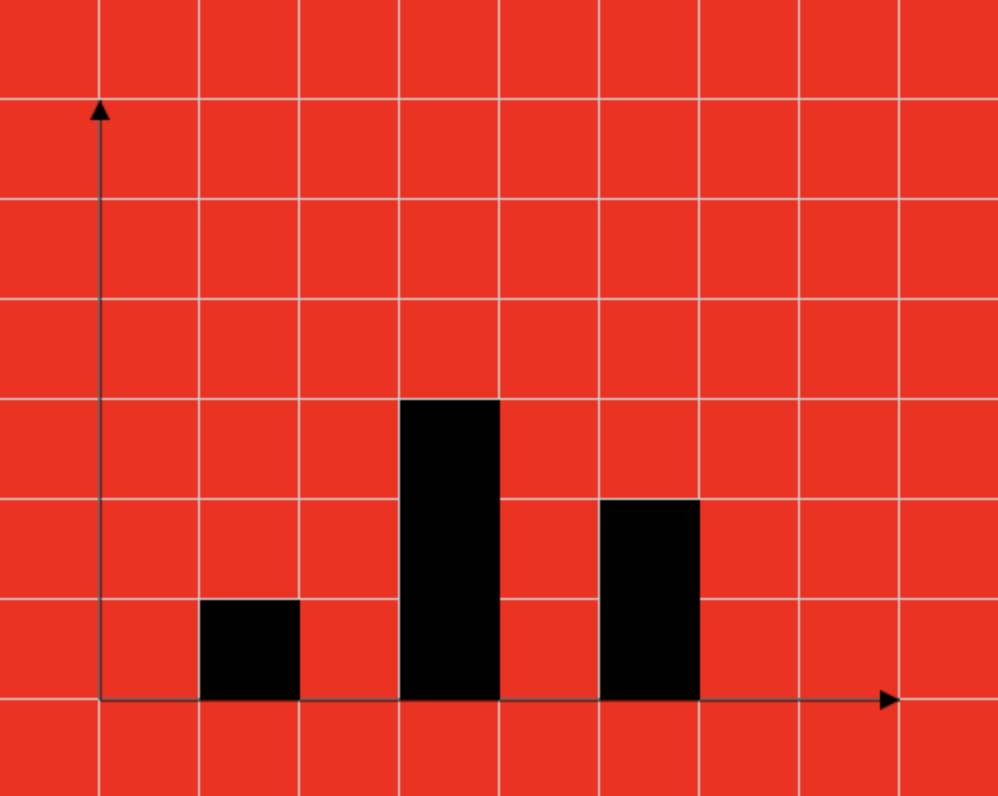
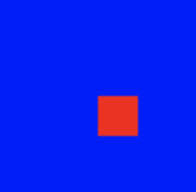
绘制矩形
rect: 第一个参数: x的坐标,第二个参数: y的坐标,第三个参数: 矩形的宽度,第四个参数: 矩形的高度.
strokeRect: 画一个矩形边框.
fillRect: 画一个矩形并填充,默认黑色.
clearRect: 给定矩形中清空一个矩形.
oCtx.rect(100, 100, 200, 200);
oCtx.stroke(); // 绘制矩形
oCtx.fill(); // 填充

oCtx.strokeStyle = "blue";
oCtx.strokeRect(150, 150, 100, 100);

oCtx.clearRect(200, 200, 20, 20);
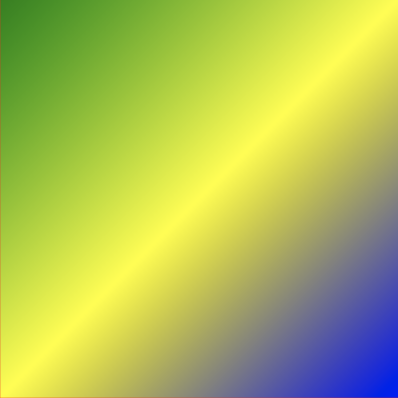
渐变色
和普通的标签一样,canvas也可以给填充的图形设置线性渐变和径向渐变的背景颜色。
设置图形渐变背景颜色步骤:
- 通过绘图工具创建渐变背景颜色
- 指定渐变的范围
- 将渐变背景颜色设置给对应的图形
/*
	参数为两个点的坐标:x0,y0 / x1,y1确定渐变的方向和渐变的范围
*/
createLinearGradient: 创建渐变方案
/*
	第一个参数是一个百分比 0~1,第二个参数是一个颜色
*/
addColorStop: 设置渐变颜色范围
let oCanvas = document.querySelector("canvas");
let oCtx = oCanvas.getContext("2d");

let linearGradient = oCtx.createLinearGradient(100, 100, 300, 300);

linearGradient.addColorStop(0, "green");
linearGradient.addColorStop(0.5, "yellow");
linearGradient.addColorStop(1, "blue");

oCtx.fillStyle = linearGradient;
oCtx.fillRect(100, 100, 200, 200);
绘制圆弧
1.基本概念(请翻开初中数学课本)
角度: 一个圆360度, 一个半圆是180度
弧度: 一个圆2π, 一个半圆π

2.角度转换弧度公式:
∵ 180角度 = π弧度
∴ 1角度 = π/180;
∴ 弧度 = 角度 * π/180;
    90角度 * π/180 = π/2

3.弧度转换角度公式:
∵ π弧度 = 180角度
∴ 1弧度 = 180/π
∴ 角度 = 弧度 * 180/π
    π/2 * 180/π = 180/2 = 90度
context.arc(x, y, radius, startAngle, endAngle, Boolean);
/*
    x, y: 确定圆心
    radius: 确定半径
    startAngle: 确定开始的弧度
    endAngle: 确定结束的弧度
    Boolean: 默认是false, false就是顺时针绘制, true就是逆时针绘制
*/
let oCanvas = document.querySelector("canvas");
let oCtx = oCanvas.getContext("2d");
oCtx.arc(100, 200, 50, 0, Math.PI, true);
oCtx.stroke();

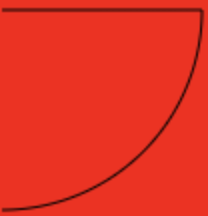
绘制扇形
oCtx.moveTo(100, 100);
oCtx.arc(100, 100, 100, 0, Math.PI/2);
oCtx.stroke() // 画出弧线
oCtx.closePath();
oCtx.fill();

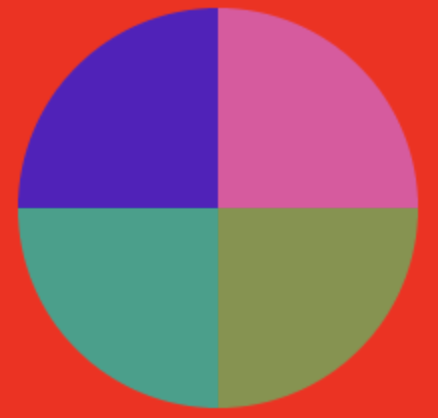
绘制饼状图
let oCanvas = document.querySelector("canvas");
let oCtx = oCanvas.getContext("2d");

let startAngle = 0;
for(let i = 1; i <= 4; i++){
    let endAngle = i * Math.PI/2;
    oCtx.beginPath();
    oCtx.moveTo(rx, ry);
    oCtx.arc(rx, ry, 100, startAngle, endAngle);
    oCtx.fillStyle = randomColor();
    oCtx.fill();
    startAngle = endAngle;
}

function randomColor() {
    let r = Math.floor(Math.random() * 256);
    let g = Math.floor(Math.random() * 256);
    let b = Math.floor(Math.random() * 256);
    return `rgb(${r},${g},${b})`;
}
绘制文字
textBaseline: textBaseline属性可以设置文字垂直方向的对齐方式,对齐的时候是以绘制文字的y作为参考点进行对齐的.
textAlign: textAlign属性可以设置文字水平方向的对齐方式,在对齐的时候是以绘制文字的x作为参考点进行对齐的.
在绘制文字的时候, 是以文字的左下角作为参考点进行绘制
strokeText: 绘制出文字的比边框
fillText: 给文字填充颜色
// 绘制参考线
let canvasWidth = oCtx.canvas.width;
let canvasHeight = oCtx.canvas.height;
oCtx.moveTo(0, canvasHeight/2);
oCtx.lineTo(canvasWidth, canvasHeight/2);
oCtx.stroke();
oCtx.moveTo(canvasWidth/2, 0);
oCtx.lineTo(canvasWidth/2, canvasHeight);
oCtx.stroke();
// 绘制文字
let str = "hello,world";
// 通过font属性可以设置文字的大小和样式
oCtx.font = "50px 微软雅黑";
oCtx.textBaseline = "middle";
oCtx.textAlign = "center";
oCtx.strokeText(str, canvasWidth/2, canvasHeight/2); // 绘制出文字边框
oCtx.fillText(str, canvasWidth/2, canvasHeight/2);

绘制图片
oCtx.drawImage(oImg, 50, 50, 100, 100, 100, 100, 100, 100);
/*
		1. 如果只有三个参数, 那么第一个参数就是需要绘制的图片
		第2~3个参数指定图片上定位的位置
		2. 如果只有五个参数, 那么第一个参数就是需要绘制的图片
		第2~3个参数指定图片从什么位置开始绘制
		第4~5个参数是指定图片需要拉伸到多大
		3. 如果有九个参数,那么第一个参数就是需要绘制的图片
    第2~3个参数指定图片上定位的位置
    第4~5个参数指定从定位的位置开始截取多大的图片
    第6~7个参数指定图片从什么位置开始绘制
    第8~9个参数是指定图片需要拉伸到多大
*/
let oCanvas = document.querySelector("canvas");
let oCtx = oCanvas.getContext("2d");
// 加载图片
let oImg = new Image();
oImg.onload = function () {
    // oCtx.drawImage(oImg, 100, 100);
    // oCtx.drawImage(oImg, 100, 100, 100, 100);
    oCtx.drawImage(oImg, 50, 50, 100, 100, 100, 100, 100, 100);
}
oImg.src = "images/test.jpg";
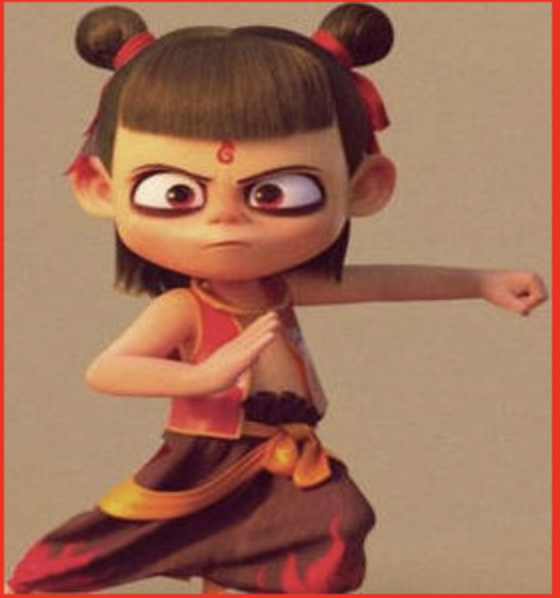


帧动画
<canvas width="150" height="150"></canvas>
<script>
let oCanvas = document.querySelector("canvas");
let oCtx = oCanvas.getContext("2d");
let oImg = new Image();
oImg.onload = function () {
// 计算每一张图片的宽高
let imageWidth = oImg.width;
let imageHeight = oImg.height;
let personWidth = imageWidth / 4;
let personHeight = imageHeight / 4;
// 计算绘制的位置
let canvasWidth = oCtx.canvas.width;
let canvasHeight = oCtx.canvas.height;
let originX = canvasWidth / 2 - personWidth / 2;
let originY = canvasHeight / 2 - personHeight / 2;
// 绘制图片
oCtx.drawImage(oImg, 0, personHeight * 2, personWidth, personHeight, originX, originY, personWidth, personHeight);
// 实现逐帧动画
let index = 1;
setInterval(function () {
oCtx.clearRect(0, 0, canvasWidth, canvasHeight);
oCtx.drawImage(oImg, index * personWidth, personHeight * 2, personWidth, personHeight, originX, originY, personWidth, personHeight);
index++;
if(index > 3){
index = 0;
}
}, 200);
}
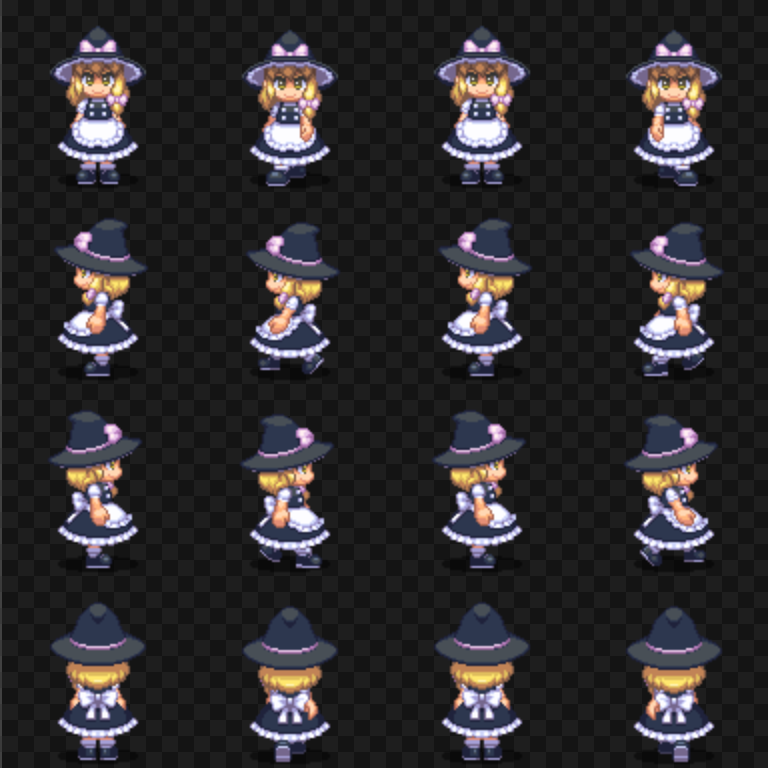
oImg.src = "images/person.png";
</script>

封装
<canvas width="500" height="400"></canvas>
<script>
    let oCanvas = document.querySelector("canvas");
    let oCtx = oCanvas.getContext("2d");

    class Person{
        constructor(canvas, x, y){
            this.canvas = canvas;
            this.x = x;
            this.y = y;
            this.oCtx = canvas.getContext("2d");
            this.index = 1;
            this.timerId = null;
            // 0正面/1左面/2右面/3后面
            this.direction = 0;
        }
        render(){
            let oImg = new Image();
            oImg.onload = () => {
                // 1.计算每一张图片的宽高
                let imageWidth = oImg.width;
                let imageHeight = oImg.height;
                let personWidth = imageWidth / 4;
                let personHeight = imageHeight / 4;
                // 2.绘制图片
                this.oCtx.drawImage(
                    oImg, // 需要绘制的图片
                    0, this.direction * personHeight, // 图片定位的位置
                    personWidth, personHeight, // 图片裁剪的大小
                    this.x, this.y, // 图片绘制的位置
                    personWidth, personHeight // 指定图片绘制的大小
                );
                this.oImg= oImg;
                this.personWidth = personWidth;
                this.personHeight = personHeight;
            }
            oImg.src = "images/person.png";
        }
        run(stepX, stepY){
            let canvasWidth = this.oCtx.canvas.width;
            let canvasHeight = this.oCtx.canvas.height;
            clearInterval(this.timerId);
            this.timerId = setInterval(() => {
                if(stepX !== 0){
                    this.x += stepX;
                }
                if(stepY !== 0){
                    this.y += stepY;
                }
                this.oCtx.clearRect(0, 0, canvasWidth, canvasHeight);
                this.oCtx.drawImage(
                    this.oImg, // 需要绘制的图片
                    this.index * this.personWidth, this.direction * this.personHeight, // 图片定位的位置
                    this.personWidth, this.personHeight, // 图片裁剪的大小
                    this.x, this.y, // 图片绘制的位置
                    this.personWidth, this.personHeight // 指定图片绘制的大小
                );
                this.index++;
                if(this.index > 3){
                    this.index = 0;
                }
            }, 500);
        }
        moveDown(){
            this.direction = 0;
            this.run(0, 5);
        }
        moveUp(){
            this.direction = 3;
            this.run(0, -5);
        }
        moveLeft(){
            this.direction = 1;
            this.run(-5, 0);
        }
        moveRight(){
            this.direction = 2;
            this.run(5, 0);
        }
        stop(){
            clearInterval(this.timerId);
        }
    }
    let person = new Person(oCanvas, 100, 100);
    person.render();
    person.moveDown();

    window.onkeydown = function (event) {
        let key = event.key;
        switch (key.toLowerCase()){
            case "w":
                person.moveUp();
                break;
            case "s":
                person.moveDown();
                break;
            case "a":
                person.moveLeft();
                break;
            case "d":
                person.moveRight();
                break;
        }
    }
</script>
形变
在canvas中所有的形变属性操作的都是坐标系,而不是图形。
let oCanvas = document.querySelector("canvas");
let oCtx = oCanvas.getContext("2d");

oCtx.translate(100, 0);
oCtx.translate(0, 100);
oCtx.translate(100, 100);

oCtx.rotate(Math.PI/6);

oCtx.scale(0.5, 1);
// 绘制一个矩形长200, 宽100的矩形
oCtx.strokeRect(100, 100, 200, 100);
事件监听
整个canvas是一个标签,所以只能通过监听鼠标在canvas上的位置来判断是否需要处理对应的图形;也可以通过第三方框架来解决交互问题,比如:zrender.js / Knova.js /three.js / egret.js / pixi.js等等
isPointInPath: 如果开启了一个新的路径, 那么该方法判断的就是点是否在新的路径的图形中
oCanvas.onclick = function (event) {
    let x = event.offsetX;
    let y = event.offsetY;
    console.log(oCtx.isPointInPath(x, y)); /* oCtx是一个绘制的矩形Canvas对象 */
}
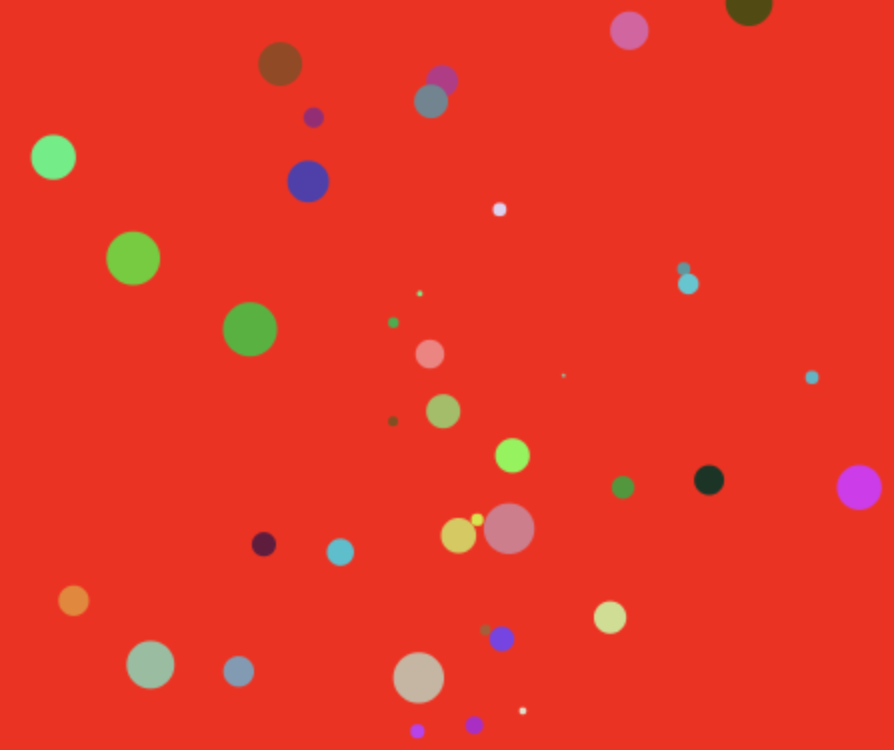
炫彩小球
<body>
  <canvas width="500" height="400"></canvas>
  <script>
    // 1.拿到canvas
    let oCanvas = document.querySelector("canvas");
    // 2.从canvas中拿到绘图工具
    let oCtx = oCanvas.getContext("2d");
    class Ball {
      constructor(canvas, x, y) {
        this.canvas = canvas;
        this.x = x;
        this.y = y;
        this.r = 30;
        this.color = this._randomColor();
        this.oCtx = canvas.getContext("2d");
        this.canvasWidth = this.oCtx.canvas.width;
        this.canvasHeight = this.oCtx.canvas.height;
        // 生成偏移位
        this.dx = this._getRandomArbitrary(-5, 6); // -5~5
        this.dy = this._getRandomArbitrary(-5, 6); // -5~5
        this.dr = this._getRandomArbitrary(0.5, 1);
      }
      render() {
        // this.oCtx.clearRect(0, 0, this.canvasWidth, this.canvasHeight); // 防止每次渲染都清空绘图区
        this.oCtx.beginPath();
        this.oCtx.arc(this.x, this.y, this.r, 0, Math.PI * 2);
        this.oCtx.fillStyle = this.color;
        this.oCtx.fill();
      }
      update() {
        this.x += this.dx;
        this.y += this.dy;
        this.r -= this.dr;
        if (this.r <= 0 || this.x <= 0 || this.y <= 0 ||
          this.x >= this.canvasWidth || this.y >= this.canvasHeight) {
          return false;
        }
        return true;
      }
      _randomColor() {
        let r = Math.floor(this._getRandomArbitrary(0, 256));
        let g = Math.floor(this._getRandomArbitrary(0, 256));
        let b = Math.floor(this._getRandomArbitrary(0, 256));
        return `rgb(${r}, ${g}, ${b})`;
      }
      _getRandomArbitrary(min, max) {
        return Math.random() * (max - min) + min;
      }
    }
    let list = [];
    oCanvas.onmousemove = function (event) { // 鼠标移动的时候生成一个小球并添加到数组
      let x = event.offsetX;
      let y = event.offsetY;
      let ball = new Ball(oCanvas, x, y);
      ball.render();
      list.push(ball);
    }
    setInterval(function () {
      oCtx.clearRect(0, 0, oCtx.canvas.width, oCtx.canvas.height);
      for (let i = 0; i < list.length; i++) {
        let ball = list[i];
        let res = ball.update();
        if (res) {
          ball.render();
        } else {
          list.splice(i, 1); // 小球已经移动到绘图区域之外了
        }
      }
    }, 50);
  </script>
</body>
canvas和svg区别
SVG 是一种使用 XML 描述 2D 图形的语言。SVG 基于 XML,这意味着 SVG DOM 中的每个元素都是可用的。您可以为某个元素附加 JavaScript 事件处理器。在 SVG 中,每个被绘制的图形均被视为对象。如果 SVG 对象的属性发生变化,那么浏览器能够自动重现图形。
Canvas 通过 JavaScript 来绘制 2D 图形。Canvas 是逐像素进行渲染的。在 canvas 中,一旦图形被绘制完成,它就不会继续得到浏览器的关注。如果其位置发生变化,那么整个场景也需要重新绘制,包括任何或许已被图形覆盖的对象。
Canvas
      依赖分辨率
      不支持事件处理器
      弱的文本渲染能力
      能够以 .png 或 .jpg 格式保存结果图像
      最适合图像密集型的游戏,其中的许多对象会被频繁重绘
SVG
      不依赖分辨率
      支持事件处理器
      最适合带有大型渲染区域的应用程序(比如谷歌地图)
      复杂度高会减慢渲染速度(任何过度使用 DOM 的应用都不快)
      不适合游戏应用