转自:http://blog.thematicmapping.org/2012/11/exploring-mapbox-stack-mbtiles-tilejson.html
In my last blog post, we created a population density map of New Zealand using QGIS, SQLite and TileMill. Today, we’re going to publish this map to the web using various MapBox inventions. I'll also show you how to publish an interactive TileMill map on your own web server using some PHP and JavaScript wizardry.
I love MapBox. The team behind this platform has created a series of new specifications, allowing us to create fast, good looking and interactive maps. The downside is the limited support for other map projections than Web Mercator.
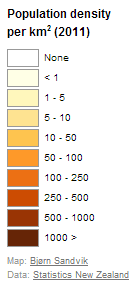
TileMill allows you to add legends and tooltips to your maps. I’ve added a legend to my population density map with a HTML snippet describing the map and the color scale.
| 123456789101112131415161718 |
<div class='my-legend'>
<div class='legend-title'>Population density<br/>per km<sup>2</sup> (2011)</div>
<div class='legend-scale'>
<ul class='legend-labels'>
<li><span style='background:#FFFFFF;'></span>None</li>
<li><span style='background:#FFFFE5;'></span>< 1</li>
<li><span style='background:#FFF7BC;'></span>1 - 5</li>
<li><span style='background:#FEE391;'></span>5 - 10</li>
<li><span style='background:#FEC44F;'></span>10 - 50</li>
<li><span style='background:#FE9929;'></span>50 - 100</li>
<li><span style='background:#EC7014;'></span>100 - 250</li>
<li><span style='background:#CC4C02;'></span>250 - 500</li>
<li><span style='background:#993404;'></span>500 - 1000</li>
<li><span style='background:#662506;'></span>1000 ></li>
</ul>
</div>
<div class='legend-source'>Map: <a href="http://blog.thematicmapping.org">Bjørn Sandvik</a><br/>Data: <a href="http://www.stats.govt.nz/">Statistics New Zealand</a></div>
</div>
|
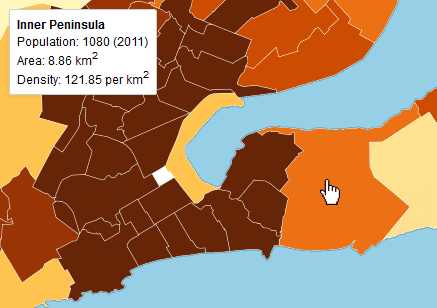
The tooltip shows when the user hovers over or clicks on the map. It allows us to show dynamic content - additional data, images, charts - for each map feature. I want to show the name, total population, area and population density for each feature:
| 123456 |
<div>
<strong>{{{au_name}}}</strong><br>
Population: {{{pop2011}}} (2011)<br>
Area: {{{area}}} km<sup>2</sup><br>
Density: {{{popdens}}} per km<sup>2</sup>
</div>
|
The data fields for the layer are wrapped in curly Mustache tags. These tags will be replaced by data when you interact with the map. You can use the full Mustache template language.
The easy way to publish this map is to upload it to MapBox Hosting, and use the embed code provided. If you want to publish your map on your own web server, this is an alternative route:
To export an interactive map from TileMill, you need to use the MBTiles format. This is an innovative SQLite-basedformat specification capable of storing millions of map tiles in a single file. The format is also supported by various3rd-party applications, and I'm sure we'll see a greater adoption in the future.
Within the MBTiles file, the map legend, the tooltip template and information about map extent, zoom levels etc. is stored in a format named TileJSON. This is also an open specification, providing a consistent way of describing a map, making it easier to load and display a map the way it’s meant to be seen. The TileJSON for my map looks like this:
| 1234567891011121314151617181920 |
{
"tilejson": "2.0.0",
"scheme": "xyz",
"bounds": [ 166, -47.5, 179, -34 ],
"center": [ 173.3, -41.273, 5 ],
"minzoom": 0,
"maxzoom": 12,
"name": "Population density map of New Zealand",
"description": "Created by Bjørn Sandvik
http://blog.thematicmapping.org/",
"legend": "<div class='my-legend'>
<div class='legend-title'>Population density<br/>per km<sup>2</sup> (2011)</div>
<div class='legend-scale'>
<ul class='legend-labels'>
<li><span style='background:#FFFFFF;'></span>None</li>
<li><span style='background:#FFFFE5;'></span>< 1</li>
<li><span style='background:#FFF7BC;'></span>1 - 5</li>
<li><span style='background:#FEE391;'></span>5 - 10</li>
<li><span style='background:#FEC44F;'></span>10 - 50</li>
<li><span style='background:#FE9929;'></span>50 - 100</li>
<li><span style='background:#EC7014;'></span>100 - 250</li>
<li><span style='background:#CC4C02;'></span>250 - 500</li>
<li><span style='background:#993404;'></span>500 - 1000</li>
<li><span style='background:#662506;'></span>1000 ></li>
</ul>
</div>
<div class='legend-source'>Map: <a href="http://blog.thematicmapping.org">Bjørn Sandvik</a><br/>Data: <a href="http://www.stats.govt.nz/">Statistics New Zealand</a></div>
</div>",
"attribution": "Statistics New Zealand",
"template": "{{#__location__}}{{/__location__}}{{#__teaser__}}<div>
<strong>{{{au_name}}}</strong><br>
Population: {{{pop2011}}} (2011)<br>
Area: {{{area}}} km<sup>2</sup><br>
Density: {{{popdens}}} per km<sup>2</sup>
</div>{{/__teaser__}}{{#__full__}}{{/__full__}}",
"version": "1.0.0",
"tiles": [
"http://earthatlas.info/nz/tiles/nz-popden/{z}/{x}/{y}.png"
],
"grids": [
"http://earthatlas.info/nz/tiles/nz-popden/{z}/{x}/{y}.json"
]
}
|
If you add interactivity to your map (tooltips), your MBTiles file will also include the most impressing part of the MapBox specifications: UTFgrids. This JSON-format allows us to add thousands of interactive points or polygons through interactivity data grids, and it will even work in older browsers with limited support for vector data.
So how do we turn our MBTiles file into an interactive map? Previously, I've used MBUtil to extract the contents from MBTiles into a directory structure. But by doing this, we loose the benefits of the MBTiles format, like storing a map in a single file and dealing with redundant images. What we need is a script on our web server that will extract content from our MBTiles file on demand. I decided to try a PHP script from infostreams (this is probably not the most scaleable solution). The script supports the full MBTiles specification, including TileJSON and UTFGrids. Installation is simple: just put the .php file and the .htaccess file in the same directory as your .mbtiles files. The .htaccess file includes a rule that rewrites requested URLs on the fly, so the map data is available un URLs like:
- TileJSON: http://earthatlas.info/nz/tiles/nz-popden.tilejson
- Map tile: http://earthatlas.info/nz/tiles/nz-popden/9/504/320.png
- UTFGrid: http://earthatlas.info/nz/tiles/nz-popden/9/504/320.json
So when we have our backend sorted, how can we recreate our interactive map with Leaflet or other JavaScript mapping libraries? This is way the MapBox team created Wax, which is a client implementation of the MBTiles interaction specification. You just include the wax script together with your mapping library of choice, and then you can add interactivity with a few lines of code:
| 123456789101112131415161718 |
// Load TileJSON
wax.tilejson('http://earthatlas.info/nz/tiles/nz-popden.tilejson', function(tilejson) {
// Create map and add image tiles
var map = new L.Map('map-div')
.addLayer(new wax.leaf.connector(tilejson))
.setView(new L.LatLng(51, 0), 1);
// Create map legend
wax.leaf.legend(map, tilejson).appendTo(map._container);
// Add map interaction (tooltips)
wax.leaf.interaction()
.map(map)
.tilejson(tilejson)
.on(wax.tooltip().animate(true).parent(map._container).events());
});
|
I've also done some extra JavaScript coding to allow switching between various interactive map layers. I'll save that for a later blog post.
The Leaflet map looks like this (there seems to be an issue with the latest Wax distribution and Google Chrome):
Fullscreen map