1. MySQL配置
MySQL安装配置参考我的博客其他文章(安装配置参考:mysql-5.7.30安装配置,主从配置参考:mysql 5.7主从配置),这里只讲述如何利用Prometheus监控MySQL5.7数据库。
1.1 新增监控帐号
在MySQL数据库中,新增Prometheus监控帐号,用于各类性能数据查询;
mysql> GRANT PROCESS, REPLICATION CLIENT, SELECT ON *.* TO 'exporter'@'::1' IDENTIFIED BY 'exporter@123' WITH MAX_USER_CONNECTIONS 3;
mysql> flush privileges;
1.2 修改MySQL配置文件增加授权
配置my.cnf
cat >> /usr/local/mysqld_exporter/.my.cnf << EOF
[client]
host=localhost
port=3306
user=exporter
password=exporter@123
EOF
2. 安装监控客户端
2.1 监控客户端安装
在需要监控的MySQL数据库服务器上安装mysqld_exporter:
cd /usr/local/
wget https://github.com/prometheus/mysqld_exporter/releases/download/v0.12.0/mysqld_exporter-0.12.0.linux-amd64.tar.gz
# 下载不了的自己想办法哈,当然也可以留言给我。
tar xzf mysqld_exporter-0.12.1.linux-amd64.tar.gz
ln -sv mysqld_exporter-0.12.1.linux-amd64 mysqld_exporter
chown -R prometheus:prometheus /usr/local/mysqld_exporter/mysqld_exporter
chmod 755 /usr/local/mysqld_exporter/mysqld_exporter
2.2 配置mysqld_exporter为系统服务
cat >> /usr/lib/systemd/system/mysqld_exporter.service << EOF
[Unit]
Description=mysqld_exporter
Documentation=https://prometheus.io/
After=network.target

[Service]
Type=simple
User=prometheus
ExecStart=/usr/local/mysqld_exporter/mysqld_exporter --web.listen-address=0.0.0.0:9104 --config.my-cnf=/usr/local/mysqld_exporter/.my.cnf
--log.level=error
--collect.info_schema.processlist
--collect.info_schema.innodb_metrics
--collect.info_schema.innodb_tablespaces
--collect.info_schema.innodb_cmp
--collect.info_schema.innodb_cmpmem
Restart=on-failure

[Install]
WantedBy=multi-user.target
EOF
下面是搜集主从信息的,没有配置主从可以不加这两个选项,否则会报错:msg="Error scraping for collect.slave_hosts: Error 1227: Access denied; you need (at least one of) the REPLICATION SLAVE privilege(s) for this operation" source="exporter.go:171"
--collect.slave_status
--collect.slave_hosts
2.3 设置开机启动并启动mysqld_exporter
chown -R prometheus:prometheus /usr/lib/systemd/system/mysqld_exporter.service
chmod 644 /usr/lib/systemd/system/mysqld_exporter.service
systemctl daemon-reload
systemctl enable mysqld_exporter.service
systemctl start mysqld_exporter.service
3. 监控指标查看
3.1 metrics监控内容
访问:http://ip:9104/metrics 可以看到mysql的指标
# HELP go_gc_duration_seconds A summary of the GC invocation durations.
# TYPE go_gc_duration_seconds summary
go_gc_duration_seconds{quantile="0"} 1.0977e-05
go_gc_duration_seconds{quantile="0.25"} 1.1386e-05
go_gc_duration_seconds{quantile="0.5"} 1.1929e-05
go_gc_duration_seconds{quantile="0.75"} 1.665e-05
go_gc_duration_seconds{quantile="1"} 3.3897e-05
go_gc_duration_seconds_sum 0.000189596
go_gc_duration_seconds_count 12
# HELP go_goroutines Number of goroutines that currently exist.
# TYPE go_goroutines gauge
go_goroutines 8
...此处省略若干行
# HELP mysql_up Whether the MySQL server is up.
# TYPE mysql_up gauge
mysql_up 1
# HELP mysql_version_info MySQL version and distribution.
...此处省略若干行
3.2 确认监控指标正常
# curl localhost:9104/metrics | grep mysql_up
% Total % Received % Xferd Average Speed Time Time Time Current
Dload Upload Total Spent Left Speed
100 233k 100 233k 0 0 4322k 0 --:--:-- --:--:-- --:--:-- 4410k
# HELP mysql_up Whether the MySQL server is up.
# TYPE mysql_up gauge
mysql_up 1 #说明mysql启动,并且能正常监控到了
4. 在Prometheus中配置MySQL监控
在Prometheus-Server中配置MySQL数据采集
修改prometheus配置文件:
在 scrape_configs下面添加如下配置
# vim /usr/local/prometheus/prometheus.yml
scrape_configs:
- job_name: 'mysql_db'
static_configs:
- targets: ['10.88.8.120:9104']
labels:
instance: wikidb-10.88.8.120
group: mysql_db
- job_name: 'mysql-host'
static_configs:
- targets: ['10.88.8.120:9100']
labels:
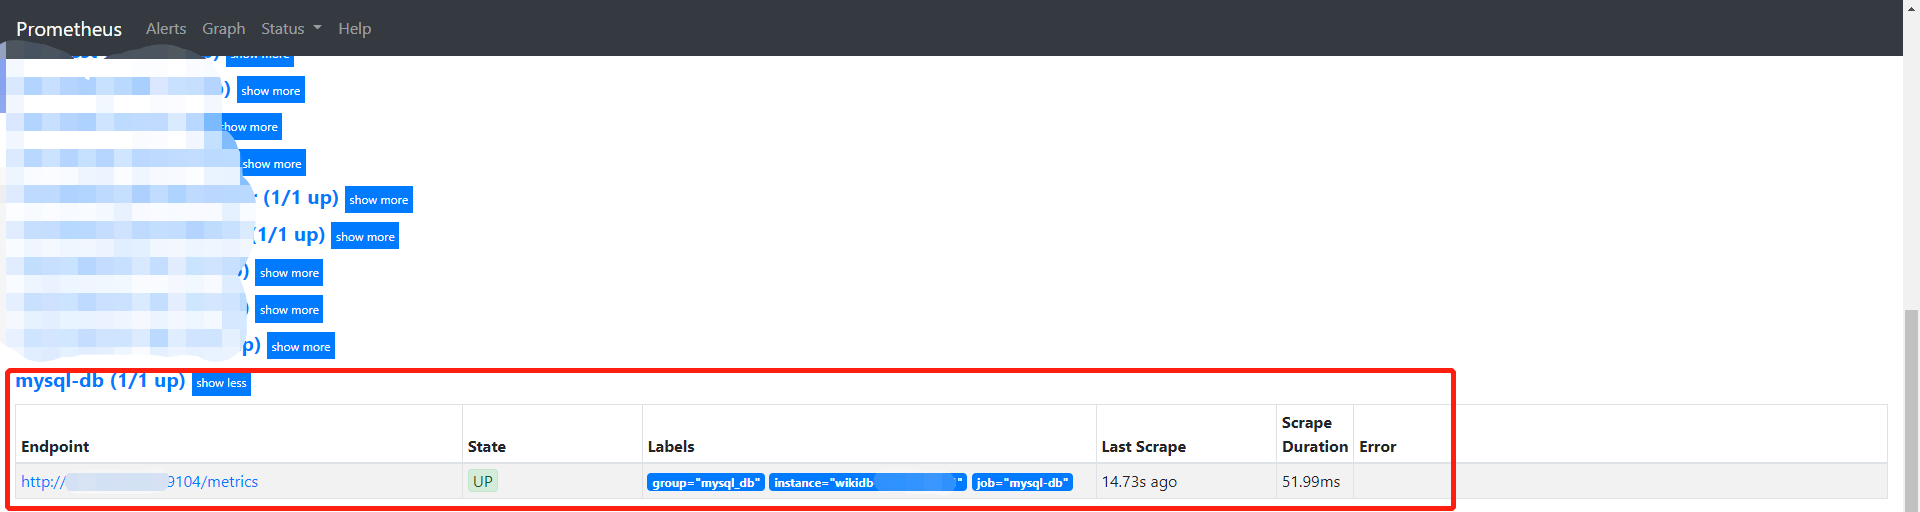
instance: wikidb-10.88.8.120在Prometheus界面可以看到mysql相关指标
5. 在Grafana中添加MySQL监控图表
打开Grafana监控界面,新增MySQL监控图表

在弹出界面中输入:7362
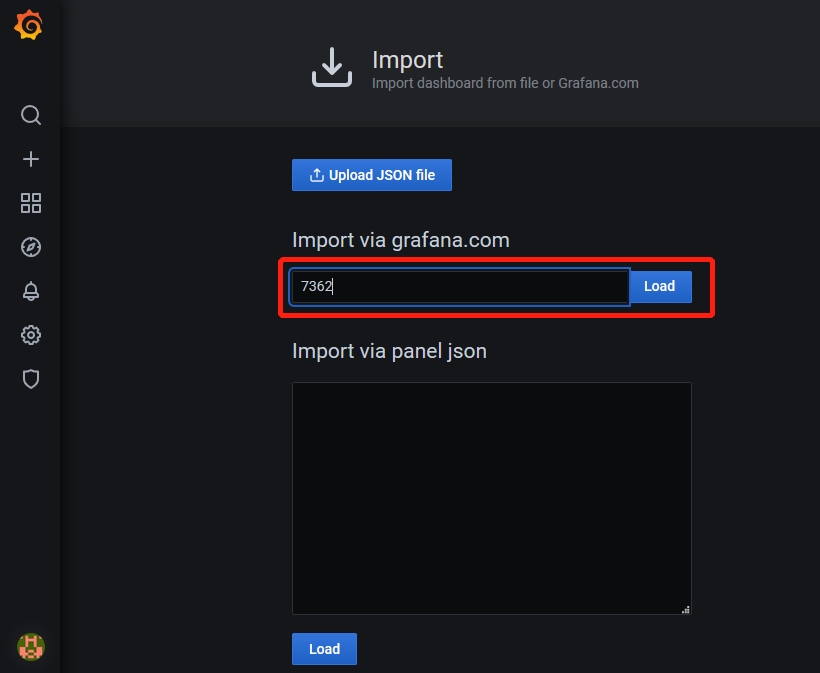
然后点击Load,在新界面中,选择数据源,然后导入即可。

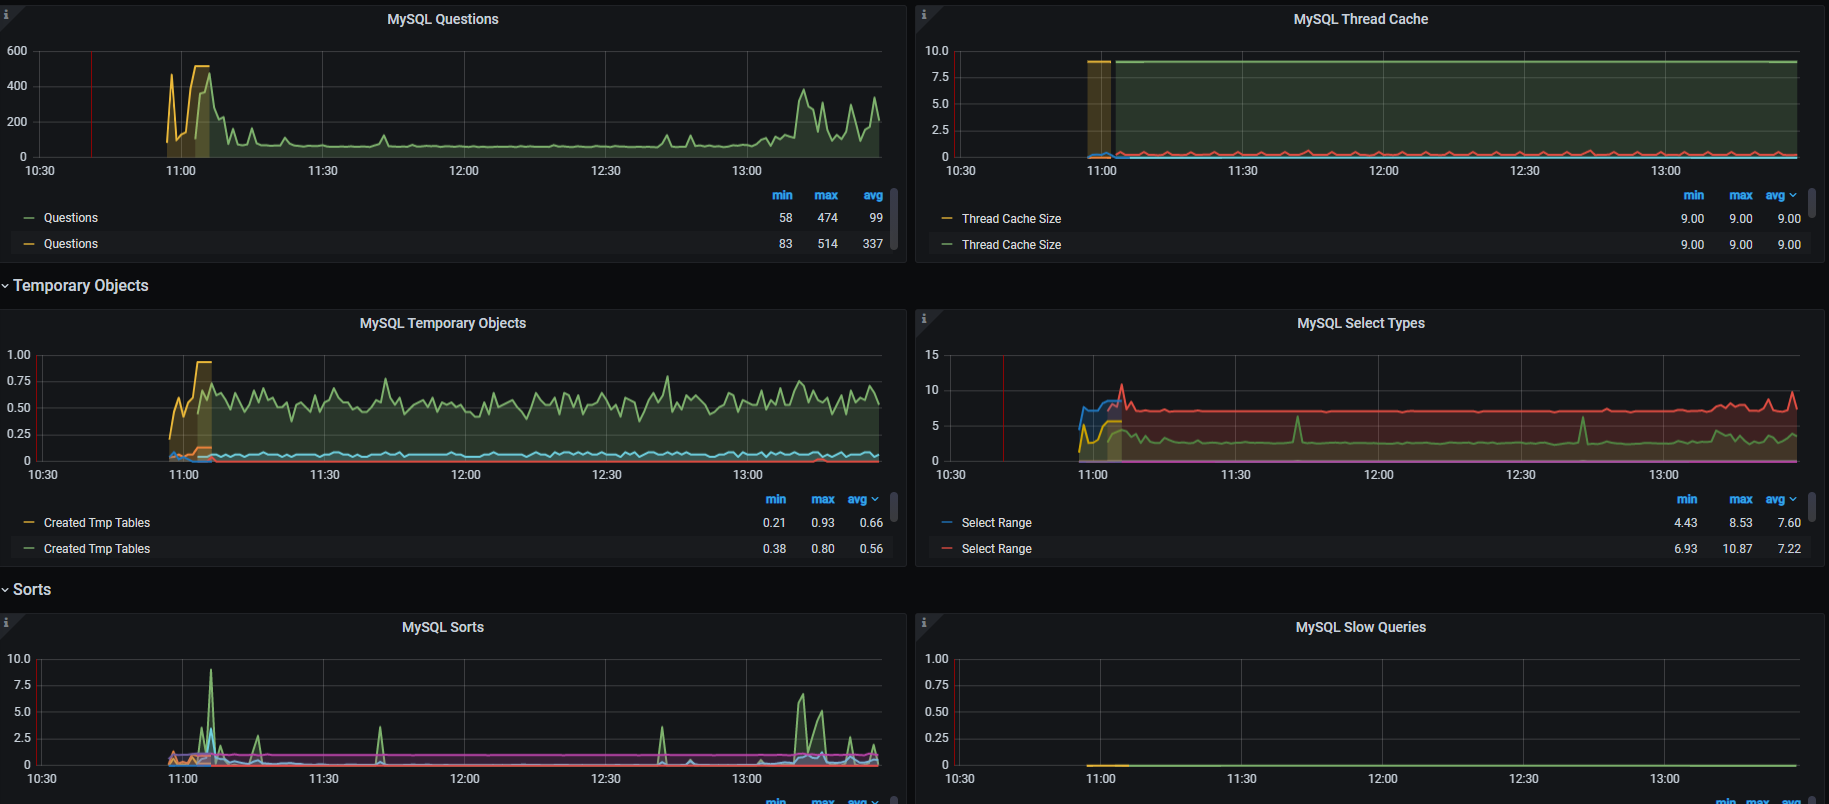
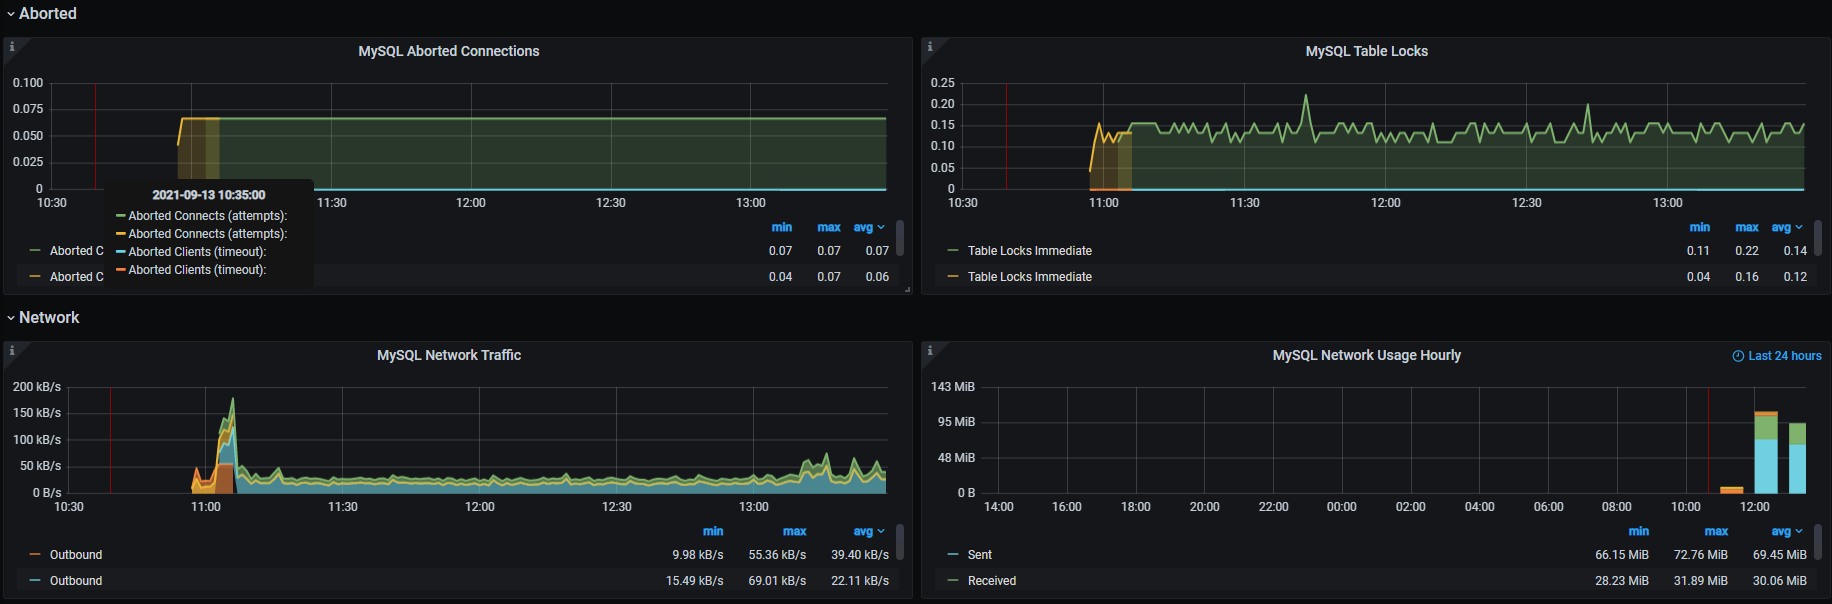
之后就能够在grafana中看到采集到的MySQL数据库的相关参数,以及操作系统参数(附上一些监控图供大家观赏 :) 。


6. Prometheus监控MySQL数据库配置优化
按照上面5个步骤配置出来MySQL的监控完全没有问题。但是,如果你的MySQL数据库很多,采取上述的配置,将所有的MySQL监控配置都写到Prometheus的主配置文件prometheus.yaml里面,主配置文件就显得过于冗长了,下面是优化后的配置,分为三部分:
- 1)Prometheus主配置文件配置;
- 2)MySQL数据库配置文件;
- 3)MySQL数据库所在主机配置文件;
6.1 Prometheus主配置文件
############## MySQL Monitor ###############
  - job_name: 'mysql-host'
    file_sd_configs:
      - files: ['/opt/prometheus-server/sd_cfg/mysql-host.yaml']
        refresh_interval: 5s

  - job_name: 'mysql-db'
    file_sd_configs:
      - files: ['/opt/prometheus-server/sd_cfg/mysql-db.yaml']
        refresh_interval: 5s
6.2 MySQL数据库配置文件
# cat sd_cfg/mysql-host.yaml
- targets: ['10.88.8.120:9104']
  labels:
    instance: wikidb-10.88.8.120
    group: mysql_db
6.3 MySQL所在主机监控配置文件
# cat sd_cfg/mysql-db.yaml
- targets: ['10.88.8.120:9100']
  labels:
    instance: wikidb-10.88.8.120
    hostname: "cn-wiki"
这样拆分后,之后还要监控MySQL其他的服务器和实例,就只需要修改sd_cfg下面的这两个配置文件(mysql-host.yaml和mysql-db.yaml)即可,只需要以葫芦画瓢,拷贝一份现有的,改吧改吧就可以了。
6.4 配置注意事项
在MySQL数据库监控配置文件mysql-db.yaml中的instance标签,要和MySQL数据库所在主机的配置文件mysql-host.yaml中的instance标签名称一致,否则在Grafana里面的MySQL-Dashboard里面的关于主机的监控信息就会看不到(这个模板做的比较好的就是将数据库和主机的监控信息进行了整合,在一个Dashboard里面可以看到所有信息)。当然,如果你觉得没必要,那就另当别论了。
7. MySQL相关指标的告警规则
下面是官方推荐的MySQL相关的告警规则,供大家参考使用。
点击查看代码
###
# Sample prometheus rules/alerts for mysqld.
#
# NOTE: Please review these carefully as thresholds and behavior may not meet
#       your SLOs or labels.
#

###
# Recording Rules

# Record slave lag seconds for pre-computed timeseries that takes
# `mysql_slave_status_sql_delay` into account
mysql_slave_lag_seconds = mysql_slave_status_seconds_behind_master - mysql_slave_status_sql_delay

# Record slave lag via heartbeat method
mysql_heartbeat_lag_seconds = mysql_heartbeat_now_timestamp_seconds - mysql_heartbeat_stored_timestamp_seconds

# Record "Transactions per second"
# See: https://dev.mysql.com/doc/refman/5.7/en/glossary.html#glos_transaction
job:mysql_transactions:rate5m = sum(rate(mysql_global_status_commands_total{command=~"(commit|rollback)"}[5m])) without (command)

###
# Galera Alerts

groups:
- name: GaleraAlerts
  rules:
  - alert: MySQLGaleraNotReady
    expr: mysql_global_status_wsrep_ready != 1
    for: 5m
    labels:
      severity: warning
    annotations:
      description: '{{$labels.job}} on {{$labels.instance}} is not ready.'
      summary: Galera cluster node not ready
  - alert: MySQLGaleraOutOfSync
    expr: (mysql_global_status_wsrep_local_state != 4 and mysql_global_variables_wsrep_desync
      == 0)
    for: 5m
    labels:
      severity: warning
    annotations:
      description: '{{$labels.job}} on {{$labels.instance}} is not in sync ({{$value}}
        != 4).'
      summary: Galera cluster node out of sync
  - alert: MySQLGaleraDonorFallingBehind
    expr: (mysql_global_status_wsrep_local_state == 2 and mysql_global_status_wsrep_local_recv_queue
      > 100)
    for: 5m
    labels:
      severity: warning
    annotations:
      description: '{{$labels.job}} on {{$labels.instance}} is a donor (hotbackup)
        and is falling behind (queue size {{$value}}).'
      summary: xtradb cluster donor node falling behind
  - alert: MySQLReplicationNotRunning
    expr: mysql_slave_status_slave_io_running == 0 or mysql_slave_status_slave_sql_running
      == 0
    for: 2m
    labels:
      severity: critical
    annotations:
      description: Slave replication (IO or SQL) has been down for more than 2 minutes.
      summary: Slave replication is not running
  - alert: MySQLReplicationLag
    expr: (mysql_slave_lag_seconds > 30) and on(instance) (predict_linear(mysql_slave_lag_seconds[5m],
      60 * 2) > 0)
    for: 1m
    labels:
      severity: critical
    annotations:
      description: The mysql slave replication has fallen behind and is not recovering
      summary: MySQL slave replication is lagging
  - alert: MySQLReplicationLag
    expr: (mysql_heartbeat_lag_seconds > 30) and on(instance) (predict_linear(mysql_heartbeat_lag_seconds[5m],
      60 * 2) > 0)
    for: 1m
    labels:
      severity: critical
    annotations:
      description: The mysql slave replication has fallen behind and is not recovering
      summary: MySQL slave replication is lagging
  - alert: MySQLInnoDBLogWaits
    expr: rate(mysql_global_status_innodb_log_waits[15m]) > 10
    labels:
      severity: warning
    annotations:
      description: The innodb logs are waiting for disk at a rate of {{$value}} /
        second
      summary: MySQL innodb log writes stalling
Grafana官网提供的关于Linux和MySQL的展示看板被我略为做了调整,代码如下:(使用方法:将代码保存到json文件里面,导入到grafana看板就可以了)
MySQL-dashboard
点击查看代码
{
"annotations": {
"list": [
{
"builtIn": 1,
"datasource": "-- Grafana --",
"enable": true,
"hide": false,
"iconColor": "#e0752d",
"limit": 100,
"name": "PMM Annotations",
"showIn": 0,
"tags": [
"pmm_annotation"
],
"type": "tags"
}
]
},
"description": "Dashboard from Percona Monitoring and Management project. ",
"editable": true,
"gnetId": 7362,
"graphTooltip": 1,
"id": 11,
"iteration": 1631509635076,
"links": [
{
"icon": "dashboard",
"includeVars": true,
"keepTime": true,
"tags": [
"QAN"
],
"targetBlank": false,
"title": "Query Analytics",
"type": "link",
"url": "/graph/dashboard/db/_pmm-query-analytics"
},
{
"asDropdown": true,
"includeVars": true,
"keepTime": true,
"tags": [
"OS"
],
"targetBlank": false,
"title": "OS",
"type": "dashboards"
},
{
"asDropdown": true,
"includeVars": true,
"keepTime": true,
"tags": [
"MySQL"
],
"targetBlank": false,
"title": "MySQL",
"type": "dashboards"
},
{
"asDropdown": true,
"includeVars": true,
"keepTime": true,
"tags": [
"MongoDB"
],
"targetBlank": false,
"title": "MongoDB",
"type": "dashboards"
},
{
"asDropdown": true,
"includeVars": true,
"keepTime": true,
"tags": [
"HA"
],
"targetBlank": false,
"title": "HA",
"type": "dashboards"
},
{
"asDropdown": true,
"includeVars": true,
"keepTime": true,
"tags": [
"Cloud"
],
"targetBlank": false,
"title": "Cloud",
"type": "dashboards"
},
{
"asDropdown": true,
"includeVars": true,
"keepTime": true,
"tags": [
"Insight"
],
"targetBlank": false,
"title": "Insight",
"type": "dashboards"
},
{
"asDropdown": true,
"includeVars": true,
"keepTime": true,
"tags": [
"PMM"
],
"targetBlank": false,
"title": "PMM",
"type": "dashboards"
}
],
"panels": [
{
"collapsed": false,
"datasource": null,
"gridPos": {
"h": 1,
"w": 24,
"x": 0,
"y": 0
},
"id": 382,
"panels": [],
"repeat": null,
"title": "",
"type": "row"
},
{
"cacheTimeout": null,
"colorBackground": false,
"colorValue": true,
"colors": [
"rgba(245, 54, 54, 0.9)",
"rgba(237, 129, 40, 0.89)",
"rgba(50, 172, 45, 0.97)"
],
"datasource": "Prometheus",
"decimals": 1,
"description": "**MySQL Uptime**
The amount of time since the last restart of the MySQL server process.",
"editable": true,
"error": false,
"fieldConfig": {
"defaults": {
"custom": {}
},
"overrides": []
},
"format": "s",
"gauge": {
"maxValue": 100,
"minValue": 0,
"show": false,
"thresholdLabels": false,
"thresholdMarkers": true
},
"gridPos": {
"h": 4,
"w": 6,
"x": 0,
"y": 1
},
"height": "125px",
"id": 12,
"interval": "$interval",
"links": [],
"mappingType": 1,
"mappingTypes": [
{
"name": "value to text",
"value": 1
},
{
"name": "range to text",
"value": 2
}
],
"maxDataPoints": 100,
"nullPointMode": "connected",
"nullText": null,
"postfix": "s",
"postfixFontSize": "80%",
"prefix": "",
"prefixFontSize": "80%",
"rangeMaps": [
{
"from": "null",
"text": "N/A",
"to": "null"
}
],
"sparkline": {
"fillColor": "rgba(31, 118, 189, 0.18)",
"full": false,
"lineColor": "rgb(31, 120, 193)",
"show": false
},
"tableColumn": "mysql_global_status_uptime{group="mysql_db", instance="wikidb-10.137.10.231", job="mysql-db"}",
"targets": [
{
"calculatedInterval": "10m",
"datasourceErrors": {},
"errors": {},
"expr": "mysql_global_status_uptime{instance="$host"}",
"format": "time_series",
"hide": false,
"instant": true,
"interval": "5m",
"intervalFactor": 1,
"legendFormat": "",
"metric": "",
"refId": "A",
"step": 300
}
],
"thresholds": "300,3600",
"title": "MySQL Uptime",
"type": "singlestat",
"valueFontSize": "80%",
"valueMaps": [],
"valueName": "current"
},
{
"cacheTimeout": null,
"colorBackground": false,
"colorValue": false,
"colors": [
"rgba(245, 54, 54, 0.9)",
"rgba(237, 129, 40, 0.89)",
"rgba(50, 172, 45, 0.97)"
],
"datasource": "Prometheus",
"decimals": 2,
"description": "**Current QPS**
Based on the queries reported by MySQL's ``SHOW STATUS`` command, it is the number of statements executed by the server within the last second. This variable includes statements executed within stored programs, unlike the Questions variable. It does not count
``COM_PING`` or ``COM_STATISTICS`` commands.",
"editable": true,
"error": false,
"fieldConfig": {
"defaults": {
"custom": {}
},
"overrides": []
},
"format": "short",
"gauge": {
"maxValue": 100,
"minValue": 0,
"show": false,
"thresholdLabels": false,
"thresholdMarkers": true
},
"gridPos": {
"h": 4,
"w": 6,
"x": 6,
"y": 1
},
"height": "125px",
"id": 13,
"interval": "$interval",
"links": [
{
"targetBlank": true,
"title": "MySQL Server Status Variables",
"url": "https://dev.mysql.com/doc/refman/5.7/en/server-status-variables.html#statvar_Queries"
}
],
"mappingType": 1,
"mappingTypes": [
{
"name": "value to text",
"value": 1
},
{
"name": "range to text",
"value": 2
}
],
"maxDataPoints": 100,
"nullPointMode": "connected",
"nullText": null,
"postfix": "",
"postfixFontSize": "50%",
"prefix": "",
"prefixFontSize": "80%",
"rangeMaps": [
{
"from": "null",
"text": "N/A",
"to": "null"
}
],
"sparkline": {
"fillColor": "rgba(31, 118, 189, 0.18)",
"full": false,
"lineColor": "rgb(31, 120, 193)",
"show": true
},
"tableColumn": "{group="mysql_db", instance="wikidb-10.137.10.231", job="mysql-db"}",
"targets": [
{
"calculatedInterval": "10m",
"datasourceErrors": {},
"errors": {},
"expr": "rate(mysql_global_status_queries{instance="$host"}[$interval]) or irate(mysql_global_status_queries{instance="$host"}[5m])",
"format": "time_series",
"instant": true,
"interval": "$interval",
"intervalFactor": 1,
"legendFormat": "",
"metric": "",
"refId": "A",
"step": 20
}
],
"thresholds": "35,75",
"title": "Current QPS",
"type": "singlestat",
"valueFontSize": "80%",
"valueMaps": [],
"valueName": "current"
},
{
"cacheTimeout": null,
"colorBackground": false,
"colorValue": false,
"colors": [
"rgba(50, 172, 45, 0.97)",
"rgba(237, 129, 40, 0.89)",
"rgba(245, 54, 54, 0.9)"
],
"datasource": "Prometheus",
"decimals": 0,
"description": "**InnoDB Buffer Pool Size**
InnoDB maintains a storage area called the buffer pool for caching data and indexes in memory. Knowing how the InnoDB buffer pool works, and taking advantage of it to keep frequently accessed data in memory, is one of the most important aspects of MySQL tuning. The goal is to keep the working set in memory. In most cases, this should be between 60%-90% of available memory on a dedicated database host, but depends on many factors.",
"editable": true,
"error": false,
"fieldConfig": {
"defaults": {
"custom": {}
},
"overrides": []
},
"format": "bytes",
"gauge": {
"maxValue": 100,
"minValue": 0,
"show": false,
"thresholdLabels": false,
"thresholdMarkers": true
},
"gridPos": {
"h": 4,
"w": 6,
"x": 12,
"y": 1
},
"height": "125px",
"id": 51,
"interval": "$interval",
"links": [
{
"targetBlank": true,
"title": "Tuning the InnoDB Buffer Pool Size",
"url": "https://www.percona.com/blog/2015/06/02/80-ram-tune-innodb_buffer_pool_size/"
}
],
"mappingType": 1,
"mappingTypes": [
{
"name": "value to text",
"value": 1
},
{
"name": "range to text",
"value": 2
}
],
"maxDataPoints": 100,
"nullPointMode": "connected",
"nullText": null,
"postfix": "",
"postfixFontSize": "50%",
"prefix": "",
"prefixFontSize": "80%",
"rangeMaps": [
{
"from": "null",
"text": "N/A",
"to": "null"
}
],
"sparkline": {
"fillColor": "rgba(31, 118, 189, 0.18)",
"full": false,
"lineColor": "rgb(31, 120, 193)",
"show": false
},
"tableColumn": "mysql_global_variables_innodb_buffer_pool_size{group="mysql_db", instance="wikidb-10.137.10.231", job="mysql-db"}",
"targets": [
{
"calculatedInterval": "10m",
"datasourceErrors": {},
"errors": {},
"expr": "mysql_global_variables_innodb_buffer_pool_size{instance="$host"}",
"format": "time_series",
"instant": true,
"interval": "5m",
"intervalFactor": 1,
"legendFormat": "",
"metric": "",
"refId": "A",
"step": 300
}
],
"thresholds": "90,95",
"title": "InnoDB Buffer Pool Size",
"type": "singlestat",
"valueFontSize": "80%",
"valueMaps": [],
"valueName": "current"
},
{
"cacheTimeout": null,
"colorBackground": false,
"colorValue": true,
"colors": [
"rgba(245, 54, 54, 0.9)",
"rgba(237, 129, 40, 0.89)",
"rgba(50, 172, 45, 0.97)"
],
"datasource": "Prometheus",
"decimals": 0,
"description": "**InnoDB Buffer Pool Size % of Total RAM**
InnoDB maintains a storage area called the buffer pool for caching data and indexes in memory. Knowing how the InnoDB buffer pool works, and taking advantage of it to keep frequently accessed data in memory, is one of the most important aspects of MySQL tuning. The goal is to keep the working set in memory. In most cases, this should be between 60%-90% of available memory on a dedicated database host, but depends on many factors.",
"editable": true,
"error": false,
"fieldConfig": {
"defaults": {
"custom": {}
},
"overrides": []
},
"format": "percent",
"gauge": {
"maxValue": 100,
"minValue": 0,
"show": false,
"thresholdLabels": false,
"thresholdMarkers": true
},
"gridPos": {
"h": 4,
"w": 6,
"x": 18,
"y": 1
},
"height": "125px",
"id": 52,
"interval": "$interval",
"links": [
{
"targetBlank": true,
"title": "Tuning the InnoDB Buffer Pool Size",
"url": "https://www.percona.com/blog/2015/06/02/80-ram-tune-innodb_buffer_pool_size/"
}
],
"mappingType": 1,
"mappingTypes": [
{
"name": "value to text",
"value": 1
},
{
"name": "range to text",
"value": 2
}
],
"maxDataPoints": 100,
"nullPointMode": "connected",
"nullText": null,
"postfix": "",
"postfixFontSize": "50%",
"prefix": "",
"prefixFontSize": "80%",
"rangeMaps": [
{
"from": "null",
"text": "N/A",
"to": "null"
}
],
"repeat": null,
"sparkline": {
"fillColor": "rgba(31, 118, 189, 0.18)",
"full": false,
"lineColor": "rgb(31, 120, 193)",
"maxValue": 100,
"minValue": 0,
"show": true
},
"tableColumn": "{instance="10.137.8.193:9100"}",
"targets": [
{
"calculatedInterval": "10m",
"datasourceErrors": {},
"errors": {},
"expr": "(mysql_global_variables_innodb_buffer_pool_size{instance="$host"} * 100) / on (instance) node_memory_MemTotal_bytes{instance="$host",group="mysql"}",
"format": "time_series",
"instant": true,
"interval": "5m",
"intervalFactor": 1,
"legendFormat": "",
"metric": "",
"refId": "A",
"step": 300
}
],
"thresholds": "40,80",
"title": "Buffer Pool Size of Total RAM",
"type": "singlestat",
"valueFontSize": "80%",
"valueMaps": [],
"valueName": "current"
},
{
"collapsed": true,
"datasource": null,
"gridPos": {
"h": 1,
"w": 24,
"x": 0,
"y": 5
},
"id": 383,
"panels": [
{
"aliasColors": {},
"bars": false,
"dashLength": 10,
"dashes": false,
"datasource": "Prometheus",
"decimals": 0,
"description": "**Max Connections**
Max Connections is the maximum permitted number of simultaneous client connections. By default, this is 151. Increasing this value increases the number of file descriptors that mysqld requires. If the required number of descriptors are not available, the server reduces the value of Max Connections.
mysqld actually permits Max Connections + 1 clients to connect. The extra connection is reserved for use by accounts that have the SUPER privilege, such as root.
Max Used Connections is the maximum number of connections that have been in use simultaneously since the server started.
Connections is the number of connection attempts (successful or not) to the MySQL server.",
"editable": true,
"error": false,
"fieldConfig": {
"defaults": {
"custom": {}
},
"overrides": []
},
"fill": 2,
"fillGradient": 0,
"grid": {},
"gridPos": {
"h": 7,
"w": 12,
"x": 0,
"y": 6
},
"height": "250px",
"hiddenSeries": false,
"id": 92,
"legend": {
"alignAsTable": true,
"avg": true,
"current": false,
"max": true,
"min": true,
"show": true,
"sort": "avg",
"sortDesc": true,
"total": false,
"values": true
},
"lines": true,
"linewidth": 2,
"links": [
{
"targetBlank": true,
"title": "MySQL Server System Variables",
"url": "https://dev.mysql.com/doc/refman/5.7/en/server-system-variables.html#sysvar_max_connections"
}
],
"nullPointMode": "null",
"percentage": false,
"pluginVersion": "7.1.5",
"pointradius": 5,
"points": false,
"renderer": "flot",
"seriesOverrides": [
{
"alias": "Max Connections",
"fill": 0
}
],
"spaceLength": 10,
"stack": false,
"steppedLine": false,
"targets": [
{
"calculatedInterval": "2m",
"datasourceErrors": {},
"errors": {},
"expr": "max(max_over_time(mysql_global_status_threads_connected{instance="$host"}[$interval]) or mysql_global_status_threads_connected{instance="$host"} )",
"format": "time_series",
"interval": "$interval",
"intervalFactor": 1,
"legendFormat": "Connections",
"metric": "",
"refId": "A",
"step": 20
},
{
"calculatedInterval": "2m",
"datasourceErrors": {},
"errors": {},
"expr": "mysql_global_status_max_used_connections{instance="$host"}",
"format": "time_series",
"interval": "$interval",
"intervalFactor": 1,
"legendFormat": "Max Used Connections",
"metric": "",
"refId": "C",
"step": 20,
"target": ""
},
{
"calculatedInterval": "2m",
"datasourceErrors": {},
"errors": {},
"expr": "mysql_global_variables_max_connections{instance="$host"}",
"format": "time_series",
"interval": "$interval",
"intervalFactor": 1,
"legendFormat": "Max Connections",
"metric": "",
"refId": "B",
"step": 20,
"target": ""
}
],
"thresholds": [],
"timeFrom": null,
"timeRegions": [],
"timeShift": null,
"title": "MySQL Connections",
"tooltip": {
"msResolution": false,
"shared": true,
"sort": 0,
"value_type": "cumulative"
},
"type": "graph",
"xaxis": {
"buckets": null,
"mode": "time",
"name": null,
"show": true,
"values": []
},
"yaxes": [
{
"format": "short",
"label": "",
"logBase": 1,
"max": null,
"min": 0,
"show": true
},
{
"format": "short",
"label": "",
"logBase": 1,
"max": null,
"min": 0,
"show": true
}
],
"yaxis": {
"align": false,
"alignLevel": null
}
},
{
"aliasColors": {},
"bars": false,
"dashLength": 10,
"dashes": false,
"datasource": "Prometheus",
"decimals": 2,
"description": "**MySQL Active Threads**
Threads Connected is the number of open connections, while Threads Running is the number of threads not sleeping.",
"editable": true,
"error": false,
"fieldConfig": {
"defaults": {
"custom": {}
},
"overrides": []
},
"fill": 2,
"fillGradient": 0,
"grid": {},
"gridPos": {
"h": 7,
"w": 12,
"x": 12,
"y": 6
},
"hiddenSeries": false,
"id": 10,
"legend": {
"alignAsTable": true,
"avg": true,
"current": true,
"max": true,
"min": true,
"rightSide": false,
"show": true,
"sortDesc": true,
"total": false,
"values": true
},
"lines": true,
"linewidth": 2,
"links": [],
"nullPointMode": "null",
"percentage": false,
"pluginVersion": "7.1.5",
"pointradius": 5,
"points": false,
"renderer": "flot",
"seriesOverrides": [
{
"alias": "Peak Threads Running",
"color": "#E24D42",
"lines": false,
"pointradius": 1,
"points": true
},
{
"alias": "Peak Threads Connected",
"color": "#1F78C1"
},
{
"alias": "Avg Threads Running",
"color": "#EAB839"
}
],
"spaceLength": 10,
"stack": false,
"steppedLine": false,
"targets": [
{
"calculatedInterval": "2m",
"datasourceErrors": {},
"errors": {},
"expr": "max_over_time(mysql_global_status_threads_connected{instance="$host"}[$interval]) or
max_over_time(mysql_global_status_threads_connected{instance="$host"}[5m])",
"format": "time_series",
"hide": false,
"interval": "$interval",
"intervalFactor": 1,
"legendFormat": "Peak Threads Connected",
"metric": "",
"refId": "A",
"step": 20
},
{
"calculatedInterval": "2m",
"datasourceErrors": {},
"errors": {},
"expr": "max_over_time(mysql_global_status_threads_running{instance="$host"}[$interval]) or
max_over_time(mysql_global_status_threads_running{instance="$host"}[5m])",
"format": "time_series",
"interval": "$interval",
"intervalFactor": 1,
"legendFormat": "Peak Threads Running",
"metric": "",
"refId": "B",
"step": 20
},
{
"expr": "avg_over_time(mysql_global_status_threads_running{instance="$host"}[$interval]) or
avg_over_time(mysql_global_status_threads_running{instance="$host"}[5m])",
"format": "time_series",
"interval": "$interval",
"intervalFactor": 1,
"legendFormat": "Avg Threads Running",
"refId": "C",
"step": 20
}
],
"thresholds": [],
"timeFrom": null,
"timeRegions": [],
"timeShift": null,
"title": "MySQL Client Thread Activity",
"tooltip": {
"msResolution": false,
"shared": true,
"sort": 0,
"value_type": "individual"
},
"type": "graph",
"xaxis": {
"buckets": null,
"mode": "time",
"name": null,
"show": true,
"values": [
"total"
]
},
"yaxes": [
{
"format": "short",
"label": "Threads",
"logBase": 1,
"max": null,
"min": 0,
"show": true
},
{
"format": "short",
"label": "",
"logBase": 1,
"max": null,
"min": 0,
"show": false
}
],
"yaxis": {
"align": false,
"alignLevel": null
}
}
],
"repeat": null,
"title": "Connections",
"type": "row"
},
{
"collapsed": true,
"datasource": null,
"gridPos": {
"h": 1,
"w": 24,
"x": 0,
"y": 6
},
"id": 384,
"panels": [
{
"aliasColors": {},
"bars": false,
"dashLength": 10,
"dashes": false,
"datasource": "Prometheus",
"decimals": null,
"description": "**MySQL Questions**
The number of statements executed by the server. This includes only statements sent to the server by clients and not statements executed within stored programs, unlike the Queries used in the QPS calculation.
This variable does not count the following commands:
* ``COM_PING``
* ``COM_STATISTICS``
* ``COM_STMT_PREPARE``
* ``COM_STMT_CLOSE``
* ``COM_STMT_RESET``",
"editable": true,
"error": false,
"fieldConfig": {
"defaults": {
"custom": {}
},
"overrides": []
},
"fill": 2,
"fillGradient": 0,
"grid": {},
"gridPos": {
"h": 7,
"w": 12,
"x": 0,
"y": 7
},
"hiddenSeries": false,
"id": 53,
"legend": {
"alignAsTable": true,
"avg": true,
"current": false,
"max": true,
"min": true,
"rightSide": false,
"show": true,
"total": false,
"values": true
},
"lines": true,
"linewidth": 2,
"links": [
{
"targetBlank": true,
"title": "MySQL Queries and Questions",
"url": "https://www.percona.com/blog/2014/05/29/how-mysql-queries-and-questions-are-measured/"
}
],
"nullPointMode": "null",
"percentage": false,
"pluginVersion": "7.1.5",
"pointradius": 5,
"points": false,
"renderer": "flot",
"seriesOverrides": [],
"spaceLength": 10,
"stack": false,
"steppedLine": false,
"targets": [
{
"calculatedInterval": "2m",
"datasourceErrors": {},
"errors": {},
"expr": "rate(mysql_global_status_questions{instance="$host"}[$interval]) or irate(mysql_global_status_questions{instance="$host"}[5m])",
"format": "time_series",
"interval": "$interval",
"intervalFactor": 1,
"legendFormat": "Questions",
"metric": "",
"refId": "A",
"step": 20
}
],
"thresholds": [],
"timeFrom": null,
"timeRegions": [],
"timeShift": null,
"title": "MySQL Questions",
"tooltip": {
"msResolution": false,
"shared": true,
"sort": 0,
"value_type": "individual"
},
"type": "graph",
"xaxis": {
"buckets": null,
"mode": "time",
"name": null,
"show": true,
"values": []
},
"yaxes": [
{
"format": "short",
"logBase": 1,
"max": null,
"min": 0,
"show": true
},
{
"format": "short",
"logBase": 1,
"max": null,
"min": 0,
"show": true
}
],
"yaxis": {
"align": false,
"alignLevel": null
}
},
{
"aliasColors": {},
"bars": false,
"dashLength": 10,
"dashes": false,
"datasource": "Prometheus",
"decimals": 2,
"description": "**MySQL Thread Cache**
The thread_cache_size variable sets how many threads the server should cache to reuse. When a client disconnects, the client's threads are put in the cache if the cache is not full. It is autosized in MySQL 5.6.8 and above (capped to 100). Requests for threads are satisfied by reusing threads taken from the cache if possible, and only when the cache is empty is a new thread created.
* *Threads_created*: The number of threads created to handle connections.
* *Threads_cached*: The number of threads in the thread cache.",
"editable": true,
"error": false,
"fieldConfig": {
"defaults": {
"custom": {}
},
"overrides": []
},
"fill": 2,
"fillGradient": 0,
"grid": {},
"gridPos": {
"h": 7,
"w": 12,
"x": 12,
"y": 7
},
"hiddenSeries": false,
"id": 11,
"legend": {
"alignAsTable": true,
"avg": true,
"current": false,
"max": true,
"min": true,
"rightSide": false,
"show": true,
"sort": "avg",
"sortDesc": true,
"total": false,
"values": true
},
"lines": true,
"linewidth": 2,
"links": [
{
"title": "Tuning information",
"url": "https://dev.mysql.com/doc/refman/5.6/en/server-system-variables.html#sysvar_thread_cache_size"
}
],
"nullPointMode": "null",
"percentage": false,
"pluginVersion": "7.1.5",
"pointradius": 5,
"points": false,
"renderer": "flot",
"seriesOverrides": [
{
"alias": "Threads Created",
"fill": 0
}
],
"spaceLength": 10,
"stack": false,
"steppedLine": false,
"targets": [
{
"calculatedInterval": "2m",
"datasourceErrors": {},
"errors": {},
"expr": "mysql_global_variables_thread_cache_size{instance="$host"}",
"format": "time_series",
"interval": "$interval",
"intervalFactor": 1,
"legendFormat": "Thread Cache Size",
"metric": "",
"refId": "B",
"step": 20
},
{
"calculatedInterval": "2m",
"datasourceErrors": {},
"errors": {},
"expr": "mysql_global_status_threads_cached{instance="$host"}",
"format": "time_series",
"interval": "$interval",
"intervalFactor": 1,
"legendFormat": "Threads Cached",
"metric": "",
"refId": "C",
"step": 20
},
{
"calculatedInterval": "2m",
"datasourceErrors": {},
"errors": {},
"expr": "rate(mysql_global_status_threads_created{instance="$host"}[$interval]) or irate(mysql_global_status_threads_created{instance="$host"}[5m])",
"format": "time_series",
"interval": "$interval",
"intervalFactor": 1,
"legendFormat": "Threads Created",
"metric": "",
"refId": "A",
"step": 20
}
],
"thresholds": [],
"timeFrom": null,
"timeRegions": [],
"timeShift": null,
"title": "MySQL Thread Cache",
"tooltip": {
"msResolution": false,
"shared": true,
"sort": 0,
"value_type": "individual"
},
"type": "graph",
"xaxis": {
"buckets": null,
"mode": "time",
"name": null,
"show": true,
"values": []
},
"yaxes": [
{
"format": "short",
"logBase": 1,
"max": null,
"min": 0,
"show": true
},
{
"format": "short",
"logBase": 1,
"max": null,
"min": 0,
"show": true
}
],
"yaxis": {
"align": false,
"alignLevel": null
}
}
],
"repeat": null,
"title": "Table Locks",
"type": "row"
},
{
"collapsed": true,
"datasource": null,
"gridPos": {
"h": 1,
"w": 24,
"x": 0,
"y": 7
},
"id": 385,
"panels": [
{
"aliasColors": {},
"bars": false,
"dashLength": 10,
"dashes": false,
"datasource": "Prometheus",
"decimals": 2,
"editable": true,
"error": false,
"fieldConfig": {
"defaults": {
"custom": {}
},
"overrides": []
},
"fill": 2,
"fillGradient": 0,
"grid": {},
"gridPos": {
"h": 7,
"w": 12,
"x": 0,
"y": 8
},
"hiddenSeries": false,
"id": 22,
"legend": {
"alignAsTable": true,
"avg": true,
"current": false,
"max": true,
"min": true,
"rightSide": false,
"show": true,
"sort": "avg",
"sortDesc": true,
"total": false,
"values": true
},
"lines": true,
"linewidth": 2,
"links": [],
"nullPointMode": "null",
"percentage": false,
"pluginVersion": "7.1.5",
"pointradius": 5,
"points": false,
"renderer": "flot",
"seriesOverrides": [],
"spaceLength": 10,
"stack": false,
"steppedLine": false,
"targets": [
{
"calculatedInterval": "2m",
"datasourceErrors": {},
"errors": {},
"expr": "rate(mysql_global_status_created_tmp_tables{instance="$host"}[$interval]) or irate(mysql_global_status_created_tmp_tables{instance="$host"}[5m])",
"interval": "$interval",
"intervalFactor": 1,
"legendFormat": "Created Tmp Tables",
"metric": "",
"refId": "A",
"step": 20
},
{
"calculatedInterval": "2m",
"datasourceErrors": {},
"errors": {},
"expr": "rate(mysql_global_status_created_tmp_disk_tables{instance="$host"}[$interval]) or irate(mysql_global_status_created_tmp_disk_tables{instance="$host"}[5m])",
"interval": "$interval",
"intervalFactor": 1,
"legendFormat": "Created Tmp Disk Tables",
"metric": "",
"refId": "B",
"step": 20
},
{
"calculatedInterval": "2m",
"datasourceErrors": {},
"errors": {},
"expr": "rate(mysql_global_status_created_tmp_files{instance="$host"}[$interval]) or irate(mysql_global_status_created_tmp_files{instance="$host"}[5m])",
"interval": "$interval",
"intervalFactor": 1,
"legendFormat": "Created Tmp Files",
"metric": "",
"refId": "C",
"step": 20
}
],
"thresholds": [],
"timeFrom": null,
"timeRegions": [],
"timeShift": null,
"title": "MySQL Temporary Objects",
"tooltip": {
"msResolution": false,
"shared": true,
"sort": 0,
"value_type": "individual"
},
"type": "graph",
"xaxis": {
"buckets": null,
"mode": "time",
"name": null,
"show": true,
"values": []
},
"yaxes": [
{
"format": "short",
"logBase": 1,
"max": null,
"min": 0,
"show": true
},
{
"format": "short",
"logBase": 1,
"max": null,
"min": 0,
"show": true
}
],
"yaxis": {
"align": false,
"alignLevel": null
}
},
{
"aliasColors": {},
"bars": false,
"dashLength": 10,
"dashes": false,
"datasource": "Prometheus",
"decimals": 2,
"description": "**MySQL Select Types**
As with most relational databases, selecting based on indexes is more efficient than scanning an entire table's data. Here we see the counters for selects not done with indexes.
* ***Select Scan*** is how many queries caused full table scans, in which all the data in the table had to be read and either discarded or returned.
* ***Select Range*** is how many queries used a range scan, which means MySQL scanned all rows in a given range.
* ***Select Full Join*** is the number of joins that are not joined on an index, this is usually a huge performance hit.",
"editable": true,
"error": false,
"fieldConfig": {
"defaults": {
"custom": {}
},
"overrides": []
},
"fill": 2,
"fillGradient": 0,
"grid": {},
"gridPos": {
"h": 7,
"w": 12,
"x": 12,
"y": 8
},
"height": "250px",
"hiddenSeries": false,
"id": 311,
"legend": {
"alignAsTable": true,
"avg": true,
"current": false,
"hideZero": true,
"max": true,
"min": true,
"rightSide": false,
"show": true,
"sort": "avg",
"sortDesc": true,
"total": false,
"values": true
},
"lines": true,
"linewidth": 2,
"links": [],
"nullPointMode": "null",
"percentage": false,
"pluginVersion": "7.1.5",
"pointradius": 5,
"points": false,
"renderer": "flot",
"seriesOverrides": [],
"spaceLength": 10,
"stack": false,
"steppedLine": false,
"targets": [
{
"calculatedInterval": "2m",
"datasourceErrors": {},
"errors": {},
"expr": "rate(mysql_global_status_select_full_join{instance="$host"}[$interval]) or irate(mysql_global_status_select_full_join{instance="$host"}[5m])",
"format": "time_series",
"interval": "$interval",
"intervalFactor": 1,
"legendFormat": "Select Full Join",
"metric": "",
"refId": "A",
"step": 20
},
{
"calculatedInterval": "2m",
"datasourceErrors": {},
"errors": {},
"expr": "rate(mysql_global_status_select_full_range_join{instance="$host"}[$interval]) or irate(mysql_global_status_select_full_range_join{instance="$host"}[5m])",
"format": "time_series",
"interval": "$interval",
"intervalFactor": 1,
"legendFormat": "Select Full Range Join",
"metric": "",
"refId": "B",
"step": 20
},
{
"calculatedInterval": "2m",
"datasourceErrors": {},
"errors": {},
"expr": "rate(mysql_global_status_select_range{instance="$host"}[$interval]) or irate(mysql_global_status_select_range{instance="$host"}[5m])",
"format": "time_series",
"interval": "$interval",
"intervalFactor": 1,
"legendFormat": "Select Range",
"metric": "",
"refId": "C",
"step": 20
},
{
"calculatedInterval": "2m",
"datasourceErrors": {},
"errors": {},
"expr": "rate(mysql_global_status_select_range_check{instance="$host"}[$interval]) or irate(mysql_global_status_select_range_check{instance="$host"}[5m])",
"format": "time_series",
"interval": "$interval",
"intervalFactor": 1,
"legendFormat": "Select Range Check",
"metric": "",
"refId": "D",
"step": 20
},
{
"calculatedInterval": "2m",
"datasourceErrors": {},
"errors": {},
"expr": "rate(mysql_global_status_select_scan{instance="$host"}[$interval]) or irate(mysql_global_status_select_scan{instance="$host"}[5m])",
"format": "time_series",
"interval": "$interval",
"intervalFactor": 1,
"legendFormat": "Select Scan",
"metric": "",
"refId": "E",
"step": 20
}
],
"thresholds": [],
"timeFrom": null,
"timeRegions": [],
"timeShift": null,
"title": "MySQL Select Types",
"tooltip": {
"msResolution": false,
"shared": true,
"sort": 0,
"value_type": "individual"
},
"type": "graph",
"xaxis": {
"buckets": null,
"mode": "time",
"name": null,
"show": true,
"values": []
},
"yaxes": [
{
"format": "short",
"logBase": 1,
"max": null,
"min": 0,
"show": true
},
{
"format": "short",
"logBase": 1,
"max": null,
"min": 0,
"show": true
}
],
"yaxis": {
"align": false,
"alignLevel": null
}
}
],
"repeat": null,
"title": "Temporary Objects",
"type": "row"
},
{
"collapsed": true,
"datasource": null,
"gridPos": {
"h": 1,
"w": 24,
"x": 0,
"y": 8
},
"id": 386,
"panels": [
{
"aliasColors": {},
"bars": false,
"dashLength": 10,
"dashes": false,
"datasource": "Prometheus",
"decimals": 2,
"description": "**MySQL Sorts**
Due to a query's structure, order, or other requirements, MySQL sorts the rows before returning them. For example, if a table is ordered 1 to 10 but you want the results reversed, MySQL then has to sort the rows to return 10 to 1.
This graph also shows when sorts had to scan a whole table or a given range of a table in order to return the results and which could not have been sorted via an index.",
"editable": true,
"error": false,
"fieldConfig": {
"defaults": {
"custom": {}
},
"overrides": []
},
"fill": 2,
"fillGradient": 0,
"grid": {},
"gridPos": {
"h": 7,
"w": 12,
"x": 0,
"y": 9
},
"hiddenSeries": false,
"id": 30,
"legend": {
"alignAsTable": true,
"avg": true,
"current": false,
"hideZero": true,
"max": true,
"min": true,
"rightSide": false,
"show": true,
"sort": "avg",
"sortDesc": true,
"total": false,
"values": true
},
"lines": true,
"linewidth": 2,
"links": [],
"nullPointMode": "null",
"percentage": false,
"pluginVersion": "7.1.5",
"pointradius": 5,
"points": false,
"renderer": "flot",
"seriesOverrides": [],
"spaceLength": 10,
"stack": false,
"steppedLine": false,
"targets": [
{
"calculatedInterval": "2m",
"datasourceErrors": {},
"errors": {},
"expr": "rate(mysql_global_status_sort_rows{instance="$host"}[$interval]) or irate(mysql_global_status_sort_rows{instance="$host"}[5m])",
"format": "time_series",
"interval": "$interval",
"intervalFactor": 1,
"legendFormat": "Sort Rows",
"metric": "",
"refId": "A",
"step": 20
},
{
"calculatedInterval": "2m",
"datasourceErrors": {},
"errors": {},
"expr": "rate(mysql_global_status_sort_range{instance="$host"}[$interval]) or irate(mysql_global_status_sort_range{instance="$host"}[5m])",
"format": "time_series",
"interval": "$interval",
"intervalFactor": 1,
"legendFormat": "Sort Range",
"metric": "",
"refId": "B",
"step": 20
},
{
"calculatedInterval": "2m",
"datasourceErrors": {},
"errors": {},
"expr": "rate(mysql_global_status_sort_merge_passes{instance="$host"}[$interval]) or irate(mysql_global_status_sort_merge_passes{instance="$host"}[5m])",
"format": "time_series",
"interval": "$interval",
"intervalFactor": 1,
"legendFormat": "Sort Merge Passes",
"metric": "",
"refId": "C",
"step": 20
},
{
"calculatedInterval": "2m",
"datasourceErrors": {},
"errors": {},
"expr": "rate(mysql_global_status_sort_scan{instance="$host"}[$interval]) or irate(mysql_global_status_sort_scan{instance="$host"}[5m])",
"format": "time_series",
"interval": "$interval",
"intervalFactor": 1,
"legendFormat": "Sort Scan",
"metric": "",
"refId": "D",
"step": 20
}
],
"thresholds": [],
"timeFrom": null,
"timeRegions": [],
"timeShift": null,
"title": "MySQL Sorts",
"tooltip": {
"msResolution": false,
"shared": true,
"sort": 0,
"value_type": "individual"
},
"type": "graph",
"xaxis": {
"buckets": null,
"mode": "time",
"name": null,
"show": true,
"values": []
},
"yaxes": [
{
"format": "short",
"logBase": 1,
"max": null,
"min": 0,
"show": true
},
{
"format": "short",
"logBase": 1,
"max": null,
"min": 0,
"show": true
}
],
"yaxis": {
"align": false,
"alignLevel": null
}
},
{
"aliasColors": {},
"bars": false,
"dashLength": 10,
"dashes": false,
"datasource": "Prometheus",
"decimals": 2,
"description": "**MySQL Slow Queries**
Slow queries are defined as queries being slower than the long_query_time setting. For example, if you have long_query_time set to 3, all queries that take longer than 3 seconds to complete will show on this graph.",
"editable": true,
"error": false,
"fieldConfig": {
"defaults": {
"custom": {}
},
"overrides": []
},
"fill": 2,
"fillGradient": 0,
"grid": {},
"gridPos": {
"h": 7,
"w": 12,
"x": 12,
"y": 9
},
"hiddenSeries": false,
"id": 48,
"legend": {
"alignAsTable": true,
"avg": true,
"current": false,
"max": true,
"min": true,
"show": true,
"total": false,
"values": true
},
"lines": true,
"linewidth": 2,
"links": [],
"nullPointMode": "null",
"percentage": false,
"pluginVersion": "7.1.5",
"pointradius": 5,
"points": false,
"renderer": "flot",
"seriesOverrides": [],
"spaceLength": 10,
"stack": false,
"steppedLine": false,
"targets": [
{
"calculatedInterval": "2m",
"datasourceErrors": {},
"errors": {},
"expr": "rate(mysql_global_status_slow_queries{instance="$host"}[$interval]) or irate(mysql_global_status_slow_queries{instance="$host"}[5m])",
"format": "time_series",
"interval": "$interval",
"intervalFactor": 1,
"legendFormat": "Slow Queries",
"metric": "",
"refId": "A",
"step": 20
}
],
"thresholds": [],
"timeFrom": null,
"timeRegions": [],
"timeShift": null,
"title": "MySQL Slow Queries",
"tooltip": {
"msResolution": false,
"shared": true,
"sort": 0,
"value_type": "cumulative"
},
"type": "graph",
"xaxis": {
"buckets": null,
"mode": "time",
"name": null,
"show": true,
"values": []
},
"yaxes": [
{
"format": "short",
"label": "",
"logBase": 1,
"max": null,
"min": 0,
"show": true
},
{
"format": "short",
"label": "",
"logBase": 1,
"max": null,
"min": 0,
"show": true
}
],
"yaxis": {
"align": false,
"alignLevel": null
}
}
],
"repeat": null,
"title": "Sorts",
"type": "row"
},
{
"collapsed": true,
"datasource": null,
"gridPos": {
"h": 1,
"w": 24,
"x": 0,
"y": 9
},
"id": 387,
"panels": [
{
"aliasColors": {},
"bars": false,
"dashLength": 10,
"dashes": false,
"datasource": "Prometheus",
"decimals": 2,
"description": "**Aborted Connections**
When a given host connects to MySQL and the connection is interrupted in the middle (for example due to bad credentials), MySQL keeps that info in a system table (since 5.6 this table is exposed in performance_schema).
If the amount of failed requests without a successful connection reaches the value of max_connect_errors, mysqld assumes that something is wrong and blocks the host from further connection.
To allow connections from that host again, you need to issue the ``FLUSH HOSTS`` statement.",
"editable": true,
"error": false,
"fieldConfig": {
"defaults": {
"custom": {}
},
"overrides": []
},
"fill": 2,
"fillGradient": 0,
"grid": {},
"gridPos": {
"h": 7,
"w": 12,
"x": 0,
"y": 10
},
"hiddenSeries": false,
"id": 47,
"legend": {
"alignAsTable": true,
"avg": true,
"current": false,
"max": true,
"min": true,
"show": true,
"sort": "avg",
"sortDesc": true,
"total": false,
"values": true
},
"lines": true,
"linewidth": 2,
"links": [],
"nullPointMode": "null",
"percentage": false,
"pluginVersion": "7.1.5",
"pointradius": 5,
"points": false,
"renderer": "flot",
"seriesOverrides": [],
"spaceLength": 10,
"stack": false,
"steppedLine": false,
"targets": [
{
"calculatedInterval": "2m",
"datasourceErrors": {},
"errors": {},
"expr": "rate(mysql_global_status_aborted_connects{instance="$host"}[$interval]) or irate(mysql_global_status_aborted_connects{instance="$host"}[5m])",
"format": "time_series",
"interval": "$interval",
"intervalFactor": 1,
"legendFormat": "Aborted Connects (attempts)",
"metric": "",
"refId": "A",
"step": 20
},
{
"calculatedInterval": "2m",
"datasourceErrors": {},
"errors": {},
"expr": "rate(mysql_global_status_aborted_clients{instance="$host"}[$interval]) or irate(mysql_global_status_aborted_clients{instance="$host"}[5m])",
"format": "time_series",
"interval": "$interval",
"intervalFactor": 1,
"legendFormat": "Aborted Clients (timeout)",
"metric": "",
"refId": "B",
"step": 20,
"target": ""
}
],
"thresholds": [],
"timeFrom": null,
"timeRegions": [],
"timeShift": null,
"title": "MySQL Aborted Connections",
"tooltip": {
"msResolution": false,
"shared": true,
"sort": 0,
"value_type": "cumulative"
},
"type": "graph",
"xaxis": {
"buckets": null,
"mode": "time",
"name": null,
"show": true,
"values": []
},
"yaxes": [
{
"format": "short",
"label": "",
"logBase": 1,
"max": null,
"min": 0,
"show": true
},
{
"format": "short",
"label": "",
"logBase": 1,
"max": null,
"min": 0,
"show": true
}
],
"yaxis": {
"align": false,
"alignLevel": null
}
},
{
"aliasColors": {},
"bars": false,
"dashLength": 10,
"dashes": false,
"datasource": "Prometheus",
"decimals": 2,
"description": "**Table Locks**
MySQL takes a number of different locks for varying reasons. In this graph we see how many Table level locks MySQL has requested from the storage engine. In the case of InnoDB, many times the locks could actually be row locks as it only takes table level locks in a few specific cases.
It is most useful to compare Locks Immediate and Locks Waited. If Locks waited is rising, it means you have lock contention. Otherwise, Locks Immediate rising and falling is normal activity.",
"editable": true,
"error": false,
"fieldConfig": {
"defaults": {
"custom": {}
},
"overrides": []
},
"fill": 2,
"fillGradient": 0,
"grid": {},
"gridPos": {
"h": 7,
"w": 12,
"x": 12,
"y": 10
},
"hiddenSeries": false,
"id": 32,
"legend": {
"alignAsTable": true,
"avg": true,
"current": false,
"max": true,
"min": true,
"rightSide": false,
"show": true,
"sort": "avg",
"sortDesc": true,
"total": false,
"values": true
},
"lines": true,
"linewidth": 2,
"links": [],
"nullPointMode": "null",
"percentage": false,
"pluginVersion": "7.1.5",
"pointradius": 5,
"points": false,
"renderer": "flot",
"seriesOverrides": [],
"spaceLength": 10,
"stack": false,
"steppedLine": false,
"targets": [
{
"calculatedInterval": "2m",
"datasourceErrors": {},
"errors": {},
"expr": "rate(mysql_global_status_table_locks_immediate{instance="$host"}[$interval]) or irate(mysql_global_status_table_locks_immediate{instance="$host"}[5m])",
"format": "time_series",
"interval": "$interval",
"intervalFactor": 1,
"legendFormat": "Table Locks Immediate",
"metric": "",
"refId": "A",
"step": 20
},
{
"calculatedInterval": "2m",
"datasourceErrors": {},
"errors": {},
"expr": "rate(mysql_global_status_table_locks_waited{instance="$host"}[$interval]) or irate(mysql_global_status_table_locks_waited{instance="$host"}[5m])",
"format": "time_series",
"interval": "$interval",
"intervalFactor": 1,
"legendFormat": "Table Locks Waited",
"metric": "",
"refId": "B",
"step": 20
}
],
"thresholds": [],
"timeFrom": null,
"timeRegions": [],
"timeShift": null,
"title": "MySQL Table Locks",
"tooltip": {
"msResolution": false,
"shared": true,
"sort": 0,
"value_type": "individual"
},
"type": "graph",
"xaxis": {
"buckets": null,
"mode": "time",
"name": null,
"show": true,
"values": []
},
"yaxes": [
{
"format": "short",
"logBase": 1,
"max": null,
"min": 0,
"show": true
},
{
"format": "short",
"logBase": 1,
"max": null,
"min": 0,
"show": true
}
],
"yaxis": {
"align": false,
"alignLevel": null
}
}
],
"repeat": null,
"title": "Aborted",
"type": "row"
},
{
"collapsed": true,
"datasource": null,
"gridPos": {
"h": 1,
"w": 24,
"x": 0,
"y": 10
},
"id": 388,
"panels": [
{
"aliasColors": {},
"bars": false,
"dashLength": 10,
"dashes": false,
"datasource": "Prometheus",
"decimals": 2,
"description": "**MySQL Network Traffic**
Here we can see how much network traffic is generated by MySQL. Outbound is network traffic sent from MySQL and Inbound is network traffic MySQL has received.",
"editable": true,
"error": false,
"fieldConfig": {
"defaults": {
"custom": {}
},
"overrides": []
},
"fill": 6,
"fillGradient": 0,
"grid": {},
"gridPos": {
"h": 7,
"w": 12,
"x": 0,
"y": 18
},
"hiddenSeries": false,
"id": 9,
"legend": {
"alignAsTable": true,
"avg": true,
"current": false,
"max": true,
"min": true,
"rightSide": false,
"show": true,
"sort": "avg",
"sortDesc": true,
"total": false,
"values": true
},
"lines": true,
"linewidth": 2,
"links": [],
"nullPointMode": "null",
"percentage": false,
"pluginVersion": "7.1.5",
"pointradius": 5,
"points": false,
"renderer": "flot",
"seriesOverrides": [],
"spaceLength": 10,
"stack": true,
"steppedLine": false,
"targets": [
{
"calculatedInterval": "2m",
"datasourceErrors": {},
"errors": {},
"expr": "rate(mysql_global_status_bytes_received{instance="$host"}[$interval]) or irate(mysql_global_status_bytes_received{instance="$host"}[5m])",
"format": "time_series",
"interval": "$interval",
"intervalFactor": 1,
"legendFormat": "Inbound",
"metric": "",
"refId": "A",
"step": 20
},
{
"calculatedInterval": "2m",
"datasourceErrors": {},
"errors": {},
"expr": "rate(mysql_global_status_bytes_sent{instance="$host"}[$interval]) or irate(mysql_global_status_bytes_sent{instance="$host"}[5m])",
"format": "time_series",
"interval": "$interval",
"intervalFactor": 1,
"legendFormat": "Outbound",
"metric": "",
"refId": "B",
"step": 20
}
],
"thresholds": [],
"timeFrom": null,
"timeRegions": [],
"timeShift": null,
"title": "MySQL Network Traffic",
"tooltip": {
"msResolution": false,
"shared": true,
"sort": 0,
"value_type": "individual"
},
"type": "graph",
"xaxis": {
"buckets": null,
"mode": "time",
"name": null,
"show": true,
"values": []
},
"yaxes": [
{
"format": "Bps",
"logBase": 1,
"max": null,
"min": 0,
"show": true
},
{
"format": "none",
"logBase": 1,
"max": null,
"min": 0,
"show": true
}
],
"yaxis": {
"align": false,
"alignLevel": null
}
},
{
"aliasColors": {},
"bars": true,
"dashLength": 10,
"dashes": false,
"datasource": "Prometheus",
"decimals": 2,
"description": "**MySQL Network Usage Hourly**
Here we can see how much network traffic is generated by MySQL per hour. You can use the bar graph to compare data sent by MySQL and data received by MySQL.",
"editable": true,
"error": false,
"fieldConfig": {
"defaults": {
"custom": {}
},
"overrides": []
},
"fill": 6,
"fillGradient": 0,
"grid": {},
"gridPos": {
"h": 7,
"w": 12,
"x": 12,
"y": 18
},
"height": "250px",
"hiddenSeries": false,
"id": 381,
"legend": {
"alignAsTable": true,
"avg": true,
"current": false,
"max": true,
"min": true,
"rightSide": false,
"show": true,
"sort": "avg",
"sortDesc": true,
"total": false,
"values": true
},
"lines": false,
"linewidth": 2,
"links": [],
"nullPointMode": "null",
"percentage": false,
"pluginVersion": "7.1.5",
"pointradius": 5,
"points": false,
"renderer": "flot",
"seriesOverrides": [],
"spaceLength": 10,
"stack": true,
"steppedLine": false,
"targets": [
{
"calculatedInterval": "2m",
"datasourceErrors": {},
"errors": {},
"expr": "increase(mysql_global_status_bytes_received{instance="$host"}[1h])",
"format": "time_series",
"interval": "1h",
"intervalFactor": 1,
"legendFormat": "Received",
"metric": "",
"refId": "A",
"step": 3600
},
{
"calculatedInterval": "2m",
"datasourceErrors": {},
"errors": {},
"expr": "increase(mysql_global_status_bytes_sent{instance="$host"}[1h])",
"format": "time_series",
"interval": "1h",
"intervalFactor": 1,
"legendFormat": "Sent",
"metric": "",
"refId": "B",
"step": 3600
}
],
"thresholds": [],
"timeFrom": "24h",
"timeRegions": [],
"timeShift": null,
"title": "MySQL Network Usage Hourly",
"tooltip": {
"msResolution": false,
"shared": true,
"sort": 0,
"value_type": "individual"
},
"type": "graph",
"xaxis": {
"buckets": null,
"mode": "time",
"name": null,
"show": true,
"values": []
},
"yaxes": [
{
"format": "bytes",
"logBase": 1,
"max": null,
"min": 0,
"show": true
},
{
"format": "none",
"logBase": 1,
"max": null,
"min": 0,
"show": true
}
],
"yaxis": {
"align": false,
"alignLevel": null
}
}
],
"repeat": null,
"title": "Network",
"type": "row"
},
{
"collapsed": true,
"datasource": null,
"gridPos": {
"h": 1,
"w": 24,
"x": 0,
"y": 11
},
"id": 389,
"panels": [
{
"aliasColors": {},
"bars": false,
"dashLength": 10,
"dashes": false,
"datasource": "Prometheus",
"decimals": 0,
"description": "***System Memory***: Total Memory for the system.\
***InnoDB Buffer Pool Data***: InnoDB maintains a storage area called the buffer pool for caching data and indexes in memory.\
***TokuDB Cache Size***: Similar in function to the InnoDB Buffer Pool, TokuDB will allocate 50% of the installed RAM for its own cache.\
***Key Buffer Size***: Index blocks for MYISAM tables are buffered and are shared by all threads. key_buffer_size is the size of the buffer used for index blocks.\
***Adaptive Hash Index Size***: When InnoDB notices that some index values are being accessed very frequently, it builds a hash index for them in memory on top of B-Tree indexes.\
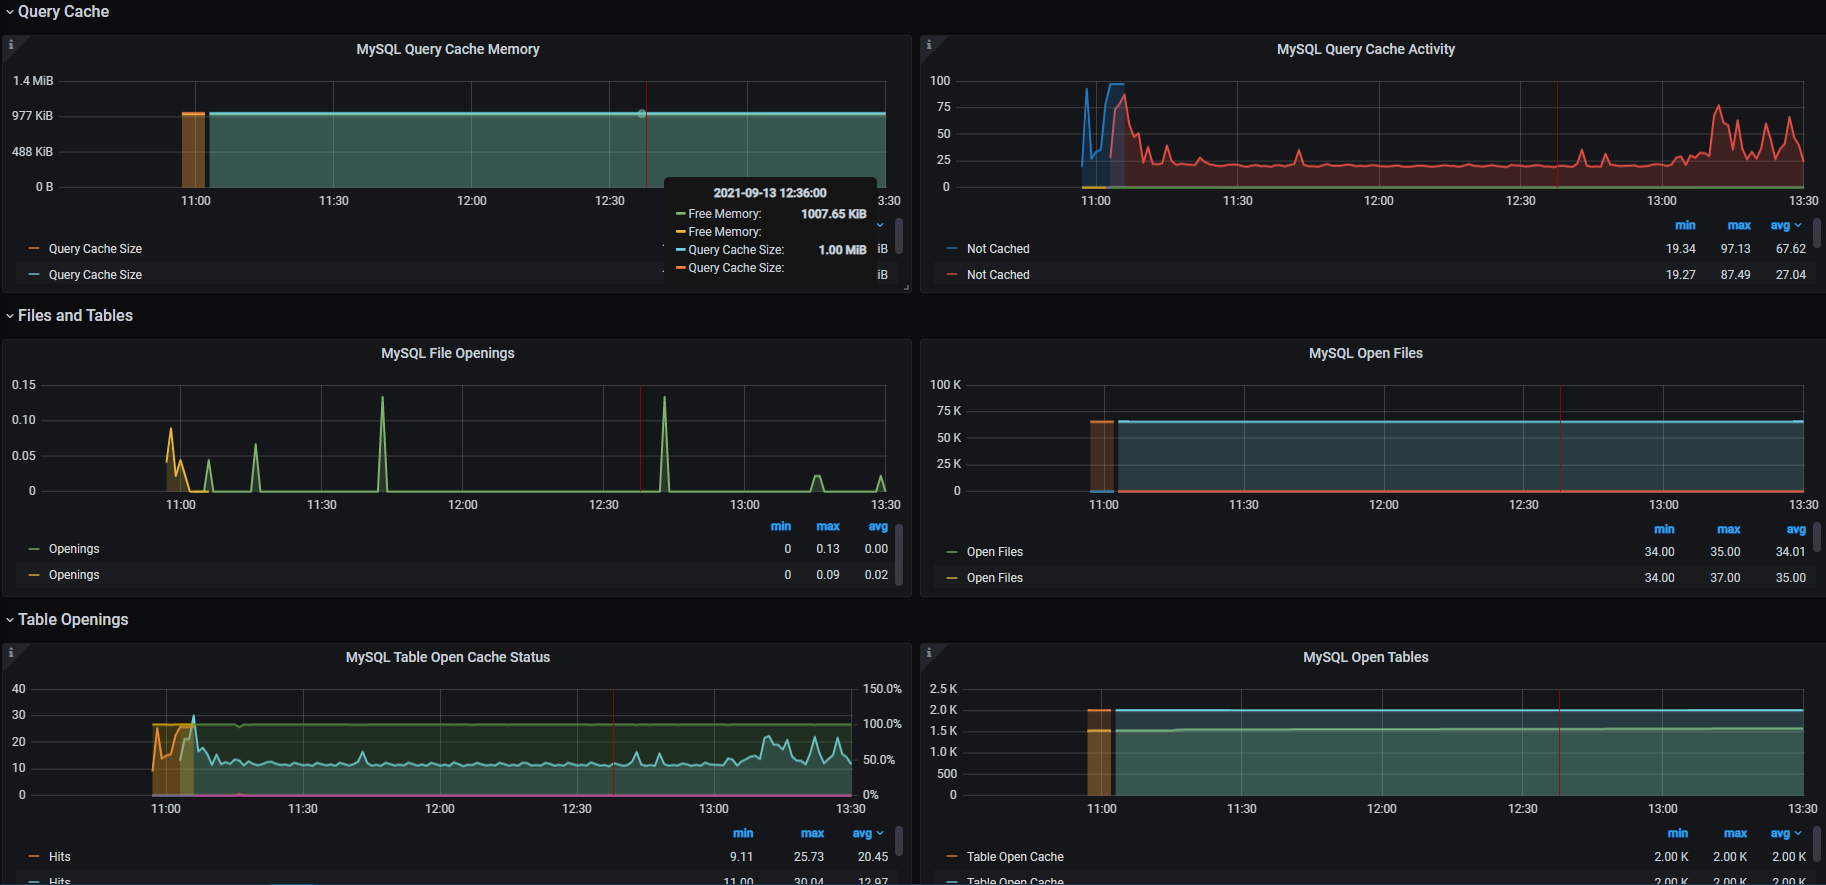
***Query Cache Size***: The query cache stores the text of a SELECT statement together with the corresponding result that was sent to the client. The query cache has huge scalability problems in that only one thread can do an operation in the query cache at the same time.\
***InnoDB Dictionary Size***: The data dictionary is InnoDB ‘s internal catalog of tables. InnoDB stores the data dictionary on disk, and loads entries into memory while the server is running.\
***InnoDB Log Buffer Size***: The MySQL InnoDB log buffer allows transactions to run without having to write the log to disk before the transactions commit.",
"editable": true,
"error": false,
"fieldConfig": {
"defaults": {
"custom": {}
},
"overrides": []
},
"fill": 6,
"fillGradient": 0,
"grid": {},
"gridPos": {
"h": 7,
"w": 24,
"x": 0,
"y": 26
},
"hiddenSeries": false,
"id": 50,
"legend": {
"alignAsTable": true,
"avg": true,
"current": false,
"hideEmpty": true,
"hideZero": true,
"max": true,
"min": true,
"rightSide": true,
"show": true,
"sort": "avg",
"sortDesc": true,
"total": false,
"values": true
},
"lines": true,
"linewidth": 2,
"links": [
{
"title": "Detailed descriptions about metrics",
"url": "https://www.percona.com/doc/percona-monitoring-and-management/dashboard.mysql-overview.html#mysql-internal-memory-overview"
}
],
"nullPointMode": "null",
"percentage": false,
"pluginVersion": "7.1.5",
"pointradius": 5,
"points": false,
"renderer": "flot",
"seriesOverrides": [
{
"alias": "System Memory",
"fill": 0,
"stack": false
}
],
"spaceLength": 10,
"stack": true,
"steppedLine": false,
"targets": [
{
"expr": "node_memory_MemTotal_bytes{instance="$host"}",
"format": "time_series",
"intervalFactor": 2,
"legendFormat": "System Memory",
"refId": "G",
"step": 4
},
{
"expr": "mysql_global_status_innodb_page_size{instance="$host"} * on (instance) mysql_global_status_buffer_pool_pages{instance="$host",state="data"}",
"format": "time_series",
"hide": false,
"interval": "$interval",
"intervalFactor": 1,
"legendFormat": "InnoDB Buffer Pool Data",
"refId": "A",
"step": 20
},
{
"expr": "mysql_global_variables_innodb_log_buffer_size{instance="$host"}",
"format": "time_series",
"interval": "$interval",
"intervalFactor": 1,
"legendFormat": "InnoDB Log Buffer Size",
"refId": "D",
"step": 20
},
{
"expr": "mysql_global_variables_innodb_additional_mem_pool_size{instance="$host"}",
"format": "time_series",
"interval": "$interval",
"intervalFactor": 2,
"legendFormat": "InnoDB Additional Memory Pool Size",
"refId": "H",
"step": 40
},
{
"expr": "mysql_global_status_innodb_mem_dictionary{instance="$host"}",
"format": "time_series",
"interval": "$interval",
"intervalFactor": 1,
"legendFormat": "InnoDB Dictionary Size",
"refId": "F",
"step": 20
},
{
"expr": "mysql_global_variables_key_buffer_size{instance="$host"}",
"format": "time_series",
"interval": "$interval",
"intervalFactor": 1,
"legendFormat": "Key Buffer Size",
"refId": "B",
"step": 20
},
{
"expr": "mysql_global_variables_query_cache_size{instance="$host"}",
"format": "time_series",
"interval": "$interval",
"intervalFactor": 1,
"legendFormat": "Query Cache Size",
"refId": "C",
"step": 20
},
{
"expr": "mysql_global_status_innodb_mem_adaptive_hash{instance="$host"}",
"format": "time_series",
"interval": "$interval",
"intervalFactor": 1,
"legendFormat": "Adaptive Hash Index Size",
"refId": "E",
"step": 20
},
{
"expr": "mysql_global_variables_tokudb_cache_size{instance="$host"}",
"format": "time_series",
"interval": "$interval",
"intervalFactor": 1,
"legendFormat": "TokuDB Cache Size",
"refId": "I",
"step": 20
}
],
"thresholds": [],
"timeFrom": null,
"timeRegions": [],
"timeShift": null,
"title": "MySQL Internal Memory Overview",
"tooltip": {
"msResolution": false,
"shared": true,
"sort": 0,
"value_type": "individual"
},
"type": "graph",
"xaxis": {
"buckets": null,
"mode": "time",
"name": null,
"show": true,
"values": []
},
"yaxes": [
{
"format": "bytes",
"label": "",
"logBase": 1,
"max": null,
"min": 0,
"show": true
},
{
"format": "short",
"label": null,
"logBase": 1,
"max": null,
"min": null,
"show": true
}
],
"yaxis": {
"align": false,
"alignLevel": null
}
}
],
"repeat": null,
"title": "Memory",
"type": "row"
},
{
"collapsed": true,
"datasource": null,
"gridPos": {
"h": 1,
"w": 24,
"x": 0,
"y": 12
},
"id": 390,
"panels": [
{
"aliasColors": {},
"bars": false,
"dashLength": 10,
"dashes": false,
"datasource": "Prometheus",
"decimals": 2,
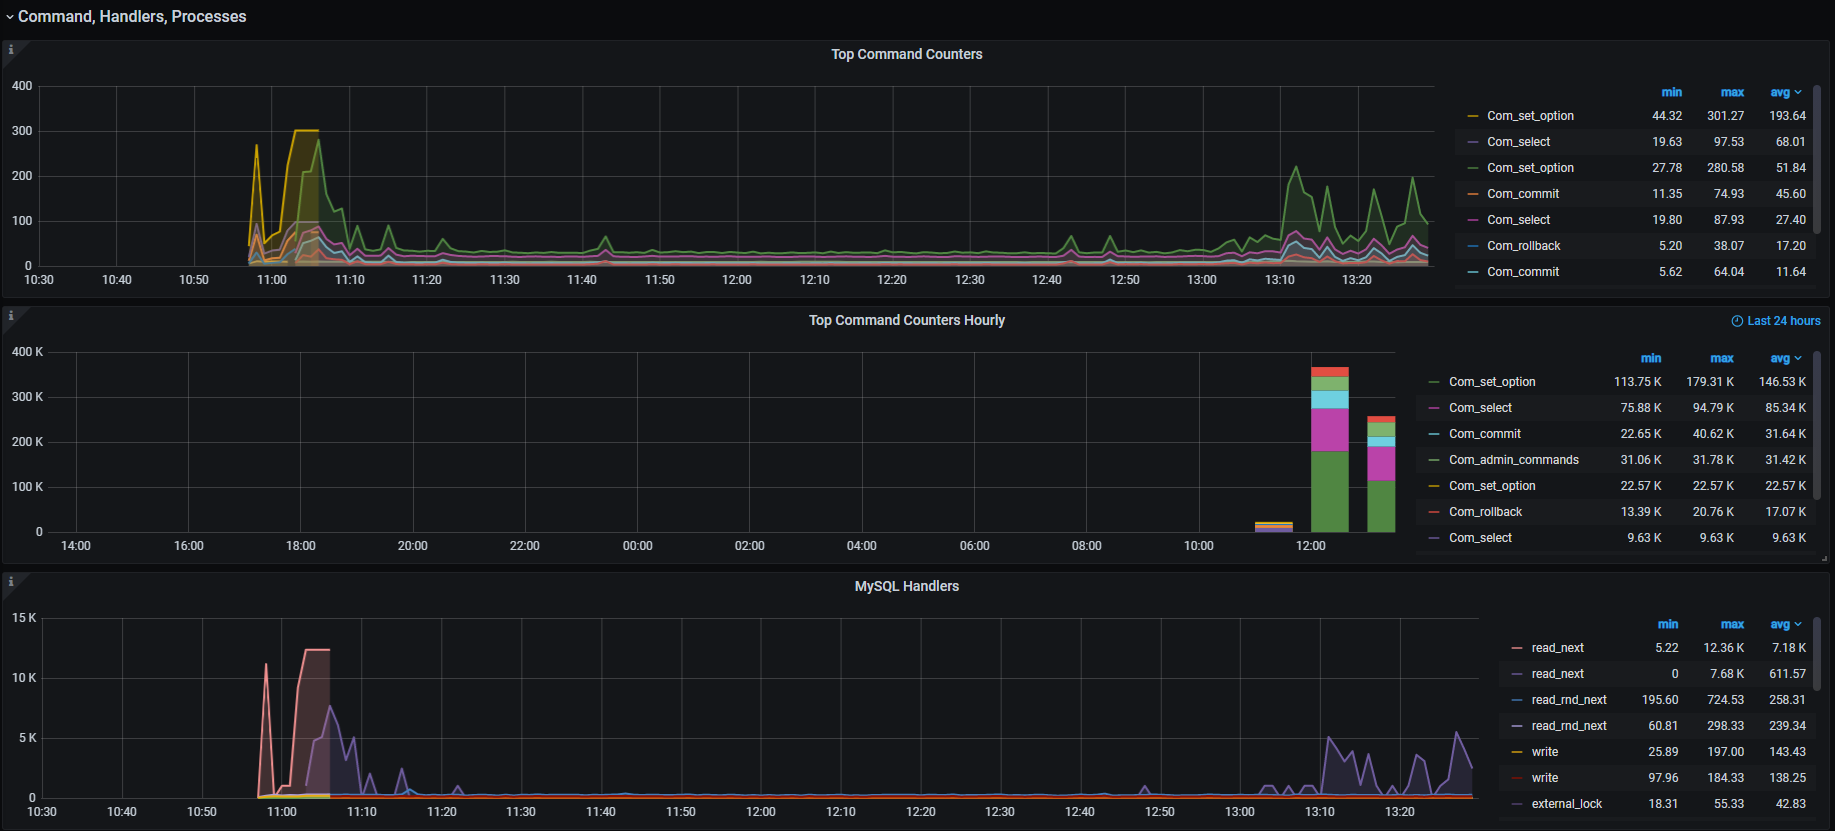
"description": "**Top Command Counters**
The Com_{{xxx}} statement counter variables indicate the number of times each xxx statement has been executed. There is one status variable for each type of statement. For example, Com_delete and Com_update count [``DELETE``](https://dev.mysql.com/doc/refman/5.7/en/delete.html) and [``UPDATE``](https://dev.mysql.com/doc/refman/5.7/en/update.html) statements, respectively. Com_delete_multi and Com_update_multi are similar but apply to [``DELETE``](https://dev.mysql.com/doc/refman/5.7/en/delete.html) and [``UPDATE``](https://dev.mysql.com/doc/refman/5.7/en/update.html) statements that use multiple-table syntax.",
"editable": true,
"error": false,
"fieldConfig": {
"defaults": {
"custom": {}
},
"overrides": []
},
"fill": 2,
"fillGradient": 0,
"grid": {},
"gridPos": {
"h": 7,
"w": 24,
"x": 0,
"y": 34
},
"hiddenSeries": false,
"id": 14,
"legend": {
"alignAsTable": true,
"avg": true,
"current": false,
"hideEmpty": false,
"hideZero": false,
"max": true,
"min": true,
"rightSide": true,
"show": true,
"sort": "avg",
"sortDesc": true,
"total": false,
"values": true
},
"lines": true,
"linewidth": 2,
"links": [
{
"title": "Server Status Variables (Com_xxx)",
"url": "https://dev.mysql.com/doc/refman/5.7/en/server-status-variables.html#statvar_Com_xxx"
}
],
"nullPointMode": "null",
"percentage": false,
"pluginVersion": "7.1.5",
"pointradius": 5,
"points": false,
"renderer": "flot",
"seriesOverrides": [],
"spaceLength": 10,
"stack": false,
"steppedLine": false,
"targets": [
{
"calculatedInterval": "2m",
"datasourceErrors": {},
"errors": {},
"expr": "topk(5, rate(mysql_global_status_commands_total{instance="$host"}[$interval])>0) or topk(5, irate(mysql_global_status_commands_total{instance="$host"}[5m])>0)",
"format": "time_series",
"hide": false,
"interval": "$interval",
"intervalFactor": 1,
"legendFormat": "Com_{{ command }}",
"metric": "",
"refId": "B",
"step": 20
}
],
"thresholds": [],
"timeFrom": null,
"timeRegions": [],
"timeShift": null,
"title": "Top Command Counters",
"tooltip": {
"msResolution": false,
"shared": true,
"sort": 0,
"value_type": "individual"
},
"type": "graph",
"xaxis": {
"buckets": null,
"mode": "time",
"name": null,
"show": true,
"values": []
},
"yaxes": [
{
"format": "short",
"logBase": 1,
"max": null,
"min": 0,
"show": true
},
{
"format": "short",
"logBase": 1,
"max": null,
"min": 0,
"show": true
}
],
"yaxis": {
"align": false,
"alignLevel": null
}
},
{
"aliasColors": {},
"bars": true,
"dashLength": 10,
"dashes": false,
"datasource": "Prometheus",
"decimals": 2,
"description": "**Top Command Counters Hourly**
The Com_{{xxx}} statement counter variables indicate the number of times each xxx statement has been executed. There is one status variable for each type of statement. For example, Com_delete and Com_update count [``DELETE``](https://dev.mysql.com/doc/refman/5.7/en/delete.html) and [``UPDATE``](https://dev.mysql.com/doc/refman/5.7/en/update.html) statements, respectively. Com_delete_multi and Com_update_multi are similar but apply to [``DELETE``](https://dev.mysql.com/doc/refman/5.7/en/delete.html) and [``UPDATE``](https://dev.mysql.com/doc/refman/5.7/en/update.html) statements that use multiple-table syntax.",
"editable": true,
"error": false,
"fieldConfig": {
"defaults": {
"custom": {}
},
"overrides": []
},
"fill": 6,
"fillGradient": 0,
"grid": {},
"gridPos": {
"h": 7,
"w": 24,
"x": 0,
"y": 41
},
"hiddenSeries": false,
"id": 39,
"legend": {
"alignAsTable": true,
"avg": true,
"current": false,
"max": true,
"min": true,
"rightSide": true,
"show": true,
"sort": "avg",
"sortDesc": true,
"total": false,
"values": true
},
"lines": false,
"linewidth": 2,
"links": [
{
"title": "Server Status Variables (Com_xxx)",
"url": "https://dev.mysql.com/doc/refman/5.7/en/server-status-variables.html#statvar_Com_xxx"
}
],
"nullPointMode": "null",
"percentage": false,
"pluginVersion": "7.1.5",
"pointradius": 5,
"points": false,
"renderer": "flot",
"seriesOverrides": [],
"spaceLength": 10,
"stack": true,
"steppedLine": false,
"targets": [
{
"calculatedInterval": "2m",
"datasourceErrors": {},
"errors": {},
"expr": "topk(5, increase(mysql_global_status_commands_total{instance="$host"}[1h])>0)",
"format": "time_series",
"interval": "1h",
"intervalFactor": 1,
"legendFormat": "Com_{{ command }}",
"metric": "",
"refId": "A",
"step": 3600
}
],
"thresholds": [],
"timeFrom": "24h",
"timeRegions": [],
"timeShift": null,
"title": "Top Command Counters Hourly",
"tooltip": {
"msResolution": false,
"shared": true,
"sort": 0,
"value_type": "individual"
},
"type": "graph",
"xaxis": {
"buckets": null,
"mode": "time",
"name": null,
"show": true,
"values": []
},
"yaxes": [
{
"format": "short",
"logBase": 1,
"max": null,
"min": 0,
"show": true
},
{
"format": "short",
"logBase": 1,
"max": null,
"min": 0,
"show": true
}
],
"yaxis": {
"align": false,
"alignLevel": null
}
},
{
"aliasColors": {},
"bars": false,
"dashLength": 10,
"dashes": false,
"datasource": "Prometheus",
"decimals": 2,
"description": "**MySQL Handlers**
Handler statistics are internal statistics on how MySQL is selecting, updating, inserting, and modifying rows, tables, and indexes.
This is in fact the layer between the Storage Engine and MySQL.
* `read_rnd_next` is incremented when the server performs a full table scan and this is a counter you don't really want to see with a high value.
* `read_key` is incremented when a read is done with an index.
* `read_next` is incremented when the storage engine is asked to 'read the next index entry'. A high value means a lot of index scans are being done.",
"editable": true,
"error": false,
"fieldConfig": {
"defaults": {
"custom": {}
},
"overrides": []
},
"fill": 2,
"fillGradient": 0,
"grid": {},
"gridPos": {
"h": 7,
"w": 24,
"x": 0,
"y": 48
},
"hiddenSeries": false,
"id": 8,
"legend": {
"alignAsTable": true,
"avg": true,
"current": false,
"hideZero": true,
"max": true,
"min": true,
"rightSide": true,
"show": true,
"sort": "avg",
"sortDesc": true,
"total": false,
"values": true
},
"lines": true,
"linewidth": 2,
"links": [],
"nullPointMode": "null",
"percentage": false,
"pluginVersion": "7.1.5",
"pointradius": 5,
"points": false,
"renderer": "flot",
"seriesOverrides": [],
"spaceLength": 10,
"stack": false,
"steppedLine": false,
"targets": [
{
"calculatedInterval": "2m",
"datasourceErrors": {},
"errors": {},
"expr": "rate(mysql_global_status_handlers_total{instance="$host", handler!~"commit|rollback|savepoint.*|prepare"}[$interval]) or irate(mysql_global_status_handlers_total{instance="$host", handler!~"commit|rollback|savepoint.*|prepare"}[5m])",
"format": "time_series",
"interval": "$interval",
"intervalFactor": 1,
"legendFormat": "{{ handler }}",
"metric": "",
"refId": "J",
"step": 20
}
],
"thresholds": [],
"timeFrom": null,
"timeRegions": [],
"timeShift": null,
"title": "MySQL Handlers",
"tooltip": {
"msResolution": false,
"shared": true,
"sort": 0,
"value_type": "individual"
},
"type": "graph",
"xaxis": {
"buckets": null,
"mode": "time",
"name": null,
"show": true,
"values": []
},
"yaxes": [
{
"format": "short",
"logBase": 1,
"max": null,
"min": 0,
"show": true
},
{
"format": "short",
"logBase": 1,
"max": null,
"min": 0,
"show": true
}
],
"yaxis": {
"align": false,
"alignLevel": null
}
},
{
"aliasColors": {},
"bars": false,
"dashLength": 10,
"dashes": false,
"datasource": "Prometheus",
"decimals": 2,
"editable": true,
"error": false,
"fieldConfig": {
"defaults": {
"custom": {}
},
"overrides": []
},
"fill": 2,
"fillGradient": 0,
"grid": {},
"gridPos": {
"h": 7,
"w": 24,
"x": 0,
"y": 55
},
"hiddenSeries": false,
"id": 28,
"legend": {
"alignAsTable": true,
"avg": true,
"current": false,
"hideZero": true,
"max": true,
"min": true,
"rightSide": true,
"show": true,
"sort": "avg",
"sortDesc": true,
"total": false,
"values": true
},
"lines": true,
"linewidth": 2,
"links": [],
"nullPointMode": "null",
"percentage": false,
"pluginVersion": "7.1.5",
"pointradius": 5,
"points": false,
"renderer": "flot",
"seriesOverrides": [],
"spaceLength": 10,
"stack": false,
"steppedLine": false,
"targets": [
{
"calculatedInterval": "2m",
"datasourceErrors": {},
"errors": {},
"expr": "rate(mysql_global_status_handlers_total{instance="$host", handler=~"commit|rollback|savepoint.*|prepare"}[$interval]) or irate(mysql_global_status_handlers_total{instance="$host", handler=~"commit|rollback|savepoint.*|prepare"}[5m])",
"interval": "$interval",
"intervalFactor": 1,
"legendFormat": "{{ handler }}",
"metric": "",
"refId": "A",
"step": 20
}
],
"thresholds": [],
"timeFrom": null,
"timeRegions": [],
"timeShift": null,
"title": "MySQL Transaction Handlers",
"tooltip": {
"msResolution": false,
"shared": true,
"sort": 0,
"value_type": "individual"
},
"type": "graph",
"xaxis": {
"buckets": null,
"mode": "time",
"name": null,
"show": true,
"values": []
},
"yaxes": [
{
"format": "short",
"logBase": 1,
"max": null,
"min": 0,
"show": true
},
{
"format": "short",
"logBase": 1,
"max": null,
"min": 0,
"show": true
}
],
"yaxis": {
"align": false,
"alignLevel": null
}
},
{
"aliasColors": {},
"bars": false,
"dashLength": 10,
"dashes": false,
"datasource": "Prometheus",
"decimals": 2,
"editable": true,
"error": false,
"fieldConfig": {
"defaults": {
"custom": {}
},
"overrides": []
},
"fill": 0,
"fillGradient": 0,
"grid": {},
"gridPos": {
"h": 7,
"w": 24,
"x": 0,
"y": 62
},
"hiddenSeries": false,
"id": 40,
"legend": {
"alignAsTable": true,
"avg": true,
"current": false,
"hideZero": true,
"max": true,
"min": false,
"rightSide": true,
"show": true,
"sort": "avg",
"sortDesc": true,
"total": false,
"values": true
},
"lines": true,
"linewidth": 2,
"links": [],
"nullPointMode": "null",
"percentage": false,
"pluginVersion": "7.1.5",
"pointradius": 5,
"points": false,
"renderer": "flot",
"seriesOverrides": [],
"spaceLength": 10,
"stack": false,
"steppedLine": false,
"targets": [
{
"calculatedInterval": "2m",
"datasourceErrors": {},
"errors": {},
"expr": "mysql_info_schema_threads{instance="$host"}",
"interval": "$interval",
"intervalFactor": 1,
"legendFormat": "{{ state }}",
"metric": "",
"refId": "A",
"step": 20
}
],
"thresholds": [],
"timeFrom": null,
"timeRegions": [],
"timeShift": null,
"title": "Process States",
"tooltip": {
"msResolution": false,
"shared": true,
"sort": 0,
"value_type": "individual"
},
"type": "graph",
"xaxis": {
"buckets": null,
"mode": "time",
"name": null,
"show": true,
"values": []
},
"yaxes": [
{
"format": "short",
"logBase": 1,
"max": null,
"min": 0,
"show": true
},
{
"format": "short",
"logBase": 1,
"max": null,
"min": 0,
"show": true
}
],
"yaxis": {
"align": false,
"alignLevel": null
}
},
{
"aliasColors": {},
"bars": true,
"dashLength": 10,
"dashes": false,
"datasource": "Prometheus",
"decimals": 2,
"editable": true,
"error": false,
"fieldConfig": {
"defaults": {
"custom": {}
},
"overrides": []
},
"fill": 6,
"fillGradient": 0,
"grid": {},
"gridPos": {
"h": 7,
"w": 24,
"x": 0,
"y": 69
},
"hiddenSeries": false,
"id": 49,
"legend": {
"alignAsTable": true,
"avg": true,
"current": false,
"hideZero": true,
"max": true,
"min": false,
"rightSide": true,
"show": true,
"sort": "avg",
"sortDesc": true,
"total": false,
"values": true
},
"lines": false,
"linewidth": 2,
"links": [],
"nullPointMode": "null",
"percentage": false,
"pluginVersion": "7.1.5",
"pointradius": 5,
"points": false,
"renderer": "flot",
"seriesOverrides": [],
"spaceLength": 10,
"stack": true,
"steppedLine": false,
"targets": [
{
"calculatedInterval": "2m",
"datasourceErrors": {},
"errors": {},
"expr": "topk(5, avg_over_time(mysql_info_schema_threads{instance="$host"}[1h]))",
"interval": "1h",
"intervalFactor": 1,
"legendFormat": "{{ state }}",
"metric": "",
"refId": "A",
"step": 3600
}
],
"thresholds": [],
"timeFrom": "24h",
"timeRegions": [],
"timeShift": null,
"title": "Top Process States Hourly",
"tooltip": {
"msResolution": false,
"shared": true,
"sort": 0,
"value_type": "individual"
},
"type": "graph",
"xaxis": {
"buckets": null,
"mode": "time",
"name": null,
"show": true,
"values": []
},
"yaxes": [
{
"format": "short",
"logBase": 1,
"max": null,
"min": 0,
"show": true
},
{
"format": "short",
"logBase": 1,
"max": null,
"min": 0,
"show": true
}
],
"yaxis": {
"align": false,
"alignLevel": null
}
}
],
"repeat": null,
"title": "Command, Handlers, Processes",
"type": "row"
},
{
"collapsed": true,
"datasource": null,
"gridPos": {
"h": 1,
"w": 24,
"x": 0,
"y": 13
},
"id": 391,
"panels": [
{
"aliasColors": {},
"bars": false,
"dashLength": 10,
"dashes": false,
"datasource": "Prometheus",
"decimals": 2,
"description": "**MySQL Query Cache Memory**
The query cache has huge scalability problems in that only one thread can do an operation in the query cache at the same time. This serialization is true not only for SELECTs, but also for INSERT/UPDATE/DELETE.
This also means that the larger the `query_cache_size` is set to, the slower those operations become. In concurrent environments, the MySQL Query Cache quickly becomes a contention point, decreasing performance. MariaDB and AWS Aurora have done work to try and eliminate the query cache contention in their flavors of MySQL, while MySQL 8.0 has eliminated the query cache feature.
The recommended settings for most environments is to set:
``query_cache_type=0``
``query_cache_size=0``
Note that while you can dynamically change these values, to completely remove the contention point you have to restart the database.",
"editable": true,
"error": false,
"fieldConfig": {
"defaults": {
"custom": {}
},
"overrides": []
},
"fill": 2,
"fillGradient": 0,
"grid": {},
"gridPos": {
"h": 7,
"w": 12,
"x": 0,
"y": 35
},
"hiddenSeries": false,
"id": 46,
"legend": {
"alignAsTable": true,
"avg": true,
"current": false,
"max": true,
"min": true,
"rightSide": false,
"show": true,
"sort": "avg",
"sortDesc": true,
"total": false,
"values": true
},
"lines": true,
"linewidth": 2,
"links": [],
"nullPointMode": "null",
"percentage": false,
"pluginVersion": "7.1.5",
"pointradius": 5,
"points": false,
"renderer": "flot",
"seriesOverrides": [],
"spaceLength": 10,
"stack": false,
"steppedLine": false,
"targets": [
{
"calculatedInterval": "2m",
"datasourceErrors": {},
"errors": {},
"expr": "mysql_global_status_qcache_free_memory{instance="$host"}",
"format": "time_series",
"interval": "$interval",
"intervalFactor": 1,
"legendFormat": "Free Memory",
"metric": "",
"refId": "F",
"step": 20
},
{
"calculatedInterval": "2m",
"datasourceErrors": {},
"errors": {},
"expr": "mysql_global_variables_query_cache_size{instance="$host"}",
"format": "time_series",
"interval": "$interval",
"intervalFactor": 1,
"legendFormat": "Query Cache Size",
"metric": "",
"refId": "E",
"step": 20
}
],
"thresholds": [],
"timeFrom": null,
"timeRegions": [],
"timeShift": null,
"title": "MySQL Query Cache Memory",
"tooltip": {
"msResolution": false,
"shared": true,
"sort": 0,
"value_type": "individual"
},
"type": "graph",
"xaxis": {
"buckets": null,
"mode": "time",
"name": null,
"show": true,
"values": []
},
"yaxes": [
{
"format": "bytes",
"logBase": 1,
"max": null,
"min": 0,
"show": true
},
{
"format": "short",
"logBase": 1,
"max": null,
"min": 0,
"show": true
}
],
"yaxis": {
"align": false,
"alignLevel": null
}
},
{
"aliasColors": {},
"bars": false,
"dashLength": 10,
"dashes": false,
"datasource": "Prometheus",
"decimals": 2,
"description": "**MySQL Query Cache Activity**
The query cache has huge scalability problems in that only one thread can do an operation in the query cache at the same time. This serialization is true not only for SELECTs, but also for INSERT/UPDATE/DELETE.
This also means that the larger the `query_cache_size` is set to, the slower those operations become. In concurrent environments, the MySQL Query Cache quickly becomes a contention point, decreasing performance. MariaDB and AWS Aurora have done work to try and eliminate the query cache contention in their flavors of MySQL, while MySQL 8.0 has eliminated the query cache feature.
The recommended settings for most environments is to set:
``query_cache_type=0``
``query_cache_size=0``
Note that while you can dynamically change these values, to completely remove the contention point you have to restart the database.",
"editable": true,
"error": false,
"fieldConfig": {
"defaults": {
"custom": {}
},
"overrides": []
},
"fill": 2,
"fillGradient": 0,
"grid": {},
"gridPos": {
"h": 7,
"w": 12,
"x": 12,
"y": 35
},
"height": "",
"hiddenSeries": false,
"id": 45,
"legend": {
"alignAsTable": true,
"avg": true,
"current": false,
"max": true,
"min": true,
"rightSide": false,
"show": true,
"sort": "avg",
"sortDesc": true,
"total": false,
"values": true
},
"lines": true,
"linewidth": 2,
"links": [],
"nullPointMode": "null",
"percentage": false,
"pluginVersion": "7.1.5",
"pointradius": 5,
"points": false,
"renderer": "flot",
"seriesOverrides": [],
"spaceLength": 10,
"stack": false,
"steppedLine": false,
"targets": [
{
"calculatedInterval": "2m",
"datasourceErrors": {},
"errors": {},
"expr": "rate(mysql_global_status_qcache_hits{instance="$host"}[$interval]) or irate(mysql_global_status_qcache_hits{instance="$host"}[5m])",
"format": "time_series",
"interval": "$interval",
"intervalFactor": 1,
"legendFormat": "Hits",
"metric": "",
"refId": "B",
"step": 20
},
{
"calculatedInterval": "2m",
"datasourceErrors": {},
"errors": {},
"expr": "rate(mysql_global_status_qcache_inserts{instance="$host"}[$interval]) or irate(mysql_global_status_qcache_inserts{instance="$host"}[5m])",
"format": "time_series",
"interval": "$interval",
"intervalFactor": 1,
"legendFormat": "Inserts",
"metric": "",
"refId": "C",
"step": 20
},
{
"calculatedInterval": "2m",
"datasourceErrors": {},
"errors": {},
"expr": "rate(mysql_global_status_qcache_not_cached{instance="$host"}[$interval]) or irate(mysql_global_status_qcache_not_cached{instance="$host"}[5m])",
"format": "time_series",
"interval": "$interval",
"intervalFactor": 1,
"legendFormat": "Not Cached",
"metric": "",
"refId": "D",
"step": 20
},
{
"calculatedInterval": "2m",
"datasourceErrors": {},
"errors": {},
"expr": "rate(mysql_global_status_qcache_lowmem_prunes{instance="$host"}[$interval]) or irate(mysql_global_status_qcache_lowmem_prunes{instance="$host"}[5m])",
"format": "time_series",
"interval": "$interval",
"intervalFactor": 1,
"legendFormat": "Prunes",
"metric": "",
"refId": "F",
"step": 20
},
{
"calculatedInterval": "2m",
"datasourceErrors": {},
"errors": {},
"expr": "mysql_global_status_qcache_queries_in_cache{instance="$host"}",
"format": "time_series",
"interval": "$interval",
"intervalFactor": 1,
"legendFormat": "Queries in Cache",
"metric": "",
"refId": "E",
"step": 20
}
],
"thresholds": [],
"timeFrom": null,
"timeRegions": [],
"timeShift": null,
"title": "MySQL Query Cache Activity",
"tooltip": {
"msResolution": false,
"shared": true,
"sort": 0,
"value_type": "individual"
},
"type": "graph",
"xaxis": {
"buckets": null,
"mode": "time",
"name": null,
"show": true,
"values": []
},
"yaxes": [
{
"format": "short",
"logBase": 1,
"max": null,
"min": 0,
"show": true
},
{
"format": "short",
"logBase": 1,
"max": null,
"min": 0,
"show": true
}
],
"yaxis": {
"align": false,
"alignLevel": null
}
}
],
"repeat": null,
"title": "Query Cache",
"type": "row"
},
{
"collapsed": true,
"datasource": null,
"gridPos": {
"h": 1,
"w": 24,
"x": 0,
"y": 14
},
"id": 392,
"panels": [
{
"aliasColors": {},
"bars": false,
"dashLength": 10,
"dashes": false,
"datasource": "Prometheus",
"decimals": 2,
"editable": true,
"error": false,
"fieldConfig": {
"defaults": {
"custom": {}
},
"overrides": []
},
"fill": 2,
"fillGradient": 0,
"grid": {},
"gridPos": {
"h": 7,
"w": 12,
"x": 0,
"y": 43
},
"hiddenSeries": false,
"id": 43,
"legend": {
"alignAsTable": true,
"avg": true,
"current": false,
"max": true,
"min": true,
"rightSide": false,
"show": true,
"total": false,
"values": true
},
"lines": true,
"linewidth": 2,
"links": [],
"nullPointMode": "null",
"percentage": false,
"pluginVersion": "7.1.5",
"pointradius": 5,
"points": false,
"renderer": "flot",
"seriesOverrides": [],
"spaceLength": 10,
"stack": false,
"steppedLine": false,
"targets": [
{
"calculatedInterval": "2m",
"datasourceErrors": {},
"errors": {},
"expr": "rate(mysql_global_status_opened_files{instance="$host"}[$interval]) or irate(mysql_global_status_opened_files{instance="$host"}[5m])",
"interval": "$interval",
"intervalFactor": 1,
"legendFormat": "Openings",
"metric": "",
"refId": "A",
"step": 20
}
],
"thresholds": [],
"timeFrom": null,
"timeRegions": [],
"timeShift": null,
"title": "MySQL File Openings",
"tooltip": {
"msResolution": false,
"shared": true,
"sort": 0,
"value_type": "individual"
},
"type": "graph",
"xaxis": {
"buckets": null,
"mode": "time",
"name": null,
"show": true,
"values": []
},
"yaxes": [
{
"format": "short",
"logBase": 1,
"max": null,
"min": 0,
"show": true
},
{
"format": "short",
"logBase": 1,
"max": null,
"min": 0,
"show": true
}
],
"yaxis": {
"align": false,
"alignLevel": null
}
},
{
"aliasColors": {},
"bars": false,
"dashLength": 10,
"dashes": false,
"datasource": "Prometheus",
"decimals": 2,
"editable": true,
"error": false,
"fieldConfig": {
"defaults": {
"custom": {}
},
"overrides": []
},
"fill": 2,
"fillGradient": 0,
"grid": {},
"gridPos": {
"h": 7,
"w": 12,
"x": 12,
"y": 43
},
"hiddenSeries": false,
"id": 41,
"legend": {
"alignAsTable": true,
"avg": true,
"current": false,
"max": true,
"min": true,
"rightSide": false,
"show": true,
"sortDesc": true,
"total": false,
"values": true
},
"lines": true,
"linewidth": 2,
"links": [],
"nullPointMode": "null",
"percentage": false,
"pluginVersion": "7.1.5",
"pointradius": 5,
"points": false,
"renderer": "flot",
"seriesOverrides": [],
"spaceLength": 10,
"stack": false,
"steppedLine": false,
"targets": [
{
"calculatedInterval": "2m",
"datasourceErrors": {},
"errors": {},
"expr": "mysql_global_status_open_files{instance="$host"}",
"interval": "$interval",
"intervalFactor": 1,
"legendFormat": "Open Files",
"metric": "",
"refId": "A",
"step": 20
},
{
"calculatedInterval": "2m",
"datasourceErrors": {},
"errors": {},
"expr": "mysql_global_variables_open_files_limit{instance="$host"}",
"interval": "$interval",
"intervalFactor": 1,
"legendFormat": "Open Files Limit",
"metric": "",
"refId": "D",
"step": 20
},
{
"expr": "mysql_global_status_innodb_num_open_files{instance="$host"}",
"interval": "$interval",
"intervalFactor": 1,
"legendFormat": "InnoDB Open Files",
"refId": "B",
"step": 20
}
],
"thresholds": [],
"timeFrom": null,
"timeRegions": [],
"timeShift": null,
"title": "MySQL Open Files",
"tooltip": {
"msResolution": false,
"shared": true,
"sort": 0,
"value_type": "individual"
},
"type": "graph",
"xaxis": {
"buckets": null,
"mode": "time",
"name": null,
"show": true,
"values": []
},
"yaxes": [
{
"format": "short",
"logBase": 1,
"max": null,
"min": 0,
"show": true
},
{
"format": "short",
"logBase": 1,
"max": null,
"min": 0,
"show": true
}
],
"yaxis": {
"align": false,
"alignLevel": null
}
}
],
"repeat": null,
"title": "Files and Tables",
"type": "row"
},
{
"collapsed": true,
"datasource": null,
"gridPos": {
"h": 1,
"w": 24,
"x": 0,
"y": 15
},
"id": 393,
"panels": [
{
"aliasColors": {},
"bars": false,
"dashLength": 10,
"dashes": false,
"datasource": "Prometheus",
"decimals": 2,
"description": "**MySQL Table Open Cache Status**
The recommendation is to set the `table_open_cache_instances` to a loose correlation to virtual CPUs, keeping in mind that more instances means the cache is split more times. If you have a cache set to 500 but it has 10 instances, each cache will only have 50 cached.
The `table_definition_cache` and `table_open_cache` can be left as default as they are auto-sized MySQL 5.6 and above (ie: do not set them to any value).",
"editable": true,
"error": false,
"fieldConfig": {
"defaults": {
"custom": {}
},
"overrides": []
},
"fill": 2,
"fillGradient": 0,
"grid": {},
"gridPos": {
"h": 7,
"w": 12,
"x": 0,
"y": 16
},
"hiddenSeries": false,
"id": 44,
"legend": {
"alignAsTable": true,
"avg": true,
"current": false,
"max": true,
"min": true,
"rightSide": false,
"show": true,
"sort": "avg",
"sortDesc": true,
"total": false,
"values": true
},
"lines": true,
"linewidth": 2,
"links": [
{
"title": "Server Status Variables (table_open_cache)",
"url": "http://dev.mysql.com/doc/refman/5.6/en/server-system-variables.html#sysvar_table_open_cache"
}
],
"nullPointMode": "null",
"percentage": false,
"pluginVersion": "7.1.5",
"pointradius": 5,
"points": false,
"renderer": "flot",
"seriesOverrides": [
{
"alias": "Table Open Cache Hit Ratio",
"yaxis": 2
}
],
"spaceLength": 10,
"stack": false,
"steppedLine": false,
"targets": [
{
"calculatedInterval": "2m",
"datasourceErrors": {},
"errors": {},
"expr": "rate(mysql_global_status_opened_tables{instance="$host"}[$interval]) or irate(mysql_global_status_opened_tables{instance="$host"}[5m])",
"format": "time_series",
"interval": "$interval",
"intervalFactor": 1,
"legendFormat": "Openings",
"metric": "",
"refId": "A",
"step": 20
},
{
"expr": "rate(mysql_global_status_table_open_cache_hits{instance="$host"}[$interval]) or irate(mysql_global_status_table_open_cache_hits{instance="$host"}[5m])",
"format": "time_series",
"interval": "$interval",
"intervalFactor": 1,
"legendFormat": "Hits",
"refId": "B",
"step": 20
},
{
"expr": "rate(mysql_global_status_table_open_cache_misses{instance="$host"}[$interval]) or irate(mysql_global_status_table_open_cache_misses{instance="$host"}[5m])",
"format": "time_series",
"interval": "$interval",
"intervalFactor": 1,
"legendFormat": "Misses",
"refId": "C",
"step": 20
},
{
"expr": "rate(mysql_global_status_table_open_cache_overflows{instance="$host"}[$interval]) or irate(mysql_global_status_table_open_cache_overflows{instance="$host"}[5m])",
"format": "time_series",
"interval": "$interval",
"intervalFactor": 1,
"legendFormat": "Misses due to Overflows",
"refId": "D",
"step": 20
},
{
"expr": "(rate(mysql_global_status_table_open_cache_hits{instance="$host"}[$interval]) or irate(mysql_global_status_table_open_cache_hits{instance="$host"}[5m]))/((rate(mysql_global_status_table_open_cache_hits{instance="$host"}[$interval]) or irate(mysql_global_status_table_open_cache_hits{instance="$host"}[5m]))+(rate(mysql_global_status_table_open_cache_misses{instance="$host"}[$interval]) or irate(mysql_global_status_table_open_cache_misses{instance="$host"}[5m])))",
"format": "time_series",
"interval": "$interval",
"intervalFactor": 1,
"legendFormat": "Table Open Cache Hit Ratio",
"refId": "E",
"step": 20
}
],
"thresholds": [],
"timeFrom": null,
"timeRegions": [],
"timeShift": null,
"title": "MySQL Table Open Cache Status",
"tooltip": {
"msResolution": false,
"shared": true,
"sort": 0,
"value_type": "individual"
},
"type": "graph",
"xaxis": {
"buckets": null,
"mode": "time",
"name": null,
"show": true,
"values": []
},
"yaxes": [
{
"format": "short",
"logBase": 1,
"max": null,
"min": 0,
"show": true
},
{
"format": "percentunit",
"logBase": 1,
"max": null,
"min": 0,
"show": true
}
],
"yaxis": {
"align": false,
"alignLevel": null
}
},
{
"aliasColors": {},
"bars": false,
"dashLength": 10,
"dashes": false,
"datasource": "Prometheus",
"decimals": 2,
"description": "**MySQL Open Tables**
The recommendation is to set the `table_open_cache_instances` to a loose correlation to virtual CPUs, keeping in mind that more instances means the cache is split more times. If you have a cache set to 500 but it has 10 instances, each cache will only have 50 cached.
The `table_definition_cache` and `table_open_cache` can be left as default as they are auto-sized MySQL 5.6 and above (ie: do not set them to any value).",
"editable": true,
"error": false,
"fieldConfig": {
"defaults": {
"custom": {}
},
"overrides": []
},
"fill": 2,
"fillGradient": 0,
"grid": {},
"gridPos": {
"h": 7,
"w": 12,
"x": 12,
"y": 16
},
"hiddenSeries": false,
"id": 42,
"legend": {
"alignAsTable": true,
"avg": true,
"current": false,
"max": true,
"min": true,
"rightSide": false,
"show": true,
"sort": "avg",
"sortDesc": true,
"total": false,
"values": true
},
"lines": true,
"linewidth": 2,
"links": [
{
"title": "Server Status Variables (table_open_cache)",
"url": "http://dev.mysql.com/doc/refman/5.6/en/server-system-variables.html#sysvar_table_open_cache"
}
],
"nullPointMode": "null",
"percentage": false,
"pluginVersion": "7.1.5",
"pointradius": 5,
"points": false,
"renderer": "flot",
"seriesOverrides": [],
"spaceLength": 10,
"stack": false,
"steppedLine": false,
"targets": [
{
"calculatedInterval": "2m",
"datasourceErrors": {},
"errors": {},
"expr": "mysql_global_status_open_tables{instance="$host"}",
"format": "time_series",
"interval": "$interval",
"intervalFactor": 1,
"legendFormat": "Open Tables",
"metric": "",
"refId": "B",
"step": 20
},
{
"calculatedInterval": "2m",
"datasourceErrors": {},
"errors": {},
"expr": "mysql_global_variables_table_open_cache{instance="$host"}",
"format": "time_series",
"interval": "$interval",
"intervalFactor": 1,
"legendFormat": "Table Open Cache",
"metric": "",
"refId": "C",
"step": 20
}
],
"thresholds": [],
"timeFrom": null,
"timeRegions": [],
"timeShift": null,
"title": "MySQL Open Tables",
"tooltip": {
"msResolution": false,
"shared": true,
"sort": 0,
"value_type": "individual"
},
"type": "graph",
"xaxis": {
"buckets": null,
"mode": "time",
"name": null,
"show": true,
"values": []
},
"yaxes": [
{
"format": "short",
"logBase": 1,
"max": null,
"min": 0,
"show": true
},
{
"format": "short",
"logBase": 1,
"max": null,
"min": 0,
"show": true
}
],
"yaxis": {
"align": false,
"alignLevel": null
}
}
],
"repeat": null,
"title": "Table Openings",
"type": "row"
},
{
"collapsed": false,
"datasource": null,
"gridPos": {
"h": 1,
"w": 24,
"x": 0,
"y": 16
},
"id": 394,
"panels": [],
"repeat": null,
"title": "MySQL Table Definition Cache",
"type": "row"
},
{
"aliasColors": {},
"bars": false,
"dashLength": 10,
"dashes": false,
"datasource": "Prometheus",
"decimals": 2,
"description": "**MySQL Table Definition Cache**
The recommendation is to set the `table_open_cache_instances` to a loose correlation to virtual CPUs, keeping in mind that more instances means the cache is split more times. If you have a cache set to 500 but it has 10 instances, each cache will only have 50 cached.
The `table_definition_cache` and `table_open_cache` can be left as default as they are auto-sized MySQL 5.6 and above (ie: do not set them to any value).",
"editable": true,
"error": false,
"fieldConfig": {
"defaults": {
"custom": {}
},
"overrides": []
},
"fill": 2,
"fillGradient": 0,
"grid": {},
"gridPos": {
"h": 7,
"w": 24,
"x": 0,
"y": 17
},
"hiddenSeries": false,
"id": 54,
"legend": {
"alignAsTable": true,
"avg": true,
"current": false,
"max": true,
"min": true,
"rightSide": false,
"show": true,
"sort": "avg",
"sortDesc": true,
"total": false,
"values": true
},
"lines": true,
"linewidth": 2,
"links": [
{
"title": "Server Status Variables (table_open_cache)",
"url": "http://dev.mysql.com/doc/refman/5.6/en/server-system-variables.html#sysvar_table_open_cache"
}
],
"nullPointMode": "null",
"percentage": false,
"pluginVersion": "7.1.5",
"pointradius": 5,
"points": false,
"renderer": "flot",
"seriesOverrides": [
{
"alias": "Opened Table Definitions",
"yaxis": 2
}
],
"spaceLength": 10,
"stack": false,
"steppedLine": false,
"targets": [
{
"calculatedInterval": "2m",
"datasourceErrors": {},
"errors": {},
"expr": "mysql_global_status_open_table_definitions{instance="$host"}",
"format": "time_series",
"interval": "$interval",
"intervalFactor": 1,
"legendFormat": "Open Table Definitions",
"metric": "",
"refId": "B",
"step": 20
},
{
"calculatedInterval": "2m",
"datasourceErrors": {},
"errors": {},
"expr": "mysql_global_variables_table_definition_cache{instance="$host"}",
"format": "time_series",
"interval": "$interval",
"intervalFactor": 1,
"legendFormat": "Table Definitions Cache Size",
"metric": "",
"refId": "C",
"step": 20
},
{
"expr": "rate(mysql_global_status_opened_table_definitions{instance="$host"}[$interval]) or irate(mysql_global_status_opened_table_definitions{instance="$host"}[5m])",
"format": "time_series",
"interval": "$interval",
"intervalFactor": 1,
"legendFormat": "Opened Table Definitions",
"refId": "A",
"step": 20
}
],
"thresholds": [],
"timeFrom": null,
"timeRegions": [],
"timeShift": null,
"title": "MySQL Table Definition Cache",
"tooltip": {
"msResolution": false,
"shared": true,
"sort": 0,
"value_type": "individual"
},
"type": "graph",
"xaxis": {
"buckets": null,
"mode": "time",
"name": null,
"show": true,
"values": []
},
"yaxes": [
{
"format": "short",
"logBase": 1,
"max": null,
"min": 0,
"show": true
},
{
"format": "short",
"logBase": 1,
"max": null,
"min": 0,
"show": true
}
],
"yaxis": {
"align": false,
"alignLevel": null
}
},
{
"collapsed": false,
"datasource": null,
"gridPos": {
"h": 1,
"w": 24,
"x": 0,
"y": 24
},
"id": 395,
"panels": [],
"repeat": null,
"title": "System Charts",
"type": "row"
},
{
"aliasColors": {},
"bars": false,
"dashLength": 10,
"dashes": false,
"datasource": "Prometheus",
"decimals": null,
"editable": true,
"error": false,
"fieldConfig": {
"defaults": {
"custom": {}
},
"overrides": []
},
"fill": 2,
"fillGradient": 0,
"grid": {},
"gridPos": {
"h": 7,
"w": 8,
"x": 0,
"y": 25
},
"hiddenSeries": false,
"id": 31,
"legend": {
"alignAsTable": false,
"avg": true,
"current": false,
"hideEmpty": false,
"max": false,
"min": false,
"rightSide": false,
"show": true,
"sort": "avg",
"sortDesc": true,
"total": false,
"values": true
},
"lines": true,
"linewidth": 2,
"links": [],
"nullPointMode": "null",
"percentage": false,
"pluginVersion": "7.1.5",
"pointradius": 5,
"points": false,
"renderer": "flot",
"seriesOverrides": [],
"spaceLength": 10,
"stack": false,
"steppedLine": false,
"targets": [
{
"calculatedInterval": "2s",
"datasourceErrors": {},
"errors": {},
"expr": "rate(node_vmstat_pgpgin{instance="$host"}[$interval]) * 1024 or irate(node_vmstat_pgpgin{instance="$host"}[5m]) * 1024",
"interval": "$interval",
"intervalFactor": 1,
"legendFormat": "Page In",
"metric": "",
"refId": "A",
"step": 20,
"target": ""
},
{
"calculatedInterval": "2s",
"datasourceErrors": {},
"errors": {},
"expr": "rate(node_vmstat_pgpgout{instance="$host"}[$interval]) * 1024 or irate(node_vmstat_pgpgout{instance="$host"}[5m]) * 1024",
"interval": "$interval",
"intervalFactor": 1,
"legendFormat": "Page Out",
"metric": "",
"refId": "B",
"step": 20,
"target": ""
}
],
"thresholds": [],
"timeFrom": null,
"timeRegions": [],
"timeShift": null,
"title": "I/O Activity",
"tooltip": {
"msResolution": false,
"shared": true,
"sort": 0,
"value_type": "individual"
},
"type": "graph",
"xaxis": {
"buckets": null,
"mode": "time",
"name": null,
"show": true,
"values": []
},
"yaxes": [
{
"format": "Bps",
"label": "",
"logBase": 1,
"max": null,
"min": 0,
"show": true
},
{
"format": "bytes",
"logBase": 1,
"max": null,
"min": 0,
"show": true
}
],
"yaxis": {
"align": false,
"alignLevel": null
}
},
{
"aliasColors": {},
"bars": false,
"dashLength": 10,
"dashes": false,
"datasource": "Prometheus",
"decimals": null,
"editable": true,
"error": false,
"fieldConfig": {
"defaults": {
"custom": {}
},
"overrides": []
},
"fill": 6,
"fillGradient": 0,
"grid": {},
"gridPos": {
"h": 7,
"w": 8,
"x": 8,
"y": 25
},
"height": "250px",
"hiddenSeries": false,
"id": 37,
"legend": {
"alignAsTable": false,
"avg": true,
"current": false,
"hideEmpty": false,
"max": false,
"min": false,
"rightSide": false,
"show": true,
"sort": "avg",
"sortDesc": true,
"total": false,
"values": true
},
"lines": true,
"linewidth": 2,
"links": [],
"nullPointMode": "null",
"percentage": false,
"pluginVersion": "7.1.5",
"pointradius": 5,
"points": false,
"renderer": "flot",
"seriesOverrides": [],
"spaceLength": 10,
"stack": true,
"steppedLine": false,
"targets": [
{
"calculatedInterval": "2s",
"datasourceErrors": {},
"errors": {},
"expr": "node_memory_MemTotal_bytes{instance="$host"} - (node_memory_MemFree_bytes{instance="$host"} + node_memory_Buffers{instance="$host"} + node_memory_Cached{instance="$host"})",
"interval": "$interval",
"intervalFactor": 1,
"legendFormat": "Used",
"metric": "",
"refId": "A",
"step": 20,
"target": ""
},
{
"calculatedInterval": "2s",
"datasourceErrors": {},
"errors": {},
"expr": "node_memory_MemFree_bytes{instance="$host"}",
"interval": "$interval",
"intervalFactor": 1,
"legendFormat": "Free",
"metric": "",
"refId": "B",
"step": 20,
"target": ""
},
{
"calculatedInterval": "2s",
"datasourceErrors": {},
"errors": {},
"expr": "node_memory_Buffers{instance="$host"}",
"interval": "$interval",
"intervalFactor": 1,
"legendFormat": "Buffers",
"metric": "",
"refId": "D",
"step": 20,
"target": ""
},
{
"calculatedInterval": "2s",
"datasourceErrors": {},
"errors": {},
"expr": "node_memory_Cached{instance="$host"}",
"interval": "$interval",
"intervalFactor": 1,
"legendFormat": "Cached",
"metric": "",
"refId": "E",
"step": 20,
"target": ""
}
],
"thresholds": [],
"timeFrom": null,
"timeRegions": [],
"timeShift": null,
"title": "Memory Distribution",
"tooltip": {
"msResolution": false,
"shared": true,
"sort": 0,
"value_type": "individual"
},
"type": "graph",
"xaxis": {
"buckets": null,
"mode": "time",
"name": null,
"show": true,
"values": []
},
"yaxes": [
{
"format": "bytes",
"label": "",
"logBase": 1,
"max": null,
"min": 0,
"show": true
},
{
"format": "bytes",
"logBase": 1,
"max": null,
"min": 0,
"show": true
}
],
"yaxis": {
"align": false,
"alignLevel": null
}
},
{
"aliasColors": {
"Load 1m": "#58140C",
"Max Core Utilization": "#bf1b00",
"iowait": "#e24d42",
"nice": "#1f78c1",
"softirq": "#806eb7",
"system": "#eab839",
"user": "#508642"
},
"bars": false,
"dashLength": 10,
"dashes": false,
"datasource": "Prometheus",
"decimals": null,
"editable": true,
"error": false,
"fieldConfig": {
"defaults": {
"custom": {}
},
"overrides": []
},
"fill": 6,
"fillGradient": 0,
"grid": {},
"gridPos": {
"h": 7,
"w": 8,
"x": 16,
"y": 25
},
"height": "",
"hiddenSeries": false,
"id": 2,
"legend": {
"alignAsTable": false,
"avg": true,
"current": false,
"hideEmpty": true,
"hideZero": true,
"max": false,
"min": false,
"rightSide": false,
"show": true,
"sort": "avg",
"sortDesc": true,
"total": false,
"values": true
},
"lines": true,
"linewidth": 2,
"links": [],
"nullPointMode": "null",
"percentage": false,
"pluginVersion": "7.1.5",
"pointradius": 5,
"points": false,
"renderer": "flot",
"seriesOverrides": [
{
"alias": "Max Core Utilization",
"lines": false,
"pointradius": 1,
"points": true,
"stack": false
},
{
"alias": "Load 1m",
"color": "#58140C",
"fill": 2,
"stack": false,
"yaxis": 2
}
],
"spaceLength": 10,
"stack": true,
"steppedLine": false,
"targets": [
{
"calculatedInterval": "2s",
"datasourceErrors": {},
"errors": {},
"expr": "clamp_max(((avg by (mode) ( (clamp_max(rate(node_cpu_seconds_total{instance="$host",mode!="idle"}[$interval]),1)) or (clamp_max(irate(node_cpu_seconds_total{instance="$host",mode!="idle"}[5m]),1)) ))*100 or (avg_over_time(node_cpu_seconds_total_average{instance=~"$host", mode!="total", mode!="idle"}[$interval]) or avg_over_time(node_cpu_seconds_total_average{instance=~"$host", mode!="total", mode!="idle"}[5m]))),100)",
"format": "time_series",
"hide": false,
"interval": "$interval",
"intervalFactor": 1,
"legendFormat": "{{ mode }}",
"metric": "",
"refId": "A",
"step": 20
},
{
"expr": "clamp_max(max by () (sum by (cpu) ( (clamp_max(rate(node_cpu_seconds_total{instance="$host",mode!="idle",mode!="iowait"}[$interval]),1)) or (clamp_max(irate(node_cpu_seconds_total{instance="$host",mode!="idle",mode!="iowait"}[5m]),1)) ))*100,100)",
"format": "time_series",
"hide": true,
"interval": "$interval",
"intervalFactor": 1,
"legendFormat": "Max Core Utilization",
"refId": "B",
"step": 20
},
{
"expr": "node_load1{instance="$host"}",
"format": "time_series",
"hide": false,
"intervalFactor": 2,
"legendFormat": "Load 1m",
"refId": "C"
}
],
"thresholds": [],
"timeFrom": null,
"timeRegions": [],
"timeShift": null,
"title": "CPU Usage / Load",
"tooltip": {
"msResolution": false,
"shared": true,
"sort": 0,
"value_type": "individual"
},
"type": "graph",
"xaxis": {
"buckets": null,
"mode": "time",
"name": null,
"show": true,
"values": []
},
"yaxes": [
{
"decimals": 1,
"format": "percent",
"label": "",
"logBase": 1,
"max": 100,
"min": 0,
"show": true
},
{
"format": "none",
"logBase": 1,
"max": null,
"min": 0,
"show": true
}
],
"yaxis": {
"align": false,
"alignLevel": null
}
},
{
"aliasColors": {},
"bars": false,
"dashLength": 10,
"dashes": false,
"datasource": "Prometheus",
"decimals": 2,
"editable": true,
"error": false,
"fieldConfig": {
"defaults": {
"custom": {}
},
"overrides": []
},
"fill": 2,
"fillGradient": 0,
"grid": {},
"gridPos": {
"h": 7,
"w": 8,
"x": 0,
"y": 32
},
"height": "250px",
"hiddenSeries": false,
"id": 36,
"legend": {
"alignAsTable": false,
"avg": true,
"current": false,
"hideEmpty": true,
"hideZero": true,
"max": false,
"min": false,
"rightSide": false,
"show": true,
"total": false,
"values": true
},
"lines": false,
"linewidth": 2,
"links": [],
"nullPointMode": "null",
"percentage": false,
"pluginVersion": "7.1.5",
"pointradius": 1,
"points": true,
"renderer": "flot",
"seriesOverrides": [],
"spaceLength": 10,
"stack": false,
"steppedLine": false,
"targets": [
{
"calculatedInterval": "2m",
"datasourceErrors": {},
"errors": {},
"expr": "sum((rate(node_disk_read_time_seconds_total{device!~"dm-.+", instance="$host"}[$interval]) / rate(node_disk_reads_completed_total{device!~"dm-.+", instance="$host"}[$interval])) or (irate(node_disk_read_time_seconds_total{device!~"dm-.+", instance="$host"}[5m]) / irate(node_disk_reads_completed_total{device!~"dm-.+", instance="$host"}[5m]))
or avg_over_time(aws_rds_read_latency_average{instance="$host"}[$interval]) or avg_over_time(aws_rds_read_latency_average{instance="$host"}[5m]))",
"format": "time_series",
"interval": "$interval",
"intervalFactor": 1,
"legendFormat": "Read",
"metric": "",
"refId": "A",
"step": 20,
"target": ""
},
{
"calculatedInterval": "2m",
"datasourceErrors": {},
"errors": {},
"expr": "sum((rate(node_disk_write_time_seconds_total{device!~"dm-.+", instance="$host"}[$interval]) / rate(node_disk_writes_completed_total{device!~"dm-.+", instance="$host"}[$interval])) or (irate(node_disk_write_time_seconds_total{device!~"dm-.+", instance="$host"}[5m]) / irate(node_disk_writes_completed_total{device!~"dm-.+", instance="$host"}[5m])) or
avg_over_time(aws_rds_write_latency_average{instance="$host"}[$interval]) or avg_over_time(aws_rds_write_latency_average{instance="$host"}[5m]))",
"format": "time_series",
"interval": "$interval",
"intervalFactor": 1,
"legendFormat": "Write",
"metric": "",
"refId": "B",
"step": 20,
"target": ""
}
],
"thresholds": [],
"timeFrom": null,
"timeRegions": [],
"timeShift": null,
"title": "Disk Latency",
"tooltip": {
"msResolution": false,
"shared": true,
"sort": 0,
"value_type": "individual"
},
"type": "graph",
"xaxis": {
"buckets": null,
"mode": "time",
"name": null,
"show": true,
"values": []
},
"yaxes": [
{
"format": "ms",
"label": "",
"logBase": 2,
"max": null,
"min": null,
"show": true
},
{
"format": "ms",
"label": "",
"logBase": 1,
"max": null,
"min": 0,
"show": true
}
],
"yaxis": {
"align": false,
"alignLevel": null
}
},
{
"aliasColors": {},
"bars": false,
"dashLength": 10,
"dashes": false,
"datasource": "Prometheus",
"decimals": null,
"editable": true,
"error": false,
"fieldConfig": {
"defaults": {
"custom": {}
},
"overrides": []
},
"fill": 2,
"fillGradient": 0,
"grid": {},
"gridPos": {
"h": 7,
"w": 8,
"x": 8,
"y": 32
},
"height": "250px",
"hiddenSeries": false,
"id": 21,
"legend": {
"alignAsTable": false,
"avg": true,
"current": false,
"hideEmpty": false,
"max": false,
"min": false,
"rightSide": false,
"show": true,
"sort": "avg",
"sortDesc": true,
"total": false,
"values": true
},
"lines": true,
"linewidth": 2,
"links": [],
"nullPointMode": "null",
"percentage": false,
"pluginVersion": "7.1.5",
"pointradius": 5,
"points": false,
"renderer": "flot",
"seriesOverrides": [
{
"alias": "Outbound",
"transform": "negative-Y"
}
],
"spaceLength": 10,
"stack": false,
"steppedLine": false,
"targets": [
{
"calculatedInterval": "2s",
"datasourceErrors": {},
"errors": {},
"expr": "sum(rate(node_network_receive_bytes_total{instance="$host", device!="lo"}[$interval])) or sum(irate(node_network_receive_bytes_total{instance="$host", device!="lo"}[5m])) or sum(max_over_time(rdsosmetrics_network_rx{instance="$host"}[$interval])) or sum(max_over_time(rdsosmetrics_network_rx{instance="$host"}[5m])) ",
"format": "time_series",
"interval": "$interval",
"intervalFactor": 1,
"legendFormat": "Inbound",
"metric": "",
"refId": "B",
"step": 20,
"target": ""
},
{
"calculatedInterval": "2s",
"datasourceErrors": {},
"errors": {},
"expr": "sum(rate(node_network_transmit_bytes_total{instance="$host", device!="lo"}[$interval])) or sum(irate(node_network_transmit_bytes_total{instance="$host", device!="lo"}[5m])) or
sum(max_over_time(rdsosmetrics_network_tx{instance="$host"}[$interval])) or sum(max_over_time(rdsosmetrics_network_tx{instance="$host"}[5m]))",
"format": "time_series",
"interval": "$interval",
"intervalFactor": 1,
"legendFormat": "Outbound",
"metric": "",
"refId": "A",
"step": 20,
"target": ""
}
],
"thresholds": [],
"timeFrom": null,
"timeRegions": [],
"timeShift": null,
"title": "Network Traffic",
"tooltip": {
"msResolution": false,
"shared": true,
"sort": 0,
"value_type": "individual"
},
"type": "graph",
"xaxis": {
"buckets": null,
"mode": "time",
"name": null,
"show": true,
"values": []
},
"yaxes": [
{
"format": "Bps",
"label": "",
"logBase": 1,
"max": null,
"min": null,
"show": true
},
{
"format": "bytes",
"logBase": 1,
"max": null,
"min": 0,
"show": true
}
],
"yaxis": {
"align": false,
"alignLevel": null
}
},
{
"aliasColors": {},
"bars": false,
"dashLength": 10,
"dashes": false,
"datasource": "Prometheus",
"decimals": null,
"editable": true,
"error": false,
"fieldConfig": {
"defaults": {
"custom": {}
},
"overrides": []
},
"fill": 2,
"fillGradient": 0,
"grid": {},
"gridPos": {
"h": 7,
"w": 8,
"x": 16,
"y": 32
},
"hiddenSeries": false,
"id": 38,
"legend": {
"alignAsTable": false,
"avg": true,
"current": false,
"hideEmpty": false,
"max": false,
"min": false,
"rightSide": false,
"show": true,
"sort": "avg",
"sortDesc": true,
"total": false,
"values": true
},
"lines": true,
"linewidth": 2,
"links": [],
"nullPointMode": "null",
"percentage": false,
"pluginVersion": "7.1.5",
"pointradius": 5,
"points": false,
"renderer": "flot",
"seriesOverrides": [],
"spaceLength": 10,
"stack": false,
"steppedLine": false,
"targets": [
{
"calculatedInterval": "2s",
"datasourceErrors": {},
"errors": {},
"expr": "rate(node_vmstat_pswpin{instance="$host"}[$interval]) * 4096 or irate(node_vmstat_pswpin{instance="$host"}[5m]) * 4096",
"interval": "$interval",
"intervalFactor": 1,
"legendFormat": "Swap In (Reads)",
"metric": "",
"refId": "A",
"step": 20,
"target": ""
},
{
"calculatedInterval": "2s",
"datasourceErrors": {},
"errors": {},
"expr": "rate(node_vmstat_pswpout{instance="$host"}[$interval]) * 4096 or irate(node_vmstat_pswpout{instance="$host"}[5m]) * 4096",
"interval": "$interval",
"intervalFactor": 1,
"legendFormat": "Swap Out (Writes)",
"metric": "",
"refId": "B",
"step": 20,
"target": ""
}
],
"thresholds": [],
"timeFrom": null,
"timeRegions": [],
"timeShift": null,
"title": "Swap Activity",
"tooltip": {
"msResolution": false,
"shared": true,
"sort": 0,
"value_type": "individual"
},
"type": "graph",
"xaxis": {
"buckets": null,
"mode": "time",
"name": null,
"show": true,
"values": []
},
"yaxes": [
{
"format": "Bps",
"label": "",
"logBase": 1,
"max": null,
"min": 0,
"show": true
},
{
"format": "bytes",
"logBase": 1,
"max": null,
"min": 0,
"show": true
}
],
"yaxis": {
"align": false,
"alignLevel": null
}
}
],
"refresh": "1m",
"schemaVersion": 26,
"style": "dark",
"tags": [
"Percona",
"MySQL"
],
"templating": {
"list": [
{
"allFormat": "glob",
"auto": true,
"auto_count": 200,
"auto_min": "1s",
"current": {
"selected": false,
"text": "1m",
"value": "1m"
},
"datasource": "Prometheus",
"hide": 0,
"includeAll": false,
"label": "Interval",
"multi": false,
"multiFormat": "glob",
"name": "interval",
"options": [
{
"selected": false,
"text": "auto",
"value": "$__auto_interval_interval"
},
{
"selected": false,
"text": "1s",
"value": "1s"
},
{
"selected": false,
"text": "5s",
"value": "5s"
},
{
"selected": true,
"text": "1m",
"value": "1m"
},
{
"selected": false,
"text": "5m",
"value": "5m"
},
{
"selected": false,
"text": "1h",
"value": "1h"
},
{
"selected": false,
"text": "6h",
"value": "6h"
},
{
"selected": false,
"text": "1d",
"value": "1d"
}
],
"query": "1s,5s,1m,5m,1h,6h,1d",
"queryValue": "",
"refresh": 2,
"skipUrlSync": false,
"type": "interval"
},
{
"allFormat": "glob",
"allValue": null,
"current": {
"selected": true,
"text": "wikidb-10.137.10.231",
"value": "wikidb-10.137.10.231"
},
"datasource": "Prometheus",
"definition": "label_values(mysql_up{group="mysql_db"}, instance)",
"hide": 0,
"includeAll": false,
"label": "MySQL实例",
"multi": false,
"multiFormat": "regex values",
"name": "host",
"options": [],
"query": "label_values(mysql_up{group="mysql_db"}, instance)",
"refresh": 1,
"refresh_on_load": false,
"regex": "",
"skipUrlSync": false,
"sort": 1,
"tagValuesQuery": null,
"tags": [],
"tagsQuery": null,
"type": "query",
"useTags": false
}
]
},
"time": {
"from": "now-3h",
"to": "now"
},
"timepicker": {
"collapse": false,
"enable": true,
"hidden": false,
"notice": false,
"now": true,
"refresh_intervals": [
"5s",
"10s",
"30s",
"1m",
"5m",
"15m",
"30m",
"1h",
"2h",
"1d"
],
"status": "Stable",
"time_options": [
"5m",
"15m",
"1h",
"6h",
"12h",
"24h",
"2d",
"7d",
"30d"
],
"type": "timepicker"
},
"timezone": "browser",
"title": "MySQL Dashboard",
"uid": "MQWgroiiz",
"version": 24
}Linux-Dashboard
点击查看代码
{
"annotations": {
"list": [
{
"builtIn": 1,
"datasource": "-- Grafana --",
"enable": true,
"hide": true,
"iconColor": "rgba(0, 211, 255, 1)",
"name": "Annotations & Alerts",
"type": "dashboard"
}
]
},
"description": "支持 Grafana6&7,Node Exporter v0.16及以上版本",
"editable": true,
"gnetId": 8919,
"graphTooltip": 0,
"id": 82,
"iteration": 1631510860337,
"links": [
{
"icon": "external link",
"tags": [],
"targetBlank": true,
"title": "更新node_exporter",
"tooltip": "",
"type": "link",
"url": "https://github.com/prometheus/node_exporter/releases"
},
{
"icon": "external link",
"tags": [],
"targetBlank": true,
"title": "更新当前仪表板",
"tooltip": "",
"type": "link",
"url": "https://grafana.com/dashboards/8919"
},
{
"icon": "external link",
"tags": [],
"targetBlank": true,
"title": "StarsL.cn",
"tooltip": "",
"type": "link",
"url": "https://starsl.cn"
},
{
"asDropdown": true,
"icon": "external link",
"tags": [],
"targetBlank": true,
"title": "",
"type": "dashboards"
}
],
"panels": [
{
"collapsed": false,
"datasource": "Prometheus",
"gridPos": {
"h": 1,
"w": 24,
"x": 0,
"y": 0
},
"id": 187,
"panels": [],
"title": "资源总览(关联JOB项)当前选中主机:【$show_hostname】实例:$node",
"type": "row"
},
{
"columns": [],
"datasource": "Prometheus",
"description": "分区使用率、磁盘读取、磁盘写入、下载带宽、上传带宽,如果有多个网卡或者多个分区,是采集的使用率最高的网卡或者分区的数值。",
"fieldConfig": {
"defaults": {
"custom": {}
},
"overrides": []
},
"fontSize": "100%",
"gridPos": {
"h": 12,
"w": 24,
"x": 0,
"y": 1
},
"id": 185,
"pageSize": 10,
"showHeader": true,
"sort": {
"col": 19,
"desc": true
},
"styles": [
{
"alias": "主机名",
"align": "auto",
"colorMode": null,
"colors": [
"rgba(245, 54, 54, 0.9)",
"rgba(237, 129, 40, 0.89)",
"rgba(50, 172, 45, 0.97)"
],
"dateFormat": "YYYY-MM-DD HH:mm:ss",
"decimals": 1,
"link": false,
"linkTooltip": "",
"linkUrl": "",
"mappingType": 1,
"pattern": "nodename",
"thresholds": [],
"type": "string",
"unit": "bytes"
},
{
"alias": "IP(链接到明细)",
"align": "auto",
"colorMode": null,
"colors": [
"rgba(245, 54, 54, 0.9)",
"rgba(237, 129, 40, 0.89)",
"rgba(50, 172, 45, 0.97)"
],
"dateFormat": "YYYY-MM-DD HH:mm:ss",
"decimals": 2,
"link": true,
"linkTargetBlank": false,
"linkTooltip": "浏览主机明细",
"linkUrl": "/d/9CWBz0bi0/node-exporter?orgId=1&var-job=${job}&var-hostname=All&var-node=${__cell}&var-device=All",
"mappingType": 1,
"pattern": "instance",
"thresholds": [],
"type": "number",
"unit": "short"
},
{
"alias": "内存",
"align": "auto",
"colorMode": null,
"colors": [
"rgba(245, 54, 54, 0.9)",
"rgba(237, 129, 40, 0.89)",
"rgba(50, 172, 45, 0.97)"
],
"dateFormat": "YYYY-MM-DD HH:mm:ss",
"decimals": 2,
"link": false,
"mappingType": 1,
"pattern": "Value #B",
"thresholds": [],
"type": "number",
"unit": "bytes"
},
{
"alias": "CPU核",
"align": "auto",
"colorMode": null,
"colors": [
"rgba(245, 54, 54, 0.9)",
"rgba(237, 129, 40, 0.89)",
"rgba(50, 172, 45, 0.97)"
],
"dateFormat": "YYYY-MM-DD HH:mm:ss",
"decimals": null,
"mappingType": 1,
"pattern": "Value #C",
"thresholds": [],
"type": "number",
"unit": "short"
},
{
"alias": " 运行时间",
"align": "auto",
"colorMode": null,
"colors": [
"rgba(245, 54, 54, 0.9)",
"rgba(237, 129, 40, 0.89)",
"rgba(50, 172, 45, 0.97)"
],
"dateFormat": "YYYY-MM-DD HH:mm:ss",
"decimals": 2,
"mappingType": 1,
"pattern": "Value #D",
"thresholds": [],
"type": "number",
"unit": "s"
},
{
"alias": "分区使用率*",
"align": "auto",
"colorMode": "cell",
"colors": [
"rgba(50, 172, 45, 0.97)",
"rgba(237, 129, 40, 0.89)",
"rgba(245, 54, 54, 0.9)"
],
"dateFormat": "YYYY-MM-DD HH:mm:ss",
"decimals": 2,
"mappingType": 1,
"pattern": "Value #E",
"thresholds": [
"70",
"85"
],
"type": "number",
"unit": "percent"
},
{
"alias": "CPU使用率",
"align": "auto",
"colorMode": "cell",
"colors": [
"rgba(50, 172, 45, 0.97)",
"rgba(237, 129, 40, 0.89)",
"rgba(245, 54, 54, 0.9)"
],
"dateFormat": "YYYY-MM-DD HH:mm:ss",
"decimals": 2,
"mappingType": 1,
"pattern": "Value #F",
"thresholds": [
"70",
"85"
],
"type": "number",
"unit": "percent"
},
{
"alias": "内存使用率",
"align": "auto",
"colorMode": "cell",
"colors": [
"rgba(50, 172, 45, 0.97)",
"rgba(237, 129, 40, 0.89)",
"rgba(245, 54, 54, 0.9)"
],
"dateFormat": "YYYY-MM-DD HH:mm:ss",
"decimals": 2,
"mappingType": 1,
"pattern": "Value #G",
"thresholds": [
"70",
"85"
],
"type": "number",
"unit": "percent"
},
{
"alias": "磁盘读取*",
"align": "auto",
"colorMode": "cell",
"colors": [
"rgba(50, 172, 45, 0.97)",
"rgba(237, 129, 40, 0.89)",
"rgba(245, 54, 54, 0.9)"
],
"dateFormat": "YYYY-MM-DD HH:mm:ss",
"decimals": 2,
"mappingType": 1,
"pattern": "Value #H",
"thresholds": [
"10485760",
"20485760"
],
"type": "number",
"unit": "Bps"
},
{
"alias": "磁盘写入*",
"align": "auto",
"colorMode": "cell",
"colors": [
"rgba(50, 172, 45, 0.97)",
"rgba(237, 129, 40, 0.89)",
"rgba(245, 54, 54, 0.9)"
],
"dateFormat": "YYYY-MM-DD HH:mm:ss",
"decimals": 2,
"mappingType": 1,
"pattern": "Value #I",
"thresholds": [
"10485760",
"20485760"
],
"type": "number",
"unit": "Bps"
},
{
"alias": "下载带宽*",
"align": "auto",
"colorMode": "cell",
"colors": [
"rgba(50, 172, 45, 0.97)",
"rgba(237, 129, 40, 0.89)",
"rgba(245, 54, 54, 0.9)"
],
"dateFormat": "YYYY-MM-DD HH:mm:ss",
"decimals": 2,
"mappingType": 1,
"pattern": "Value #J",
"thresholds": [
"30485760",
"104857600"
],
"type": "number",
"unit": "bps"
},
{
"alias": "上传带宽*",
"align": "auto",
"colorMode": "cell",
"colors": [
"rgba(50, 172, 45, 0.97)",
"rgba(237, 129, 40, 0.89)",
"rgba(245, 54, 54, 0.9)"
],
"dateFormat": "YYYY-MM-DD HH:mm:ss",
"decimals": 2,
"mappingType": 1,
"pattern": "Value #K",
"thresholds": [
"30485760",
"104857600"
],
"type": "number",
"unit": "bps"
},
{
"alias": "5m负载",
"align": "auto",
"colorMode": null,
"colors": [
"rgba(245, 54, 54, 0.9)",
"rgba(237, 129, 40, 0.89)",
"rgba(50, 172, 45, 0.97)"
],
"dateFormat": "YYYY-MM-DD HH:mm:ss",
"decimals": 2,
"mappingType": 1,
"pattern": "Value #L",
"thresholds": [],
"type": "number",
"unit": "short"
},
{
"alias": "",
"align": "right",
"colorMode": null,
"colors": [
"rgba(245, 54, 54, 0.9)",
"rgba(237, 129, 40, 0.89)",
"rgba(50, 172, 45, 0.97)"
],
"decimals": 2,
"pattern": "/.*/",
"thresholds": [],
"type": "hidden",
"unit": "short"
}
],
"targets": [
{
"expr": "node_uname_info{job=~"$job"} - 0",
"format": "table",
"instant": true,
"interval": "",
"legendFormat": "主机名",
"refId": "A"
},
{
"expr": "sum(time() - node_boot_time_seconds{job=~"$job"})by(instance)",
"format": "table",
"hide": false,
"instant": true,
"interval": "",
"legendFormat": "运行时间",
"refId": "D"
},
{
"expr": "node_memory_MemTotal_bytes{job=~"$job"} - 0",
"format": "table",
"hide": false,
"instant": true,
"interval": "",
"legendFormat": "总内存",
"refId": "B"
},
{
"expr": "count(node_cpu_seconds_total{job=~"$job",mode='system'}) by (instance)",
"format": "table",
"hide": false,
"instant": true,
"interval": "",
"legendFormat": "总核数",
"refId": "C"
},
{
"expr": "node_load5{job=~"$job"}",
"format": "table",
"instant": true,
"interval": "",
"legendFormat": "5分钟负载",
"refId": "L"
},
{
"expr": "(1 - avg(irate(node_cpu_seconds_total{job=~"$job",mode="idle"}[5m])) by (instance)) * 100",
"format": "table",
"hide": false,
"instant": true,
"interval": "",
"legendFormat": "CPU使用率",
"refId": "F"
},
{
"expr": "(1 - (node_memory_MemAvailable_bytes{job=~"$job"} / (node_memory_MemTotal_bytes{job=~"$job"})))* 100",
"format": "table",
"hide": false,
"instant": true,
"interval": "",
"legendFormat": "内存使用率",
"refId": "G"
},
{
"expr": "max((node_filesystem_size_bytes{job=~"$job",fstype=~"ext.?|xfs"}-node_filesystem_free_bytes{job=~"$job",fstype=~"ext.?|xfs"}) *100/(node_filesystem_avail_bytes {job=~"$job",fstype=~"ext.?|xfs"}+(node_filesystem_size_bytes{job=~"$job",fstype=~"ext.?|xfs"}-node_filesystem_free_bytes{job=~"$job",fstype=~"ext.?|xfs"})))by(instance)",
"format": "table",
"hide": false,
"instant": true,
"interval": "",
"legendFormat": "分区使用率",
"refId": "E"
},
{
"expr": "max(irate(node_disk_read_bytes_total{job=~"$job"}[5m])) by (instance)",
"format": "table",
"hide": false,
"instant": true,
"interval": "",
"legendFormat": "最大读取",
"refId": "H"
},
{
"expr": "max(irate(node_disk_written_bytes_total{job=~"$job"}[5m])) by (instance)",
"format": "table",
"hide": false,
"instant": true,
"interval": "",
"legendFormat": "最大写入",
"refId": "I"
},
{
"expr": "max(irate(node_network_receive_bytes_total{job=~"$job"}[5m])*8) by (instance)",
"format": "table",
"hide": false,
"instant": true,
"interval": "",
"legendFormat": "下载带宽",
"refId": "J"
},
{
"expr": "max(irate(node_network_transmit_bytes_total{job=~"$job"}[5m])*8) by (instance)",
"format": "table",
"hide": false,
"instant": true,
"interval": "",
"legendFormat": "上传带宽",
"refId": "K"
}
],
"timeFrom": null,
"timeShift": null,
"title": "服务器资源总览表(每页10行)",
"transform": "table",
"type": "table-old"
},
{
"aliasColors": {
"192.168.200.241:9100_Total": "dark-red",
"Idle - Waiting for something to happen": "#052B51",
"guest": "#9AC48A",
"idle": "#052B51",
"iowait": "#EAB839",
"irq": "#BF1B00",
"nice": "#C15C17",
"sdb_每秒I/O操作%": "#d683ce",
"softirq": "#E24D42",
"steal": "#FCE2DE",
"system": "#508642",
"user": "#5195CE",
"磁盘花费在I/O操作占比": "#ba43a9"
},
"bars": false,
"dashLength": 10,
"dashes": false,
"datasource": "Prometheus",
"decimals": null,
"description": "",
"fieldConfig": {
"defaults": {
"custom": {},
"links": []
},
"overrides": []
},
"fill": 0,
"fillGradient": 0,
"gridPos": {
"h": 8,
"w": 8,
"x": 0,
"y": 13
},
"hiddenSeries": false,
"id": 191,
"legend": {
"alignAsTable": false,
"avg": false,
"current": true,
"hideEmpty": true,
"hideZero": true,
"max": false,
"min": false,
"rightSide": false,
"show": true,
"sideWidth": null,
"sort": "current",
"sortDesc": true,
"total": false,
"values": true
},
"lines": true,
"linewidth": 2,
"links": [],
"maxPerRow": 6,
"nullPointMode": "null",
"percentage": false,
"pluginVersion": "7.1.5",
"pointradius": 5,
"points": false,
"renderer": "flot",
"repeat": null,
"seriesOverrides": [
{
"alias": "总平均使用率",
"lines": false,
"pointradius": 1,
"points": true,
"yaxis": 2
},
{
"alias": "总核数",
"color": "#C4162A"
}
],
"spaceLength": 10,
"stack": false,
"steppedLine": false,
"targets": [
{
"expr": "count(node_cpu_seconds_total{job=~"$job", mode='system'})",
"format": "time_series",
"hide": false,
"interval": "",
"intervalFactor": 1,
"legendFormat": "总核数",
"refId": "B",
"step": 240
},
{
"expr": "sum(node_load5{job=~"$job"})",
"format": "time_series",
"hide": false,
"interval": "",
"intervalFactor": 1,
"legendFormat": "总5分钟负载",
"refId": "A",
"step": 240
},
{
"expr": "avg(1 - avg(irate(node_cpu_seconds_total{job=~"$job",mode="idle"}[5m])) by (instance)) * 100",
"format": "time_series",
"hide": false,
"interval": "30m",
"intervalFactor": 1,
"legendFormat": "总平均使用率",
"refId": "F",
"step": 240
}
],
"thresholds": [],
"timeFrom": null,
"timeRegions": [],
"timeShift": null,
"title": "$job:整体总负载与整体平均CPU使用率",
"tooltip": {
"shared": true,
"sort": 2,
"value_type": "individual"
},
"type": "graph",
"xaxis": {
"buckets": null,
"mode": "time",
"name": null,
"show": true,
"values": []
},
"yaxes": [
{
"decimals": null,
"format": "short",
"label": "总负载",
"logBase": 1,
"max": null,
"min": null,
"show": true
},
{
"decimals": 0,
"format": "percent",
"label": "平均使用率",
"logBase": 1,
"max": null,
"min": null,
"show": true
}
],
"yaxis": {
"align": false,
"alignLevel": null
}
},
{
"aliasColors": {
"192.168.200.241:9100_总内存": "dark-red",
"内存_Avaliable": "#6ED0E0",
"内存_Cached": "#EF843C",
"内存_Free": "#629E51",
"内存_Total": "#6d1f62",
"内存_Used": "#eab839",
"可用": "#9ac48a",
"总内存": "#bf1b00"
},
"bars": false,
"dashLength": 10,
"dashes": false,
"datasource": "Prometheus",
"decimals": 1,
"fieldConfig": {
"defaults": {
"custom": {},
"links": []
},
"overrides": []
},
"fill": 0,
"fillGradient": 0,
"gridPos": {
"h": 8,
"w": 8,
"x": 8,
"y": 13
},
"height": "300",
"hiddenSeries": false,
"id": 195,
"legend": {
"alignAsTable": false,
"avg": false,
"current": true,
"max": false,
"min": false,
"rightSide": false,
"show": true,
"sort": "current",
"sortDesc": false,
"total": false,
"values": true
},
"lines": true,
"linewidth": 2,
"links": [],
"nullPointMode": "null",
"percentage": false,
"pluginVersion": "7.1.5",
"pointradius": 5,
"points": false,
"renderer": "flot",
"seriesOverrides": [
{
"alias": "总内存",
"color": "#C4162A",
"fill": 0
},
{
"alias": "总平均使用率",
"lines": false,
"pointradius": 1,
"points": true,
"yaxis": 2
}
],
"spaceLength": 10,
"stack": false,
"steppedLine": false,
"targets": [
{
"expr": "sum(node_memory_MemTotal_bytes{job=~"$job"})",
"format": "time_series",
"hide": false,
"instant": false,
"interval": "",
"intervalFactor": 1,
"legendFormat": "总内存",
"refId": "A",
"step": 4
},
{
"expr": "sum(node_memory_MemTotal_bytes{job=~"$job"} - node_memory_MemAvailable_bytes{job=~"$job"})",
"format": "time_series",
"hide": false,
"interval": "",
"intervalFactor": 1,
"legendFormat": "总已用",
"refId": "B",
"step": 4
},
{
"expr": "(sum(node_memory_MemTotal_bytes{job=~"$job"} - node_memory_MemAvailable_bytes{job=~"$job"}) / sum(node_memory_MemTotal_bytes{job=~"$job"}))*100",
"format": "time_series",
"hide": false,
"interval": "30m",
"intervalFactor": 1,
"legendFormat": "总平均使用率",
"refId": "H"
}
],
"thresholds": [],
"timeFrom": null,
"timeRegions": [],
"timeShift": null,
"title": "$job:整体总内存与整体平均内存使用率",
"tooltip": {
"shared": true,
"sort": 2,
"value_type": "individual"
},
"type": "graph",
"xaxis": {
"buckets": null,
"mode": "time",
"name": null,
"show": true,
"values": []
},
"yaxes": [
{
"decimals": null,
"format": "bytes",
"label": "总内存量",
"logBase": 1,
"max": null,
"min": "0",
"show": true
},
{
"decimals": null,
"format": "percent",
"label": "平均使用率",
"logBase": 1,
"max": null,
"min": null,
"show": true
}
],
"yaxis": {
"align": false,
"alignLevel": null
}
},
{
"aliasColors": {},
"bars": false,
"dashLength": 10,
"dashes": false,
"datasource": "Prometheus",
"decimals": 1,
"description": "",
"fieldConfig": {
"defaults": {
"custom": {},
"links": []
},
"overrides": []
},
"fill": 0,
"fillGradient": 0,
"gridPos": {
"h": 8,
"w": 8,
"x": 16,
"y": 13
},
"hiddenSeries": false,
"id": 197,
"legend": {
"alignAsTable": false,
"avg": false,
"current": true,
"hideEmpty": false,
"hideZero": false,
"max": false,
"min": false,
"rightSide": false,
"show": true,
"sideWidth": null,
"sort": "current",
"sortDesc": true,
"total": false,
"values": true
},
"lines": true,
"linewidth": 2,
"links": [],
"nullPointMode": "null",
"percentage": false,
"pluginVersion": "7.1.5",
"pointradius": 5,
"points": false,
"renderer": "flot",
"seriesOverrides": [
{
"alias": "总平均使用率",
"lines": false,
"pointradius": 1,
"points": true,
"yaxis": 2
},
{
"alias": "总磁盘量",
"color": "#C4162A"
}
],
"spaceLength": 10,
"stack": false,
"steppedLine": false,
"targets": [
{
"expr": "sum(avg(node_filesystem_size_bytes{job=~"$job",fstype=~"xfs|ext.*"})by(device,instance))",
"format": "time_series",
"instant": false,
"interval": "",
"intervalFactor": 1,
"legendFormat": "总磁盘量",
"refId": "E"
},
{
"expr": "sum(avg(node_filesystem_size_bytes{job=~"$job",fstype=~"xfs|ext.*"})by(device,instance)) - sum(avg(node_filesystem_free_bytes{job=~"$job",fstype=~"xfs|ext.*"})by(device,instance))",
"format": "time_series",
"instant": false,
"interval": "",
"intervalFactor": 1,
"legendFormat": "总使用量",
"refId": "C"
},
{
"expr": "(sum(avg(node_filesystem_size_bytes{job=~"$job",fstype=~"xfs|ext.*"})by(device,instance)) - sum(avg(node_filesystem_free_bytes{job=~"$job",fstype=~"xfs|ext.*"})by(device,instance))) *100/(sum(avg(node_filesystem_avail_bytes{job=~"$job",fstype=~"xfs|ext.*"})by(device,instance))+(sum(avg(node_filesystem_size_bytes{job=~"$job",fstype=~"xfs|ext.*"})by(device,instance)) - sum(avg(node_filesystem_free_bytes{job=~"$job",fstype=~"xfs|ext.*"})by(device,instance))))",
"format": "time_series",
"instant": false,
"interval": "30m",
"intervalFactor": 1,
"legendFormat": "总平均使用率",
"refId": "A"
}
],
"thresholds": [],
"timeFrom": null,
"timeRegions": [],
"timeShift": null,
"title": "$job:整体总磁盘与整体平均磁盘使用率",
"tooltip": {
"shared": true,
"sort": 2,
"value_type": "individual"
},
"type": "graph",
"xaxis": {
"buckets": null,
"mode": "time",
"name": null,
"show": true,
"values": []
},
"yaxes": [
{
"decimals": 1,
"format": "bytes",
"label": "总磁盘量",
"logBase": 1,
"max": null,
"min": "0",
"show": true
},
{
"decimals": null,
"format": "percent",
"label": "平均使用率",
"logBase": 1,
"max": null,
"min": null,
"show": true
}
],
"yaxis": {
"align": false,
"alignLevel": null
}
},
{
"collapsed": false,
"datasource": "Prometheus",
"gridPos": {
"h": 1,
"w": 24,
"x": 0,
"y": 21
},
"id": 189,
"panels": [],
"title": "资源明细:【$show_hostname】",
"type": "row"
},
{
"cacheTimeout": null,
"colorBackground": false,
"colorPostfix": false,
"colorPrefix": false,
"colorValue": true,
"colors": [
"rgba(245, 54, 54, 0.9)",
"rgba(237, 129, 40, 0.89)",
"rgba(50, 172, 45, 0.97)"
],
"datasource": "Prometheus",
"decimals": 0,
"description": "",
"fieldConfig": {
"defaults": {
"custom": {}
},
"overrides": []
},
"format": "s",
"gauge": {
"maxValue": 100,
"minValue": 0,
"show": false,
"threshcisLabels": false,
"threshcisMarkers": true
},
"gridPos": {
"h": 2,
"w": 3,
"x": 0,
"y": 22
},
"hideTimeOverride": true,
"id": 15,
"interval": null,
"links": [],
"mappingType": 1,
"mappingTypes": [
{
"name": "value to text",
"value": 1
},
{
"name": "range to text",
"value": 2
}
],
"maxDataPoints": 100,
"nullPointMode": "null",
"nullText": null,
"pluginVersion": "6.4.2",
"postfix": "",
"postfixFontSize": "50%",
"prefix": "",
"prefixFontSize": "50%",
"rangeMaps": [
{
"from": "null",
"text": "N/A",
"to": "null"
}
],
"sparkline": {
"fillColor": "rgba(31, 118, 189, 0.18)",
"full": false,
"lineColor": "rgb(31, 120, 193)",
"show": false
},
"tableColumn": "",
"targets": [
{
"expr": "avg(time() - node_boot_time_seconds{instance=~"$node"})",
"format": "time_series",
"hide": false,
"instant": true,
"interval": "",
"intervalFactor": 1,
"legendFormat": "",
"refId": "A",
"step": 40
}
],
"threshciss": "1,2",
"thresholds": "1,3",
"title": "运行时间",
"type": "singlestat",
"valueFontSize": "70%",
"valueMaps": [
{
"op": "=",
"text": "N/A",
"value": "null"
}
],
"valueName": "current"
},
{
"datasource": "Prometheus",
"fieldConfig": {
"defaults": {
"color": {
"mode": "thresholds"
},
"custom": {},
"decimals": 1,
"displayName": "",
"mappings": [
{
"from": "",
"id": 1,
"operator": "",
"text": "N/A",
"to": "",
"type": 1,
"value": "0"
}
],
"max": 100,
"min": 0.1,
"thresholds": {
"mode": "absolute",
"steps": [
{
"color": "green",
"value": null
},
{
"color": "#EAB839",
"value": 70
},
{
"color": "red",
"value": 90
}
]
},
"unit": "percent"
},
"overrides": []
},
"gridPos": {
"h": 6,
"w": 3,
"x": 3,
"y": 22
},
"id": 177,
"options": {
"displayMode": "lcd",
"orientation": "horizontal",
"reduceOptions": {
"calcs": [
"last"
],
"fields": "",
"values": false
},
"showUnfilled": true
},
"pluginVersion": "7.1.5",
"targets": [
{
"expr": "100 - (avg(irate(node_cpu_seconds_total{instance=~"$node",mode="idle"}[5m])) * 100)",
"instant": true,
"interval": "",
"legendFormat": "总CPU使用率",
"refId": "A"
},
{
"expr": "avg(irate(node_cpu_seconds_total{instance=~"$node",mode="iowait"}[5m])) * 100",
"hide": true,
"instant": true,
"interval": "",
"legendFormat": "IOwait使用率",
"refId": "C"
},
{
"expr": "(1 - (node_memory_MemAvailable_bytes{instance=~"$node"} / (node_memory_MemTotal_bytes{instance=~"$node"})))* 100",
"instant": true,
"interval": "",
"legendFormat": "内存使用率",
"refId": "B"
},
{
"expr": "(node_filesystem_size_bytes{instance=~'$node',fstype=~"ext.*|xfs",mountpoint="$maxmount"}-node_filesystem_free_bytes{instance=~'$node',fstype=~"ext.*|xfs",mountpoint="$maxmount"})*100 /(node_filesystem_avail_bytes {instance=~'$node',fstype=~"ext.*|xfs",mountpoint="$maxmount"}+(node_filesystem_size_bytes{instance=~'$node',fstype=~"ext.*|xfs",mountpoint="$maxmount"}-node_filesystem_free_bytes{instance=~'$node',fstype=~"ext.*|xfs",mountpoint="$maxmount"}))",
"hide": false,
"instant": true,
"interval": "",
"legendFormat": "最大分区({{mountpoint}})使用率",
"refId": "D"
},
{
"expr": "(1 - ((node_memory_SwapFree_bytes{instance=~"$node"} + 1)/ (node_memory_SwapTotal_bytes{instance=~"$node"} + 1))) * 100",
"instant": true,
"legendFormat": "交换分区使用率",
"refId": "F"
}
],
"timeFrom": null,
"timeShift": null,
"title": "",
"type": "bargauge"
},
{
"columns": [],
"datasource": "Prometheus",
"description": "本看板中的:磁盘总量、使用量、可用量、使用率保持和df命令的Size、Used、Avail、Use% 列的值一致,并且Use%的值会四舍五入保留一位小数,会更加准确。
注:df中Use%算法为:(size - free) * 100 / (avail + (size - free)),结果是整除则为该值,非整除则为该值+1,结果的单位是%。
参考df命令源码:",
"fieldConfig": {
"defaults": {
"custom": {}
},
"overrides": []
},
"fontSize": "100%",
"gridPos": {
"h": 6,
"w": 9,
"x": 6,
"y": 22
},
"id": 181,
"links": [
{
"targetBlank": true,
"title": "https://github.com/coreutils/coreutils/blob/master/src/df.c",
"url": "https://github.com/coreutils/coreutils/blob/master/src/df.c"
}
],
"pageSize": null,
"scroll": true,
"showHeader": true,
"sort": {
"col": 6,
"desc": false
},
"styles": [
{
"alias": "分区",
"align": "auto",
"colorMode": null,
"colors": [
"rgba(50, 172, 45, 0.97)",
"rgba(237, 129, 40, 0.89)",
"rgba(245, 54, 54, 0.9)"
],
"dateFormat": "YYYY-MM-DD HH:mm:ss",
"decimals": 2,
"mappingType": 1,
"pattern": "mountpoint",
"thresholds": [
""
],
"type": "string",
"unit": "bytes"
},
{
"alias": "可用空间",
"align": "auto",
"colorMode": "value",
"colors": [
"rgba(245, 54, 54, 0.9)",
"rgba(237, 129, 40, 0.89)",
"rgba(50, 172, 45, 0.97)"
],
"dateFormat": "YYYY-MM-DD HH:mm:ss",
"decimals": 1,
"mappingType": 1,
"pattern": "Value #A",
"thresholds": [
"10000000000",
"20000000000"
],
"type": "number",
"unit": "bytes"
},
{
"alias": "使用率",
"align": "auto",
"colorMode": "cell",
"colors": [
"rgba(50, 172, 45, 0.97)",
"rgba(237, 129, 40, 0.89)",
"rgba(245, 54, 54, 0.9)"
],
"dateFormat": "YYYY-MM-DD HH:mm:ss",
"decimals": 1,
"mappingType": 1,
"pattern": "Value #B",
"thresholds": [
"70",
"85"
],
"type": "number",
"unit": "percent"
},
{
"alias": "总空间",
"align": "auto",
"colorMode": null,
"colors": [
"rgba(245, 54, 54, 0.9)",
"rgba(237, 129, 40, 0.89)",
"rgba(50, 172, 45, 0.97)"
],
"dateFormat": "YYYY-MM-DD HH:mm:ss",
"decimals": 0,
"link": false,
"mappingType": 1,
"pattern": "Value #C",
"thresholds": [],
"type": "number",
"unit": "bytes"
},
{
"alias": "文件系统",
"align": "auto",
"colorMode": null,
"colors": [
"rgba(245, 54, 54, 0.9)",
"rgba(237, 129, 40, 0.89)",
"rgba(50, 172, 45, 0.97)"
],
"dateFormat": "YYYY-MM-DD HH:mm:ss",
"decimals": 2,
"link": false,
"mappingType": 1,
"pattern": "fstype",
"thresholds": [],
"type": "string",
"unit": "short"
},
{
"alias": "设备名",
"align": "auto",
"colorMode": null,
"colors": [
"rgba(245, 54, 54, 0.9)",
"rgba(237, 129, 40, 0.89)",
"rgba(50, 172, 45, 0.97)"
],
"dateFormat": "YYYY-MM-DD HH:mm:ss",
"decimals": 2,
"link": false,
"mappingType": 1,
"pattern": "device",
"preserveFormat": false,
"sanitize": false,
"thresholds": [],
"type": "string",
"unit": "short"
},
{
"alias": "",
"align": "auto",
"colorMode": null,
"colors": [
"rgba(245, 54, 54, 0.9)",
"rgba(237, 129, 40, 0.89)",
"rgba(50, 172, 45, 0.97)"
],
"decimals": 2,
"pattern": "/.*/",
"preserveFormat": true,
"sanitize": false,
"thresholds": [],
"type": "hidden",
"unit": "short"
}
],
"targets": [
{
"expr": "node_filesystem_size_bytes{instance=~'$node',fstype=~"ext.*|xfs",mountpoint !~".*pod.*"}-0",
"format": "table",
"hide": false,
"instant": true,
"interval": "",
"intervalFactor": 1,
"legendFormat": "总量",
"refId": "C"
},
{
"expr": "node_filesystem_avail_bytes {instance=~'$node',fstype=~"ext.*|xfs",mountpoint !~".*pod.*"}-0",
"format": "table",
"hide": false,
"instant": true,
"interval": "10s",
"intervalFactor": 1,
"legendFormat": "",
"refId": "A"
},
{
"expr": "(node_filesystem_size_bytes{instance=~'$node',fstype=~"ext.*|xfs",mountpoint !~".*pod.*"}-node_filesystem_free_bytes{instance=~'$node',fstype=~"ext.*|xfs",mountpoint !~".*pod.*"}) *100/(node_filesystem_avail_bytes {instance=~'$node',fstype=~"ext.*|xfs",mountpoint !~".*pod.*"}+(node_filesystem_size_bytes{instance=~'$node',fstype=~"ext.*|xfs",mountpoint !~".*pod.*"}-node_filesystem_free_bytes{instance=~'$node',fstype=~"ext.*|xfs",mountpoint !~".*pod.*"}))",
"format": "table",
"hide": false,
"instant": true,
"interval": "",
"intervalFactor": 1,
"legendFormat": "",
"refId": "B"
}
],
"title": "【$show_hostname】:各分区可用空间(EXT.*/XFS)",
"transform": "table",
"type": "table-old"
},
{
"cacheTimeout": null,
"colorBackground": false,
"colorPostfix": false,
"colorValue": true,
"colors": [
"rgba(245, 54, 54, 0.9)",
"rgba(237, 129, 40, 0.89)",
"rgba(50, 172, 45, 0.97)"
],
"datasource": "Prometheus",
"decimals": null,
"description": "",
"fieldConfig": {
"defaults": {
"custom": {}
},
"overrides": []
},
"format": "short",
"gauge": {
"maxValue": 100,
"minValue": 0,
"show": false,
"thresholdLabels": false,
"thresholdMarkers": true
},
"gridPos": {
"h": 2,
"w": 3,
"x": 15,
"y": 22
},
"id": 179,
"interval": null,
"links": [],
"mappingType": 1,
"mappingTypes": [
{
"name": "value to text",
"value": 1
},
{
"name": "range to text",
"value": 2
}
],
"maxDataPoints": 100,
"maxPerRow": 6,
"nullPointMode": "null",
"nullText": null,
"postfix": "",
"postfixFontSize": "50%",
"prefix": "",
"prefixFontSize": "50%",
"rangeMaps": [
{
"from": "null",
"text": "N/A",
"to": "null"
}
],
"sparkline": {
"fillColor": "rgba(31, 118, 189, 0.18)",
"full": false,
"lineColor": "rgb(31, 120, 193)",
"show": false
},
"tableColumn": "",
"targets": [
{
"expr": "avg(node_filesystem_files_free{instance=~"$node",mountpoint="$maxmount",fstype=~"ext.?|xfs"})",
"format": "time_series",
"instant": true,
"interval": "",
"intervalFactor": 1,
"legendFormat": "",
"refId": "A",
"step": 20
}
],
"thresholds": "100000,1000000",
"title": "剩余节点数:$maxmount ",
"type": "singlestat",
"valueFontSize": "70%",
"valueMaps": [
{
"op": "=",
"text": "N/A",
"value": "null"
}
],
"valueName": "current"
},
{
"aliasColors": {
"cn-shenzhen.i-wz9cq1dcb6zwc39ehw59_cni0_in": "light-red",
"cn-shenzhen.i-wz9cq1dcb6zwc39ehw59_cni0_in下载": "green",
"cn-shenzhen.i-wz9cq1dcb6zwc39ehw59_cni0_out上传": "yellow",
"cn-shenzhen.i-wz9cq1dcb6zwc39ehw59_eth0_in下载": "purple",
"cn-shenzhen.i-wz9cq1dcb6zwc39ehw59_eth0_out": "purple",
"cn-shenzhen.i-wz9cq1dcb6zwc39ehw59_eth0_out上传": "blue"
},
"bars": true,
"dashLength": 10,
"dashes": false,
"datasource": "Prometheus",
"editable": true,
"error": false,
"fieldConfig": {
"defaults": {
"custom": {},
"links": []
},
"overrides": []
},
"fill": 1,
"fillGradient": 0,
"grid": {},
"gridPos": {
"h": 6,
"w": 6,
"x": 18,
"y": 22
},
"hiddenSeries": false,
"id": 183,
"legend": {
"alignAsTable": true,
"avg": true,
"current": true,
"hideEmpty": true,
"hideZero": true,
"max": true,
"min": false,
"show": false,
"sort": "current",
"sortDesc": true,
"total": true,
"values": true
},
"lines": false,
"linewidth": 2,
"links": [],
"nullPointMode": "null as zero",
"percentage": false,
"pluginVersion": "7.1.5",
"pointradius": 1,
"points": false,
"renderer": "flot",
"repeat": null,
"seriesOverrides": [
{
"alias": "/.*_out上传$/",
"transform": "negative-Y"
}
],
"spaceLength": 10,
"stack": false,
"steppedLine": false,
"targets": [
{
"expr": "increase(node_network_receive_bytes_total{instance=~"$node",device=~"$device"}[60m])",
"interval": "60m",
"intervalFactor": 1,
"legendFormat": "{{device}}_in下载",
"metric": "",
"refId": "A",
"step": 600,
"target": ""
},
{
"expr": "increase(node_network_transmit_bytes_total{instance=~"$node",device=~"$device"}[60m])",
"hide": false,
"interval": "60m",
"intervalFactor": 1,
"legendFormat": "{{device}}_out上传",
"refId": "B",
"step": 600
}
],
"thresholds": [],
"timeFrom": null,
"timeRegions": [],
"timeShift": null,
"title": "每小时流量$device",
"tooltip": {
"msResolution": false,
"shared": true,
"sort": 0,
"value_type": "cumulative"
},
"type": "graph",
"xaxis": {
"buckets": null,
"mode": "time",
"name": null,
"show": true,
"values": []
},
"yaxes": [
{
"format": "bytes",
"label": "上传(-)/下载(+)",
"logBase": 1,
"max": null,
"min": null,
"show": true
},
{
"format": "short",
"logBase": 1,
"max": null,
"min": null,
"show": false
}
],
"yaxis": {
"align": false,
"alignLevel": null
}
},
{
"cacheTimeout": null,
"colorBackground": false,
"colorPostfix": false,
"colorValue": true,
"colors": [
"rgba(245, 54, 54, 0.9)",
"rgba(237, 129, 40, 0.89)",
"rgba(50, 172, 45, 0.97)"
],
"datasource": "Prometheus",
"description": "",
"fieldConfig": {
"defaults": {
"custom": {}
},
"overrides": []
},
"format": "short",
"gauge": {
"maxValue": 100,
"minValue": 0,
"show": false,
"thresholdLabels": false,
"thresholdMarkers": true
},
"gridPos": {
"h": 2,
"w": 3,
"x": 0,
"y": 24
},
"id": 14,
"interval": null,
"links": [],
"mappingType": 1,
"mappingTypes": [
{
"name": "value to text",
"value": 1
},
{
"name": "range to text",
"value": 2
}
],
"maxDataPoints": 100,
"maxPerRow": 6,
"nullPointMode": "null",
"nullText": null,
"postfix": "",
"postfixFontSize": "50%",
"prefix": "",
"prefixFontSize": "50%",
"rangeMaps": [
{
"from": "null",
"text": "N/A",
"to": "null"
}
],
"sparkline": {
"fillColor": "rgba(31, 118, 189, 0.18)",
"full": false,
"lineColor": "rgb(31, 120, 193)",
"show": false
},
"tableColumn": "",
"targets": [
{
"expr": "count(node_cpu_seconds_total{instance=~"$node", mode='system'})",
"format": "time_series",
"instant": true,
"interval": "",
"intervalFactor": 1,
"legendFormat": "",
"refId": "A",
"step": 20
}
],
"thresholds": "1,2",
"title": "CPU 核数",
"type": "singlestat",
"valueFontSize": "80%",
"valueMaps": [
{
"op": "=",
"text": "N/A",
"value": "null"
}
],
"valueName": "current"
},
{
"cacheTimeout": null,
"colorBackground": false,
"colorValue": true,
"colors": [
"rgba(50, 172, 45, 0.97)",
"rgba(237, 129, 40, 0.89)",
"#d44a3a"
],
"datasource": "Prometheus",
"decimals": 2,
"description": "",
"fieldConfig": {
"defaults": {
"custom": {}
},
"overrides": []
},
"format": "percent",
"gauge": {
"maxValue": 100,
"minValue": 0,
"show": false,
"thresholdLabels": false,
"thresholdMarkers": true
},
"gridPos": {
"h": 2,
"w": 3,
"x": 15,
"y": 24
},
"id": 20,
"interval": null,
"links": [],
"mappingType": 1,
"mappingTypes": [
{
"name": "value to text",
"value": 1
},
{
"name": "range to text",
"value": 2
}
],
"maxDataPoints": 100,
"nullPointMode": "connected",
"nullText": null,
"pluginVersion": "6.4.2",
"postfix": "",
"postfixFontSize": "50%",
"prefix": "",
"prefixFontSize": "50%",
"rangeMaps": [
{
"from": "null",
"text": "N/A",
"to": "null"
}
],
"sparkline": {
"fillColor": "rgba(31, 118, 189, 0.18)",
"full": true,
"lineColor": "#3274D9",
"show": true,
"ymax": null,
"ymin": null
},
"tableColumn": "",
"targets": [
{
"expr": "avg(irate(node_cpu_seconds_total{instance=~"$node",mode="iowait"}[5m])) * 100",
"format": "time_series",
"hide": false,
"instant": false,
"interval": "",
"intervalFactor": 1,
"legendFormat": "",
"refId": "A",
"step": 20
}
],
"thresholds": "20,50",
"timeFrom": null,
"timeShift": null,
"title": "CPU iowait",
"type": "singlestat",
"valueFontSize": "80%",
"valueMaps": [
{
"op": "=",
"text": "N/A",
"value": "null"
}
],
"valueName": "avg"
},
{
"cacheTimeout": null,
"colorBackground": false,
"colorValue": true,
"colors": [
"rgba(245, 54, 54, 0.9)",
"rgba(237, 129, 40, 0.89)",
"rgba(50, 172, 45, 0.97)"
],
"datasource": "Prometheus",
"decimals": 0,
"description": "",
"fieldConfig": {
"defaults": {
"custom": {}
},
"overrides": []
},
"format": "bytes",
"gauge": {
"maxValue": 100,
"minValue": 0,
"show": false,
"thresholdLabels": false,
"thresholdMarkers": true
},
"gridPos": {
"h": 2,
"w": 3,
"x": 0,
"y": 26
},
"id": 75,
"interval": null,
"links": [],
"mappingType": 1,
"mappingTypes": [
{
"name": "value to text",
"value": 1
},
{
"name": "range to text",
"value": 2
}
],
"maxDataPoints": 100,
"maxPerRow": 6,
"nullPointMode": "null",
"nullText": null,
"postfix": "",
"postfixFontSize": "70%",
"prefix": "",
"prefixFontSize": "50%",
"rangeMaps": [
{
"from": "null",
"text": "N/A",
"to": "null"
}
],
"sparkline": {
"fillColor": "rgba(31, 118, 189, 0.18)",
"full": false,
"lineColor": "rgb(31, 120, 193)",
"show": false
},
"tableColumn": "",
"targets": [
{
"expr": "sum(node_memory_MemTotal_bytes{instance=~"$node"})",
"format": "time_series",
"instant": true,
"interval": "",
"intervalFactor": 1,
"legendFormat": "{{instance}}",
"refId": "A",
"step": 20
}
],
"thresholds": "2,3",
"title": "总内存",
"type": "singlestat",
"valueFontSize": "80%",
"valueMaps": [
{
"op": "=",
"text": "N/A",
"value": "null"
}
],
"valueName": "current"
},
{
"cacheTimeout": null,
"colorBackground": false,
"colorPostfix": false,
"colorValue": true,
"colors": [
"rgba(245, 54, 54, 0.9)",
"rgba(237, 129, 40, 0.89)",
"rgba(50, 172, 45, 0.97)"
],
"datasource": "Prometheus",
"decimals": null,
"description": "",
"fieldConfig": {
"defaults": {
"custom": {}
},
"overrides": []
},
"format": "locale",
"gauge": {
"maxValue": 100,
"minValue": 0,
"show": false,
"thresholdLabels": false,
"thresholdMarkers": true
},
"gridPos": {
"h": 2,
"w": 3,
"x": 15,
"y": 26
},
"id": 178,
"interval": null,
"links": [],
"mappingType": 1,
"mappingTypes": [
{
"name": "value to text",
"value": 1
},
{
"name": "range to text",
"value": 2
}
],
"maxDataPoints": 100,
"maxPerRow": 6,
"nullPointMode": "null",
"nullText": null,
"postfix": "",
"postfixFontSize": "50%",
"prefix": "",
"prefixFontSize": "50%",
"rangeMaps": [
{
"from": "null",
"text": "N/A",
"to": "null"
}
],
"sparkline": {
"fillColor": "rgba(31, 118, 189, 0.18)",
"full": false,
"lineColor": "rgb(31, 120, 193)",
"show": false
},
"tableColumn": "",
"targets": [
{
"expr": "avg(node_filefd_maximum{instance=~"$node"})",
"format": "time_series",
"instant": true,
"intervalFactor": 1,
"legendFormat": "",
"refId": "A",
"step": 20
}
],
"thresholds": "1024,10000",
"title": "总文件描述符",
"type": "singlestat",
"valueFontSize": "70%",
"valueMaps": [
{
"op": "=",
"text": "N/A",
"value": "null"
}
],
"valueName": "current"
},
{
"aliasColors": {
"192.168.200.241:9100_Total": "dark-red",
"Idle - Waiting for something to happen": "#052B51",
"guest": "#9AC48A",
"idle": "#052B51",
"iowait": "#EAB839",
"irq": "#BF1B00",
"nice": "#C15C17",
"sdb_每秒I/O操作%": "#d683ce",
"softirq": "#E24D42",
"steal": "#FCE2DE",
"system": "#508642",
"user": "#5195CE",
"磁盘花费在I/O操作占比": "#ba43a9"
},
"bars": false,
"dashLength": 10,
"dashes": false,
"datasource": "Prometheus",
"decimals": 2,
"description": "",
"fieldConfig": {
"defaults": {
"custom": {},
"links": []
},
"overrides": []
},
"fill": 1,
"fillGradient": 0,
"gridPos": {
"h": 8,
"w": 8,
"x": 0,
"y": 28
},
"hiddenSeries": false,
"id": 7,
"legend": {
"alignAsTable": true,
"avg": true,
"current": true,
"hideEmpty": true,
"hideZero": true,
"max": true,
"min": true,
"rightSide": false,
"show": true,
"sideWidth": null,
"sort": "current",
"sortDesc": true,
"total": false,
"values": true
},
"lines": true,
"linewidth": 2,
"links": [],
"maxPerRow": 6,
"nullPointMode": "null",
"percentage": false,
"pluginVersion": "7.1.5",
"pointradius": 5,
"points": false,
"renderer": "flot",
"repeat": null,
"seriesOverrides": [
{
"alias": "/.*总使用率/",
"color": "#C4162A",
"fill": 0
}
],
"spaceLength": 10,
"stack": false,
"steppedLine": false,
"targets": [
{
"expr": "avg(irate(node_cpu_seconds_total{instance=~"$node",mode="system"}[5m])) by (instance) *100",
"format": "time_series",
"hide": false,
"instant": false,
"interval": "",
"intervalFactor": 1,
"legendFormat": "系统使用率",
"refId": "A",
"step": 20
},
{
"expr": "avg(irate(node_cpu_seconds_total{instance=~"$node",mode="user"}[5m])) by (instance) *100",
"format": "time_series",
"hide": false,
"interval": "",
"intervalFactor": 1,
"legendFormat": "用户使用率",
"refId": "B",
"step": 240
},
{
"expr": "avg(irate(node_cpu_seconds_total{instance=~"$node",mode="iowait"}[5m])) by (instance) *100",
"format": "time_series",
"hide": false,
"instant": false,
"interval": "",
"intervalFactor": 1,
"legendFormat": "磁盘IO使用率",
"refId": "D",
"step": 240
},
{
"expr": "(1 - avg(irate(node_cpu_seconds_total{instance=~"$node",mode="idle"}[5m])) by (instance))*100",
"format": "time_series",
"hide": false,
"interval": "",
"intervalFactor": 1,
"legendFormat": "总使用率",
"refId": "F",
"step": 240
}
],
"thresholds": [],
"timeFrom": null,
"timeRegions": [],
"timeShift": null,
"title": "CPU使用率",
"tooltip": {
"shared": true,
"sort": 2,
"value_type": "individual"
},
"type": "graph",
"xaxis": {
"buckets": null,
"mode": "time",
"name": null,
"show": true,
"values": []
},
"yaxes": [
{
"decimals": 0,
"format": "percent",
"label": "",
"logBase": 1,
"max": null,
"min": null,
"show": true
},
{
"format": "short",
"label": null,
"logBase": 1,
"max": null,
"min": null,
"show": false
}
],
"yaxis": {
"align": false,
"alignLevel": null
}
},
{
"aliasColors": {
"192.168.200.241:9100_总内存": "dark-red",
"使用率": "yellow",
"内存_Avaliable": "#6ED0E0",
"内存_Cached": "#EF843C",
"内存_Free": "#629E51",
"内存_Total": "#6d1f62",
"内存_Used": "#eab839",
"可用": "#9ac48a",
"总内存": "#bf1b00"
},
"bars": false,
"dashLength": 10,
"dashes": false,
"datasource": "Prometheus",
"decimals": 2,
"fieldConfig": {
"defaults": {
"custom": {},
"links": []
},
"overrides": []
},
"fill": 1,
"fillGradient": 0,
"gridPos": {
"h": 8,
"w": 8,
"x": 8,
"y": 28
},
"height": "300",
"hiddenSeries": false,
"id": 156,
"legend": {
"alignAsTable": true,
"avg": true,
"current": true,
"hideEmpty": true,
"hideZero": true,
"max": true,
"min": true,
"rightSide": false,
"show": true,
"sort": "current",
"sortDesc": true,
"total": false,
"values": true
},
"lines": true,
"linewidth": 2,
"links": [],
"nullPointMode": "null",
"percentage": false,
"pluginVersion": "7.1.5",
"pointradius": 5,
"points": false,
"renderer": "flot",
"seriesOverrides": [
{
"alias": "总内存",
"color": "#C4162A",
"fill": 0
},
{
"alias": "使用率",
"color": "rgb(0, 209, 255)",
"lines": false,
"pointradius": 1,
"points": true,
"yaxis": 2
}
],
"spaceLength": 10,
"stack": false,
"steppedLine": false,
"targets": [
{
"expr": "node_memory_MemTotal_bytes{instance=~"$node"}",
"format": "time_series",
"hide": false,
"instant": false,
"interval": "",
"intervalFactor": 1,
"legendFormat": "总内存",
"refId": "A",
"step": 4
},
{
"expr": "node_memory_MemTotal_bytes{instance=~"$node"} - node_memory_MemAvailable_bytes{instance=~"$node"}",
"format": "time_series",
"hide": false,
"interval": "",
"intervalFactor": 1,
"legendFormat": "已用",
"refId": "B",
"step": 4
},
{
"expr": "node_memory_MemAvailable_bytes{instance=~"$node"}",
"format": "time_series",
"hide": false,
"interval": "",
"intervalFactor": 1,
"legendFormat": "可用",
"refId": "F",
"step": 4
},
{
"expr": "node_memory_Buffers_bytes{instance=~"$node"}",
"format": "time_series",
"hide": true,
"intervalFactor": 1,
"legendFormat": "内存_Buffers",
"refId": "D",
"step": 4
},
{
"expr": "node_memory_MemFree_bytes{instance=~"$node"}",
"format": "time_series",
"hide": true,
"intervalFactor": 1,
"legendFormat": "内存_Free",
"refId": "C",
"step": 4
},
{
"expr": "node_memory_Cached_bytes{instance=~"$node"}",
"format": "time_series",
"hide": true,
"intervalFactor": 1,
"legendFormat": "内存_Cached",
"refId": "E",
"step": 4
},
{
"expr": "node_memory_MemTotal_bytes{instance=~"$node"} - (node_memory_Cached_bytes{instance=~"$node"} + node_memory_Buffers_bytes{instance=~"$node"} + node_memory_MemFree_bytes{instance=~"$node"})",
"format": "time_series",
"hide": true,
"intervalFactor": 1,
"refId": "G"
},
{
"expr": "(1 - (node_memory_MemAvailable_bytes{instance=~"$node"} / (node_memory_MemTotal_bytes{instance=~"$node"})))* 100",
"format": "time_series",
"hide": false,
"interval": "30m",
"intervalFactor": 10,
"legendFormat": "使用率",
"refId": "H"
}
],
"thresholds": [],
"timeFrom": null,
"timeRegions": [],
"timeShift": null,
"title": "内存信息",
"tooltip": {
"shared": true,
"sort": 2,
"value_type": "individual"
},
"type": "graph",
"xaxis": {
"buckets": null,
"mode": "time",
"name": null,
"show": true,
"values": []
},
"yaxes": [
{
"format": "bytes",
"label": null,
"logBase": 1,
"max": null,
"min": "0",
"show": true
},
{
"format": "percent",
"label": "内存使用率",
"logBase": 1,
"max": "100",
"min": "0",
"show": true
}
],
"yaxis": {
"align": false,
"alignLevel": null
}
},
{
"aliasColors": {
"192.168.10.227:9100_em1_in下载": "super-light-green",
"192.168.10.227:9100_em1_out上传": "dark-blue"
},
"bars": false,
"dashLength": 10,
"dashes": false,
"datasource": "Prometheus",
"decimals": 2,
"fieldConfig": {
"defaults": {
"custom": {},
"links": []
},
"overrides": []
},
"fill": 1,
"fillGradient": 0,
"gridPos": {
"h": 8,
"w": 8,
"x": 16,
"y": 28
},
"height": "300",
"hiddenSeries": false,
"id": 157,
"legend": {
"alignAsTable": true,
"avg": true,
"current": true,
"hideEmpty": true,
"hideZero": true,
"max": true,
"min": true,
"rightSide": false,
"show": true,
"sort": "current",
"sortDesc": true,
"total": false,
"values": true
},
"lines": true,
"linewidth": 1,
"links": [],
"nullPointMode": "null",
"percentage": false,
"pluginVersion": "7.1.5",
"pointradius": 2,
"points": false,
"renderer": "flot",
"seriesOverrides": [
{
"alias": "/.*_out上传$/",
"transform": "negative-Y"
}
],
"spaceLength": 10,
"stack": false,
"steppedLine": false,
"targets": [
{
"expr": "irate(node_network_receive_bytes_total{instance=~'$node',device=~"$device"}[5m])*8",
"format": "time_series",
"interval": "",
"intervalFactor": 1,
"legendFormat": "{{device}}_in下载",
"refId": "A",
"step": 4
},
{
"expr": "irate(node_network_transmit_bytes_total{instance=~'$node',device=~"$device"}[5m])*8",
"format": "time_series",
"interval": "",
"intervalFactor": 1,
"legendFormat": "{{device}}_out上传",
"refId": "B",
"step": 4
}
],
"thresholds": [],
"timeFrom": null,
"timeRegions": [],
"timeShift": null,
"title": "每秒网络带宽使用$device",
"tooltip": {
"shared": true,
"sort": 2,
"value_type": "individual"
},
"type": "graph",
"xaxis": {
"buckets": null,
"mode": "time",
"name": null,
"show": true,
"values": []
},
"yaxes": [
{
"format": "bps",
"label": "上传(-)/下载(+)",
"logBase": 1,
"max": null,
"min": null,
"show": true
},
{
"format": "short",
"label": null,
"logBase": 1,
"max": null,
"min": null,
"show": false
}
],
"yaxis": {
"align": false,
"alignLevel": null
}
},
{
"aliasColors": {
"15分钟": "#6ED0E0",
"1分钟": "#BF1B00",
"5分钟": "#CCA300"
},
"bars": false,
"dashLength": 10,
"dashes": false,
"datasource": "Prometheus",
"decimals": 2,
"editable": true,
"error": false,
"fieldConfig": {
"defaults": {
"custom": {},
"links": []
},
"overrides": []
},
"fill": 1,
"fillGradient": 1,
"grid": {},
"gridPos": {
"h": 8,
"w": 8,
"x": 0,
"y": 36
},
"height": "300",
"hiddenSeries": false,
"id": 13,
"legend": {
"alignAsTable": true,
"avg": true,
"current": true,
"hideEmpty": true,
"hideZero": true,
"max": true,
"min": true,
"rightSide": false,
"show": true,
"sort": "current",
"sortDesc": true,
"total": false,
"values": true
},
"lines": true,
"linewidth": 2,
"links": [],
"maxPerRow": 6,
"nullPointMode": "null as zero",
"percentage": false,
"pluginVersion": "7.1.5",
"pointradius": 5,
"points": false,
"renderer": "flot",
"repeat": null,
"seriesOverrides": [
{
"alias": "/.*总核数/",
"color": "#C4162A"
}
],
"spaceLength": 10,
"stack": false,
"steppedLine": false,
"targets": [
{
"expr": "node_load1{instance=~"$node"}",
"format": "time_series",
"instant": false,
"interval": "",
"intervalFactor": 1,
"legendFormat": "1分钟负载",
"metric": "",
"refId": "A",
"step": 20,
"target": ""
},
{
"expr": "node_load5{instance=~"$node"}",
"format": "time_series",
"instant": false,
"interval": "",
"intervalFactor": 1,
"legendFormat": "5分钟负载",
"refId": "B",
"step": 20
},
{
"expr": "node_load15{instance=~"$node"}",
"format": "time_series",
"instant": false,
"interval": "",
"intervalFactor": 1,
"legendFormat": "15分钟负载",
"refId": "C",
"step": 20
},
{
"expr": " sum(count(node_cpu_seconds_total{instance=~"$node", mode='system'}) by (cpu,instance)) by(instance)",
"format": "time_series",
"instant": false,
"interval": "",
"intervalFactor": 1,
"legendFormat": "CPU总核数",
"refId": "D",
"step": 20
}
],
"thresholds": [],
"timeFrom": null,
"timeRegions": [],
"timeShift": null,
"title": "系统平均负载",
"tooltip": {
"msResolution": false,
"shared": true,
"sort": 2,
"value_type": "cumulative"
},
"type": "graph",
"xaxis": {
"buckets": null,
"mode": "time",
"name": null,
"show": true,
"values": []
},
"yaxes": [
{
"format": "short",
"logBase": 1,
"max": null,
"min": null,
"show": true
},
{
"format": "short",
"logBase": 1,
"max": null,
"min": null,
"show": true
}
],
"yaxis": {
"align": false,
"alignLevel": null
}
},
{
"aliasColors": {
"vda_write": "#6ED0E0"
},
"bars": false,
"dashLength": 10,
"dashes": false,
"datasource": "Prometheus",
"decimals": 2,
"description": "Read bytes 每个磁盘分区每秒读取的比特数
Written bytes 每个磁盘分区每秒写入的比特数",
"fieldConfig": {
"defaults": {
"custom": {},
"links": []
},
"overrides": []
},
"fill": 1,
"fillGradient": 1,
"gridPos": {
"h": 8,
"w": 8,
"x": 8,
"y": 36
},
"height": "300",
"hiddenSeries": false,
"id": 168,
"legend": {
"alignAsTable": true,
"avg": true,
"current": true,
"hideEmpty": true,
"hideZero": true,
"max": true,
"min": true,
"show": true,
"sort": "current",
"sortDesc": true,
"total": false,
"values": true
},
"lines": true,
"linewidth": 2,
"links": [],
"nullPointMode": "null",
"percentage": false,
"pluginVersion": "7.1.5",
"pointradius": 5,
"points": false,
"renderer": "flot",
"seriesOverrides": [
{
"alias": "/.*_读取$/",
"transform": "negative-Y"
}
],
"spaceLength": 10,
"stack": false,
"steppedLine": false,
"targets": [
{
"expr": "irate(node_disk_read_bytes_total{instance=~"$node"}[5m])",
"format": "time_series",
"interval": "",
"intervalFactor": 1,
"legendFormat": "{{device}}_读取",
"refId": "A",
"step": 10
},
{
"expr": "irate(node_disk_written_bytes_total{instance=~"$node"}[5m])",
"format": "time_series",
"hide": false,
"interval": "",
"intervalFactor": 1,
"legendFormat": "{{device}}_写入",
"refId": "B",
"step": 10
}
],
"thresholds": [],
"timeFrom": null,
"timeRegions": [],
"timeShift": null,
"title": "每秒磁盘读写容量",
"tooltip": {
"shared": true,
"sort": 2,
"value_type": "individual"
},
"type": "graph",
"xaxis": {
"buckets": null,
"mode": "time",
"name": null,
"show": true,
"values": []
},
"yaxes": [
{
"decimals": null,
"format": "Bps",
"label": "读取(-)/写入(+)",
"logBase": 1,
"max": null,
"min": null,
"show": true
},
{
"format": "short",
"label": null,
"logBase": 1,
"max": null,
"min": null,
"show": false
}
],
"yaxis": {
"align": false,
"alignLevel": null
}
},
{
"aliasColors": {},
"bars": false,
"dashLength": 10,
"dashes": false,
"datasource": "Prometheus",
"decimals": 1,
"description": "",
"fieldConfig": {
"defaults": {
"custom": {},
"links": []
},
"overrides": []
},
"fill": 0,
"fillGradient": 0,
"gridPos": {
"h": 8,
"w": 8,
"x": 16,
"y": 36
},
"hiddenSeries": false,
"id": 174,
"legend": {
"alignAsTable": true,
"avg": true,
"current": true,
"hideEmpty": true,
"hideZero": true,
"max": true,
"min": true,
"rightSide": false,
"show": true,
"sideWidth": null,
"sort": "current",
"sortDesc": true,
"total": false,
"values": true
},
"lines": true,
"linewidth": 2,
"links": [],
"nullPointMode": "null",
"percentage": false,
"pluginVersion": "7.1.5",
"pointradius": 5,
"points": false,
"renderer": "flot",
"seriesOverrides": [
{
"alias": "/Inodes.*/",
"yaxis": 2
}
],
"spaceLength": 10,
"stack": false,
"steppedLine": false,
"targets": [
{
"expr": "(node_filesystem_size_bytes{instance=~'$node',fstype=~"ext.*|xfs",mountpoint !~".*pod.*"}-node_filesystem_free_bytes{instance=~'$node',fstype=~"ext.*|xfs",mountpoint !~".*pod.*"}) *100/(node_filesystem_avail_bytes {instance=~'$node',fstype=~"ext.*|xfs",mountpoint !~".*pod.*"}+(node_filesystem_size_bytes{instance=~'$node',fstype=~"ext.*|xfs",mountpoint !~".*pod.*"}-node_filesystem_free_bytes{instance=~'$node',fstype=~"ext.*|xfs",mountpoint !~".*pod.*"}))",
"format": "time_series",
"instant": false,
"interval": "",
"intervalFactor": 1,
"legendFormat": "{{mountpoint}}",
"refId": "A"
},
{
"expr": "node_filesystem_files_free{instance=~'$node',fstype=~"ext.?|xfs"} / node_filesystem_files{instance=~'$node',fstype=~"ext.?|xfs"}",
"hide": true,
"interval": "",
"legendFormat": "Inodes:{{instance}}:{{mountpoint}}",
"refId": "B"
}
],
"thresholds": [],
"timeFrom": null,
"timeRegions": [],
"timeShift": null,
"title": "磁盘使用率",
"tooltip": {
"shared": true,
"sort": 2,
"value_type": "individual"
},
"type": "graph",
"xaxis": {
"buckets": null,
"mode": "time",
"name": null,
"show": true,
"values": []
},
"yaxes": [
{
"decimals": null,
"format": "percent",
"label": "",
"logBase": 1,
"max": "100",
"min": "0",
"show": true
},
{
"decimals": 2,
"format": "percentunit",
"label": null,
"logBase": 1,
"max": "1",
"min": null,
"show": false
}
],
"yaxis": {
"align": false,
"alignLevel": null
}
},
{
"aliasColors": {
"vda_write": "#6ED0E0"
},
"bars": false,
"dashLength": 10,
"dashes": false,
"datasource": "Prometheus",
"decimals": 2,
"description": "Reads completed: 每个磁盘分区每秒读完成次数
Writes completed: 每个磁盘分区每秒写完成次数
IO now 每个磁盘分区每秒正在处理的输入/输出请求数",
"fieldConfig": {
"defaults": {
"custom": {},
"links": []
},
"overrides": []
},
"fill": 0,
"fillGradient": 0,
"gridPos": {
"h": 9,
"w": 8,
"x": 0,
"y": 44
},
"height": "300",
"hiddenSeries": false,
"id": 161,
"legend": {
"alignAsTable": true,
"avg": true,
"current": true,
"hideEmpty": true,
"hideZero": true,
"max": true,
"min": true,
"show": true,
"sort": "current",
"sortDesc": true,
"total": false,
"values": true
},
"lines": true,
"linewidth": 1,
"links": [],
"nullPointMode": "null",
"percentage": false,
"pluginVersion": "7.1.5",
"pointradius": 5,
"points": false,
"renderer": "flot",
"seriesOverrides": [
{
"alias": "/.*_读取$/",
"transform": "negative-Y"
}
],
"spaceLength": 10,
"stack": false,
"steppedLine": false,
"targets": [
{
"expr": "irate(node_disk_reads_completed_total{instance=~"$node"}[5m])",
"format": "time_series",
"hide": false,
"interval": "",
"intervalFactor": 1,
"legendFormat": "{{device}}_读取",
"refId": "A",
"step": 10
},
{
"expr": "irate(node_disk_writes_completed_total{instance=~"$node"}[5m])",
"format": "time_series",
"hide": false,
"interval": "",
"intervalFactor": 1,
"legendFormat": "{{device}}_写入",
"refId": "B",
"step": 10
},
{
"expr": "node_disk_io_now{instance=~"$node"}",
"format": "time_series",
"hide": true,
"interval": "",
"intervalFactor": 1,
"legendFormat": "{{device}}",
"refId": "C"
}
],
"thresholds": [],
"timeFrom": null,
"timeRegions": [],
"timeShift": null,
"title": "磁盘读写速率(IOPS)",
"tooltip": {
"shared": true,
"sort": 2,
"value_type": "individual"
},
"type": "graph",
"xaxis": {
"buckets": null,
"mode": "time",
"name": null,
"show": true,
"values": []
},
"yaxes": [
{
"decimals": null,
"format": "iops",
"label": "读取(-)/写入(+)I/O ops/sec",
"logBase": 1,
"max": null,
"min": null,
"show": true
},
{
"format": "short",
"label": null,
"logBase": 1,
"max": null,
"min": null,
"show": true
}
],
"yaxis": {
"align": false,
"alignLevel": null
}
},
{
"aliasColors": {
"Idle - Waiting for something to happen": "#052B51",
"guest": "#9AC48A",
"idle": "#052B51",
"iowait": "#EAB839",
"irq": "#BF1B00",
"nice": "#C15C17",
"sdb_每秒I/O操作%": "#d683ce",
"softirq": "#E24D42",
"steal": "#FCE2DE",
"system": "#508642",
"user": "#5195CE",
"磁盘花费在I/O操作占比": "#ba43a9"
},
"bars": false,
"dashLength": 10,
"dashes": false,
"datasource": "Prometheus",
"decimals": null,
"description": "每一秒钟的自然时间内,花费在I/O上的耗时。(wall-clock time)
node_disk_io_time_seconds_total:
磁盘花费在输入/输出操作上的秒数。该值为累加值。(Milliseconds Spent Doing I/Os)
irate(node_disk_io_time_seconds_total[1m]):
计算每秒的速率:(last值-last前一个值)/时间戳差值,即:1秒钟内磁盘花费在I/O操作的时间占比。",
"fieldConfig": {
"defaults": {
"custom": {},
"links": []
},
"overrides": []
},
"fill": 1,
"fillGradient": 0,
"gridPos": {
"h": 9,
"w": 8,
"x": 8,
"y": 44
},
"hiddenSeries": false,
"id": 175,
"legend": {
"alignAsTable": true,
"avg": true,
"current": true,
"hideEmpty": true,
"hideZero": true,
"max": true,
"min": false,
"rightSide": false,
"show": true,
"sideWidth": null,
"sort": null,
"sortDesc": null,
"total": false,
"values": true
},
"lines": true,
"linewidth": 1,
"links": [],
"maxPerRow": 6,
"nullPointMode": "null",
"percentage": false,
"pluginVersion": "7.1.5",
"pointradius": 5,
"points": false,
"renderer": "flot",
"seriesOverrides": [],
"spaceLength": 10,
"stack": false,
"steppedLine": false,
"targets": [
{
"expr": "irate(node_disk_io_time_seconds_total{instance=~"$node"}[5m])",
"format": "time_series",
"interval": "",
"intervalFactor": 1,
"legendFormat": "{{device}}_每秒I/O操作%",
"refId": "C"
}
],
"thresholds": [],
"timeFrom": null,
"timeRegions": [],
"timeShift": null,
"title": "每1秒内I/O操作耗时占比",
"tooltip": {
"shared": true,
"sort": 2,
"value_type": "individual"
},
"type": "graph",
"xaxis": {
"buckets": null,
"mode": "time",
"name": null,
"show": true,
"values": []
},
"yaxes": [
{
"decimals": null,
"format": "percentunit",
"label": "",
"logBase": 1,
"max": null,
"min": null,
"show": true
},
{
"format": "short",
"label": null,
"logBase": 1,
"max": null,
"min": null,
"show": false
}
],
"yaxis": {
"align": false,
"alignLevel": null
}
},
{
"aliasColors": {
"vda": "#6ED0E0"
},
"bars": false,
"dashLength": 10,
"dashes": false,
"datasource": "Prometheus",
"decimals": 2,
"description": "Read time seconds 每个磁盘分区读操作花费的秒数
Write time seconds 每个磁盘分区写操作花费的秒数
IO time seconds 每个磁盘分区输入/输出操作花费的秒数
IO time weighted seconds每个磁盘分区输入/输出操作花费的加权秒数",
"fieldConfig": {
"defaults": {
"custom": {},
"links": []
},
"overrides": []
},
"fill": 1,
"fillGradient": 1,
"gridPos": {
"h": 9,
"w": 8,
"x": 16,
"y": 44
},
"height": "300",
"hiddenSeries": false,
"id": 160,
"legend": {
"alignAsTable": true,
"avg": true,
"current": true,
"hideEmpty": true,
"hideZero": true,
"max": true,
"min": true,
"show": true,
"sort": "current",
"sortDesc": true,
"total": false,
"values": true
},
"lines": true,
"linewidth": 2,
"links": [],
"nullPointMode": "null as zero",
"percentage": false,
"pluginVersion": "7.1.5",
"pointradius": 5,
"points": false,
"renderer": "flot",
"seriesOverrides": [
{
"alias": "/,*_读取$/",
"transform": "negative-Y"
}
],
"spaceLength": 10,
"stack": false,
"steppedLine": false,
"targets": [
{
"expr": "irate(node_disk_read_time_seconds_total{instance=~"$node"}[5m]) / irate(node_disk_reads_completed_total{instance=~"$node"}[5m])",
"format": "time_series",
"hide": false,
"instant": false,
"interval": "",
"intervalFactor": 1,
"legendFormat": "{{device}}_读取",
"refId": "B"
},
{
"expr": "irate(node_disk_write_time_seconds_total{instance=~"$node"}[5m]) / irate(node_disk_writes_completed_total{instance=~"$node"}[5m])",
"format": "time_series",
"hide": false,
"instant": false,
"interval": "",
"intervalFactor": 1,
"legendFormat": "{{device}}_写入",
"refId": "C"
},
{
"expr": "irate(node_disk_io_time_seconds_total{instance=~"$node"}[5m])",
"format": "time_series",
"hide": true,
"interval": "",
"intervalFactor": 1,
"legendFormat": "{{device}}",
"refId": "A",
"step": 10
},
{
"expr": "irate(node_disk_io_time_weighted_seconds_total{instance=~"$node"}[5m])",
"format": "time_series",
"hide": true,
"interval": "",
"intervalFactor": 1,
"legendFormat": "{{device}}_加权",
"refId": "D"
}
],
"thresholds": [],
"timeFrom": null,
"timeRegions": [],
"timeShift": null,
"title": "每次IO读写的耗时(参考:小于100ms)(beta)",
"tooltip": {
"shared": true,
"sort": 2,
"value_type": "individual"
},
"type": "graph",
"xaxis": {
"buckets": null,
"mode": "time",
"name": null,
"show": true,
"values": []
},
"yaxes": [
{
"format": "s",
"label": "读取(-)/写入(+)",
"logBase": 1,
"max": null,
"min": null,
"show": true
},
{
"format": "short",
"label": null,
"logBase": 1,
"max": null,
"min": null,
"show": false
}
],
"yaxis": {
"align": false,
"alignLevel": null
}
},
{
"aliasColors": {
"192.168.200.241:9100_TCP_alloc": "semi-dark-blue",
"TCP": "#6ED0E0",
"TCP_alloc": "blue"
},
"bars": false,
"dashLength": 10,
"dashes": false,
"datasource": "Prometheus",
"decimals": 2,
"description": "Sockets_used - 已使用的所有协议套接字总量
CurrEstab - 当前状态为 ESTABLISHED 或 CLOSE-WAIT 的 TCP 连接数
TCP_alloc - 已分配(已建立、已申请到sk_buff)的TCP套接字数量
TCP_tw - 等待关闭的TCP连接数
UDP_inuse - 正在使用的 UDP 套接字数量
RetransSegs - TCP 重传报文数
OutSegs - TCP 发送的报文数
InSegs - TCP 接收的报文数",
"fieldConfig": {
"defaults": {
"custom": {},
"links": []
},
"overrides": []
},
"fill": 0,
"fillGradient": 0,
"gridPos": {
"h": 8,
"w": 16,
"x": 0,
"y": 53
},
"height": "300",
"hiddenSeries": false,
"id": 158,
"interval": "",
"legend": {
"alignAsTable": true,
"avg": false,
"current": true,
"hideEmpty": true,
"hideZero": true,
"max": true,
"min": false,
"rightSide": true,
"show": true,
"sideWidth": null,
"sort": "current",
"sortDesc": true,
"total": false,
"values": true
},
"lines": true,
"linewidth": 1,
"links": [],
"nullPointMode": "null",
"percentage": false,
"pluginVersion": "7.1.5",
"pointradius": 5,
"points": false,
"renderer": "flot",
"seriesOverrides": [
{
"alias": "/.*Sockets_used/",
"color": "#E02F44",
"lines": false,
"pointradius": 1,
"points": true,
"yaxis": 2
}
],
"spaceLength": 10,
"stack": false,
"steppedLine": false,
"targets": [
{
"expr": "node_netstat_Tcp_CurrEstab{instance=~'$node'}",
"format": "time_series",
"hide": false,
"instant": false,
"interval": "",
"intervalFactor": 1,
"legendFormat": "CurrEstab",
"refId": "A",
"step": 20
},
{
"expr": "node_sockstat_TCP_tw{instance=~'$node'}",
"format": "time_series",
"interval": "",
"intervalFactor": 1,
"legendFormat": "TCP_tw",
"refId": "D"
},
{
"expr": "node_sockstat_sockets_used{instance=~'$node'}",
"hide": false,
"interval": "30m",
"intervalFactor": 1,
"legendFormat": "Sockets_used",
"refId": "B"
},
{
"expr": "node_sockstat_UDP_inuse{instance=~'$node'}",
"interval": "",
"legendFormat": "UDP_inuse",
"refId": "C"
},
{
"expr": "node_sockstat_TCP_alloc{instance=~'$node'}",
"interval": "",
"legendFormat": "TCP_alloc",
"refId": "E"
},
{
"expr": "irate(node_netstat_Tcp_PassiveOpens{instance=~'$node'}[5m])",
"hide": true,
"interval": "",
"legendFormat": "{{instance}}_Tcp_PassiveOpens",
"refId": "G"
},
{
"expr": "irate(node_netstat_Tcp_ActiveOpens{instance=~'$node'}[5m])",
"hide": true,
"interval": "",
"legendFormat": "{{instance}}_Tcp_ActiveOpens",
"refId": "F"
},
{
"expr": "irate(node_netstat_Tcp_InSegs{instance=~'$node'}[5m])",
"interval": "",
"legendFormat": "Tcp_InSegs",
"refId": "H"
},
{
"expr": "irate(node_netstat_Tcp_OutSegs{instance=~'$node'}[5m])",
"interval": "",
"legendFormat": "Tcp_OutSegs",
"refId": "I"
},
{
"expr": "irate(node_netstat_Tcp_RetransSegs{instance=~'$node'}[5m])",
"hide": false,
"interval": "",
"legendFormat": "Tcp_RetransSegs",
"refId": "J"
},
{
"expr": "irate(node_netstat_TcpExt_ListenDrops{instance=~'$node'}[5m])",
"hide": true,
"interval": "",
"legendFormat": "",
"refId": "K"
}
],
"thresholds": [],
"timeFrom": null,
"timeRegions": [],
"timeShift": null,
"title": "网络Socket连接信息",
"tooltip": {
"shared": true,
"sort": 2,
"value_type": "individual"
},
"transformations": [],
"type": "graph",
"xaxis": {
"buckets": null,
"mode": "time",
"name": null,
"show": true,
"values": []
},
"yaxes": [
{
"format": "short",
"label": null,
"logBase": 1,
"max": null,
"min": null,
"show": true
},
{
"format": "short",
"label": "已使用的所有协议套接字总量",
"logBase": 1,
"max": null,
"min": null,
"show": true
}
],
"yaxis": {
"align": false,
"alignLevel": null
}
},
{
"aliasColors": {
"filefd_192.168.200.241:9100": "super-light-green",
"switches_192.168.200.241:9100": "semi-dark-red",
"使用的文件描述符_10.118.72.128:9100": "red",
"每秒上下文切换次数_10.118.71.245:9100": "yellow",
"每秒上下文切换次数_10.118.72.128:9100": "yellow"
},
"bars": false,
"cacheTimeout": null,
"dashLength": 10,
"dashes": false,
"datasource": "Prometheus",
"description": "",
"fieldConfig": {
"defaults": {
"custom": {},
"links": []
},
"overrides": []
},
"fill": 0,
"fillGradient": 1,
"gridPos": {
"h": 8,
"w": 8,
"x": 16,
"y": 53
},
"hiddenSeries": false,
"hideTimeOverride": false,
"id": 16,
"legend": {
"alignAsTable": false,
"avg": false,
"current": true,
"max": false,
"min": false,
"rightSide": false,
"show": true,
"total": false,
"values": true
},
"lines": true,
"linewidth": 2,
"links": [],
"nullPointMode": "null",
"percentage": false,
"pluginVersion": "7.1.5",
"pointradius": 1,
"points": false,
"renderer": "flot",
"seriesOverrides": [
{
"alias": "/每秒上下文切换次数.*/",
"color": "#FADE2A",
"lines": false,
"pointradius": 1,
"points": true,
"yaxis": 2
},
{
"alias": "/使用的文件描述符.*/",
"color": "#F2495C"
}
],
"spaceLength": 10,
"stack": false,
"steppedLine": false,
"targets": [
{
"expr": "node_filefd_allocated{instance=~"$node"}",
"format": "time_series",
"instant": false,
"interval": "",
"intervalFactor": 5,
"legendFormat": "使用的文件描述符",
"refId": "B"
},
{
"expr": "irate(node_context_switches_total{instance=~"$node"}[5m])",
"interval": "",
"intervalFactor": 5,
"legendFormat": "每秒上下文切换次数",
"refId": "A"
},
{
"expr": " (node_filefd_allocated{instance=~"$node"}/node_filefd_maximum{instance=~"$node"}) *100",
"format": "time_series",
"hide": true,
"instant": false,
"interval": "",
"intervalFactor": 5,
"legendFormat": "使用的文件描述符占比_{{instance}}",
"refId": "C"
}
],
"thresholds": [],
"timeFrom": null,
"timeRegions": [],
"timeShift": null,
"title": "打开的文件描述符(左 )/每秒上下文切换次数(右)",
"tooltip": {
"shared": true,
"sort": 2,
"value_type": "individual"
},
"type": "graph",
"xaxis": {
"buckets": null,
"mode": "time",
"name": null,
"show": true,
"values": []
},
"yaxes": [
{
"format": "short",
"label": "使用的文件描述符",
"logBase": 1,
"max": null,
"min": null,
"show": true
},
{
"format": "short",
"label": "context_switches",
"logBase": 1,
"max": null,
"min": null,
"show": true
}
],
"yaxis": {
"align": false,
"alignLevel": null
}
}
],
"refresh": "1m",
"schemaVersion": 26,
"style": "dark",
"tags": [
"Prometheus",
"node_exporter",
"StarsL.cn"
],
"templating": {
"list": [
{
"allValue": null,
"current": {
"selected": false,
"text": "mysql-host",
"value": "mysql-host"
},
"datasource": "Prometheus",
"definition": "label_values(node_uname_info, job)",
"hide": 0,
"includeAll": false,
"label": "JOB",
"multi": false,
"name": "job",
"options": [],
"query": "label_values(node_uname_info, job)",
"refresh": 1,
"regex": "",
"skipUrlSync": false,
"sort": 5,
"tagValuesQuery": "",
"tags": [],
"tagsQuery": "",
"type": "query",
"useTags": false
},
{
"allValue": null,
"current": {
"selected": false,
"text": "All",
"value": "$__all"
},
"datasource": "Prometheus",
"definition": "label_values(node_uname_info{job=~"$job"}, nodename)",
"hide": 0,
"includeAll": true,
"label": "主机名",
"multi": false,
"name": "hostname",
"options": [],
"query": "label_values(node_uname_info{job=~"$job"}, nodename)",
"refresh": 1,
"regex": "",
"skipUrlSync": false,
"sort": 5,
"tagValuesQuery": "",
"tags": [],
"tagsQuery": "",
"type": "query",
"useTags": false
},
{
"allFormat": "glob",
"allValue": null,
"current": {
"selected": true,
"tags": [],
"text": [
"wikidb-10.137.10.231"
],
"value": [
"wikidb-10.137.10.231"
]
},
"datasource": "Prometheus",
"definition": "label_values(node_uname_info{job=~"$job",nodename=~"$hostname"},instance)",
"hide": 0,
"includeAll": false,
"label": "Instance",
"multi": true,
"multiFormat": "regex values",
"name": "node",
"options": [],
"query": "label_values(node_uname_info{job=~"$job",nodename=~"$hostname"},instance)",
"refresh": 1,
"regex": "/.*-.*/",
"skipUrlSync": false,
"sort": 5,
"tagValuesQuery": "",
"tags": [],
"tagsQuery": "",
"type": "query",
"useTags": false
},
{
"allFormat": "glob",
"allValue": null,
"current": {
"selected": false,
"text": [
"All"
],
"value": [
"$__all"
]
},
"datasource": "Prometheus",
"definition": "label_values(node_network_info{device!~'tap.*|veth.*|br.*|docker.*|virbr.*|lo.*|cni.*'},device)",
"hide": 0,
"includeAll": true,
"label": "网卡",
"multi": true,
"multiFormat": "regex values",
"name": "device",
"options": [],
"query": "label_values(node_network_info{device!~'tap.*|veth.*|br.*|docker.*|virbr.*|lo.*|cni.*'},device)",
"refresh": 1,
"regex": "",
"skipUrlSync": false,
"sort": 1,
"tagValuesQuery": "",
"tags": [],
"tagsQuery": "",
"type": "query",
"useTags": false
},
{
"allValue": null,
"current": {
"selected": false,
"text": "/ichint",
"value": "/ichint"
},
"datasource": "Prometheus",
"definition": "query_result(topk(1,sort_desc (max(node_filesystem_size_bytes{instance=~'$node',fstype=~"ext.?|xfs",mountpoint!~".*pods.*"}) by (mountpoint))))",
"hide": 2,
"includeAll": false,
"label": "最大挂载目录",
"multi": false,
"name": "maxmount",
"options": [],
"query": "query_result(topk(1,sort_desc (max(node_filesystem_size_bytes{instance=~'$node',fstype=~"ext.?|xfs",mountpoint!~".*pods.*"}) by (mountpoint))))",
"refresh": 2,
"regex": "/.*\"(.*)\".*/",
"skipUrlSync": false,
"sort": 5,
"tagValuesQuery": "",
"tags": [],
"tagsQuery": "",
"type": "query",
"useTags": false
},
{
"allValue": null,
"current": {
"selected": false,
"text": "cn-conflunce",
"value": "cn-conflunce"
},
"datasource": "Prometheus",
"definition": "label_values(node_uname_info{job=~"$job",instance=~"$node"}, nodename)",
"hide": 2,
"includeAll": false,
"label": "展示使用的主机名",
"multi": false,
"name": "show_hostname",
"options": [],
"query": "label_values(node_uname_info{job=~"$job",instance=~"$node"}, nodename)",
"refresh": 1,
"regex": "",
"skipUrlSync": false,
"sort": 5,
"tagValuesQuery": "",
"tags": [],
"tagsQuery": "",
"type": "query",
"useTags": false
}
]
},
"time": {
"from": "now-3h",
"to": "now"
},
"timepicker": {
"hidden": false,
"now": true,
"refresh_intervals": [
"15s",
"30s",
"1m",
"5m",
"15m",
"30m"
],
"time_options": [
"5m",
"15m",
"1h",
"6h",
"12h",
"24h",
"2d",
"7d",
"30d"
]
},
"timezone": "browser",
"title": "Linux Dashboard",
"uid": "9CWBz0bi0",
"version": 6
}