 1  import matplotlib.pyplot as plt
 2  import matplotlib.image as mpimg
 3  import numpy as np
 4
 5  # Read in the image
 6  image = mpimg.imread('E:/spyder/a/a/test.jpg')
 7
 8  # Grab the x and y sizes and make two copies of the image
 9  # With one copy we'll extract only the pixels that meet our selection,
10  # then we'll paint those pixels red in the original image to see our selection
11  # overlaid on the original.
12  ysize = image.shape[0]
13  xsize = image.shape[1]
14  color_select= np.copy(image)
15  line_image = np.copy(image)
16
17  # Define our color criteria
18  red_threshold = 200
19  green_threshold = 200
20  blue_threshold = 200
21  rgb_threshold = [red_threshold, green_threshold, blue_threshold]
22
23  # Define a triangle region of interest (Note: if you run this code,
24  # Keep in mind the origin (x=0, y=0) is in the upper left in image processing
25  # you'll find these are not sensible values!!
26  # But you'll get a chance to play with them soon in a quiz ;)
27  left_bottom = [0, 539]
28  right_bottom = [900, 500]
29  apex = [400, 300]
30
31  fit_left = np.polyfit((left_bottom[0], apex[0]), (left_bottom[1], apex[1]), 1)
32  fit_right = np.polyfit((right_bottom[0], apex[0]), (right_bottom[1], apex[1]), 1)
33  fit_bottom = np.polyfit((left_bottom[0], right_bottom[0]), (left_bottom[1], right_bottom[1]), 1)
34
35  # Mask pixels below the threshold
36  color_thresholds = (image[:,:,0] < rgb_threshold[0]) |
37                      (image[:,:,1] < rgb_threshold[1]) |
38                      (image[:,:,2] < rgb_threshold[2])
39
40  # Find the region inside the lines
41  XX, YY = np.meshgrid(np.arange(0, xsize), np.arange(0, ysize))
42  region_thresholds = (YY > (XX*fit_left[0] + fit_left[1])) &
43                      (YY > (XX*fit_right[0] + fit_right[1])) &
44                      (YY < (XX*fit_bottom[0] + fit_bottom[1]))
45  # Mask color selection
46  color_select[color_thresholds] = [0,0,0]
47  # Find where image is both colored right and in the region
48  line_image[~color_thresholds & region_thresholds] = [255,0,0]
49
50  # Display our two output images
51  plt.imshow(line_image)
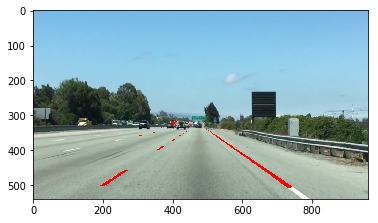
结果如下图所示
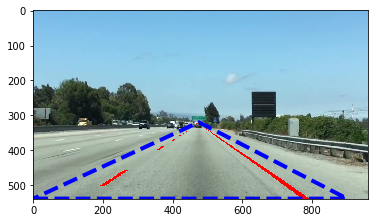
代码27~29改动为
27 left_bottom = [0, 539]
28 right_bottom = [900, 539]
29 apex = [475, 320]
结果如下图

代码51改动为
51 x=[left_bottom[0],right_bottom[0],apex[0],left_bottom[0]]
52 y=[left_bottom[1],right_bottom[1],apex[1],left_bottom[1]]
53 plt.plot(x,y,'b--',lw=4)
54 plt.imshow(line_image)
结果如下图