1.学习笔记
numpy.empty
numpy.empty 方法用来创建一个指定形状(shape)、数据类型(dtype)且未初始化的数组:
numpy.empty(shape, dtype = float, order = 'C')
ndarray对象的内容可以通过索引或切片来访问和修改,与 Python 中 list 的切片操作一样。
ndarray 数组可以基于 0 - n 的下标进行索引,切片对象可以通过内置的 slice 函数,并设置 start, stop 及 step 参数进行,从原数组中切割出一个新数组。
Matplotlib 是 Python 的绘图库。
Windows 系统安装 Matplotlib
win+R 输入cmd 打开命令提示符,输入指令:
python -m pip install -U pip setuptools
python -m pip install matplotlib
常用函数:
plt.savefig(‘test’, dpi = 600) :将绘制的图画保存成png格式,命名为 test
plt.ylabel(‘Grade’) : y轴的名称
plt.axis([-1, 10, 0, 6]) : x轴起始于-1,终止于10 ,y轴起始于0,终止于6
plt.subplot(3,2,4) : 分成3行2列,共6个绘图区域,在第4个区域绘图。排序为行优先。也可 plt.subplot(324),将逗号省略。
plt.plot(x, y, format_string, **kwargs): x为x轴数据,可为列表或数组;y同理;format_string 为控制曲线的格式字符串, **kwargs 第二组或更多的(x, y, format_string)
plt.subplot2grid(GridSpec, CurSpec, colspan=1, rowspan=1):设定网格,选中网格,确定选中行列区域数量,编号从0开始
plt.show()
2.


 1 import numpy as np
 2 import matplotlib.pyplot as plt
 3 import matplotlib
 4 labels = np.array(['first week','second week','third week','forth week','fifth week','sixth week']) # 标签
 5 dataLenth = 6 # 数据长度
 6 data1 = np.array([10,100,100,100,90,80])
 7 angles = np.linspace(0, 2*np.pi, dataLenth, endpoint=False) # 分割圆周长
 8 data1 = np.concatenate((data1, [data1[0]])) # 闭合
 9 angles = np.concatenate((angles, [angles[0]])) # 闭合
10 plt.polar(angles, data1, 'o-', linewidth=1) #做极坐标系
11 plt.fill(angles, data1, alpha=0.25)# 填充
12 plt.thetagrids(angles * 180/np.pi, labels) # 设置网格、标签
13 plt.ylim(0,100)  # polar的极值设置为ylim
14 plt.show()

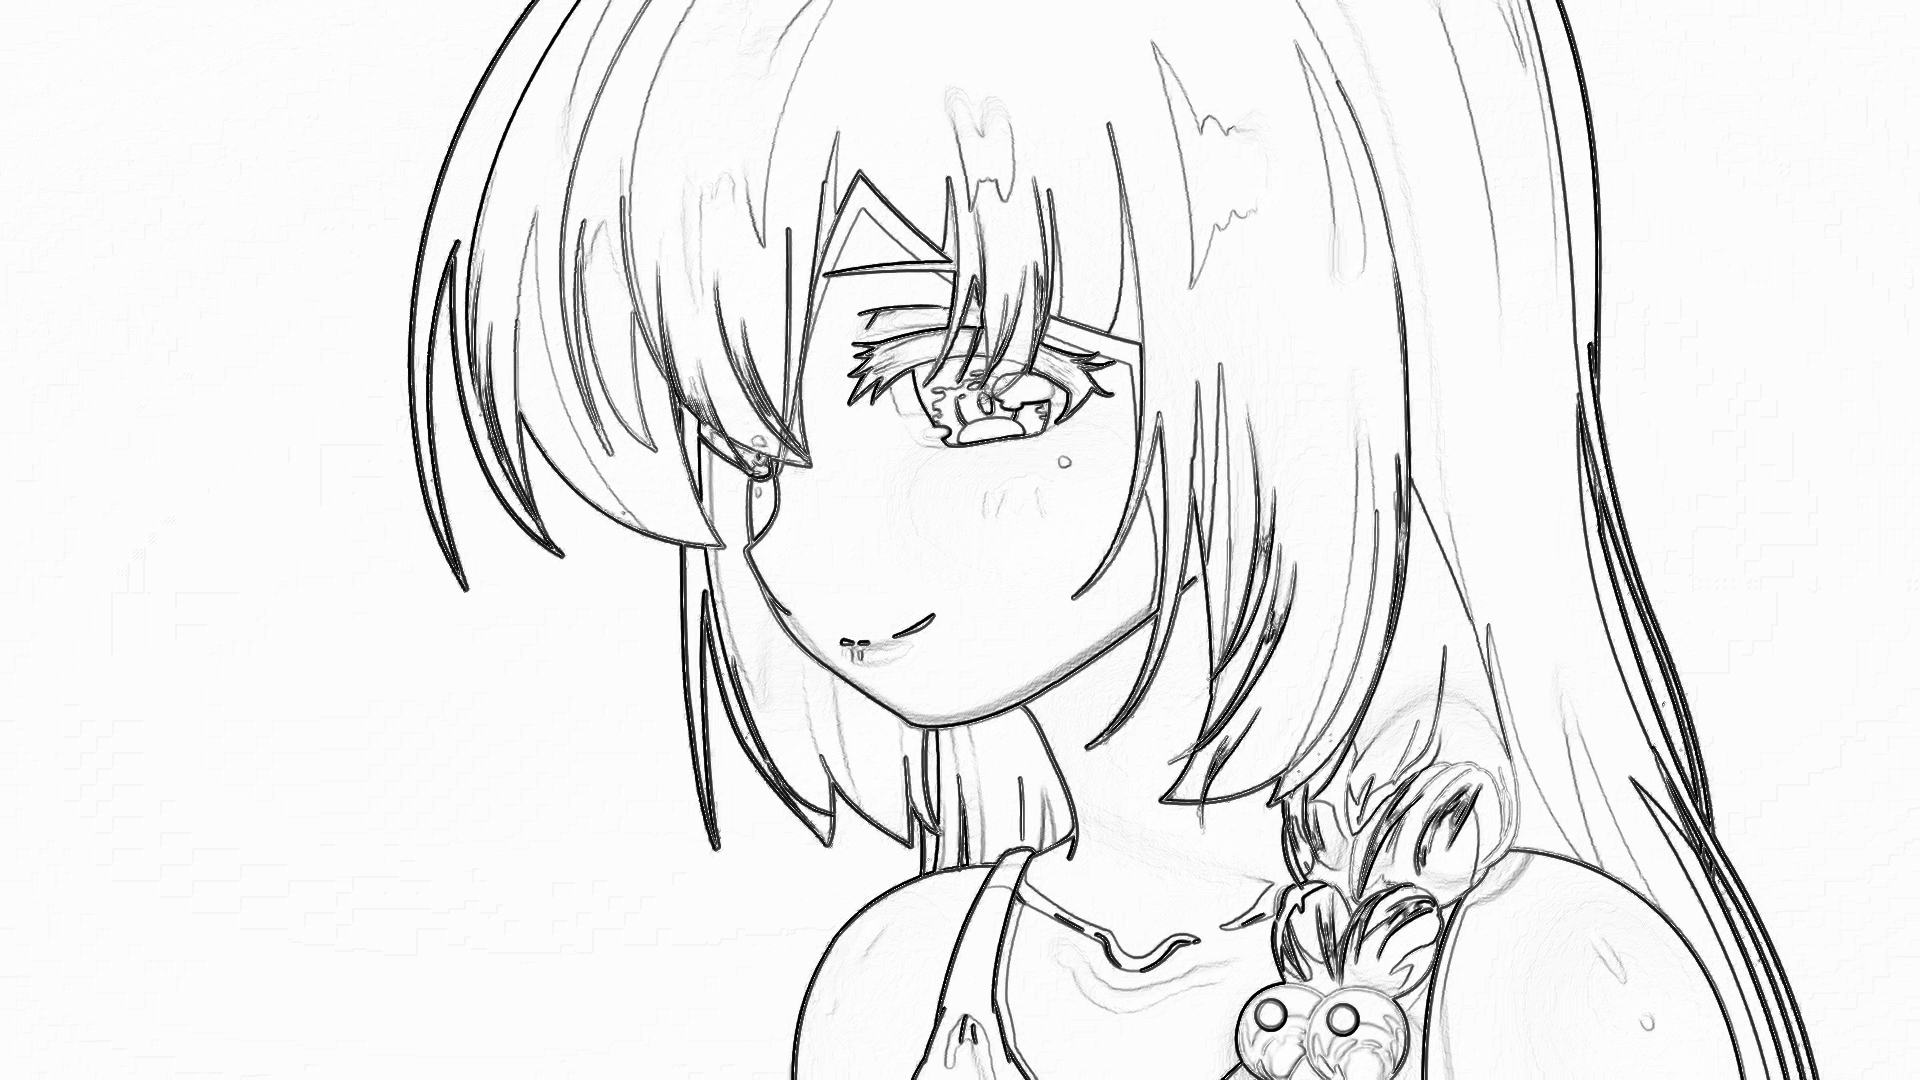
4.手绘风格
 1 from PIL import Image
 2 import numpy as np
 3 el=np.pi/2.2
 4 az=np.pi/4
 5 depth=10
 6 im=np.array(Image.open(r'C:UserslenovoDesktop壁纸呗梦源系列 片尾03.png').convert('L'))
 7 a=np.asarray(im).astype('float')
 8 grad = np.gradient(a)
 9 grad_x,grad_y = grad
10 grad_x = grad_x*depth/100
11 grad_y = grad_y*depth/100
12 dx=np.cos(el)*np.cos(az)
13 dy=np.cos(el)*np.sin(az)
14 dz=np.sin(el)
15 A=np.sqrt(grad_x**2+grad_y**2+1.0)
16 uni_x=grad_x/A
17 uni_y=grad_y/A
18 uni_z=1.0/A
19 a2=255*(dx*uni_x+dy*uni_y+dz*uni_z)
20 a2=a2.clip(0,255)
21 im2=Image.fromarray(a2.astype('uint8'))
22 im2.save(r'C:UserslenovoDesktop壁纸呗hand drawn of mengyuan03.png')