1、获取后端返回过来的值:
getweekData() {
				this.statistics_week = [];
				uni.request({
					url: this.$url + '/homeInfo/weekData',
					header: {
						'content-type': 'application/json',
						'token':this.token,
						'adminId':this.adminId
					},
					method: 'POST',
					sslVerify: true,//验证ssl证书
					data: {
						token: this.token,
						adminId: this.adminId
					},
					success: res => {
						// console.log(res);
						if(res.statusCode == 200) {
							this.statistics_week = res.data.data; //绑定data数据
							this.getServerData();//获取数据设置图表内容
						}
					},
					fail: err => {
						// console.log(err)
						this.$api.msg('请求错误!');
					},
				});
			},
2、
getServerData() {
  let jy_data = [],jy_count = [],jy_amount = [],max = '',max2 = '';
  if(this.statistics_week != '') {
    for(var i in this.statistics_week) {
      jy_data.push(this.statistics_week[i].date.slice(4,6) + '/' + this.statistics_week[i].date.slice(6,9));
      jy_count.push(this.statistics_week[i].count);
      jy_amount.push(this.statistics_week[i].amount);
    }
    max = Number(Math.max(...jy_amount)) + Number(100);
    max2 = Number(Math.max(...jy_count)) + Number(10);
  }
  let LineA = {
  categories: jy_data,
  series: [
  {
    name: '交易笔数',
							data: jy_count,
							color: '#000000',
							pointShape: 'diamond',
							index: 1
						},
						{
							name: '交易金额',
							data: jy_amount,
							pointShape: 'circle',
							index: 0
						}
					]
				}
				this.showMix("canvasMix", LineA, max, max2);
			},
3、绑定图表;
showMix(canvasId, chartData,max,max2) {
				canvasObj[canvasId] = new uCharts({
					$this:_self,
					canvasId: canvasId,
					type: 'line',
					fontSize:11,
					legend: {
						show: true
					},
					dataLabel:true, //显示数据点标签
					dataPointShape:true,
					background:'#FFFFFF',
					pixelRatio:_self.pixelRatio,
					categories: chartData.categories,
					series: chartData.series,
					animation: true,
					xAxis: {
						labelCount: 7,
						itemCount: 8,
						disableGrid:true,
						type:'grid',
						gridColor:'#CCCCCC',
						gridType:'dash',
						dashLength:8,
					},
                        //双y轴
					yAxis: {
						data: [{
							gridType:'dash',
							calibration: true,
							position: 'left',
							title: '完成总数',
							min: 0,
							max: max,
							titleFontSize: 12,
							format:(val)=>{return val.toFixed(0) + '元'}
						}, {
							gridType:'dash',
							calibration: true,
							position: 'right',
							min: 0,
							max: max2,
							title: '及时率',
							titleFontSize: 12,
							format:(val)=>{return val.toFixed(0) + '笔'}
						}],
					},
					 _self.cWidth*_self.pixelRatio,
					height: _self.cHeight*_self.pixelRatio,
					extra: {
						line:{
							type: 'straight'
						}
					}
				});
			},
			touchMix(e) {
				// console.log(e)
				canvasObj['canvasMix'].scrollStart(e);
			},
			moveMix(e) {
				canvasObj['canvasMix'].scroll(e);
			},
			touchEndMix(e) {
				canvasObj['canvasMix'].scrollEnd(e);
				canvasObj['canvasMix'].touchLegend(e);
				canvasObj['canvasMix'].showToolTip(e, {
					format: function(item, category) {
						return category + ' ' + item.name + ':' + item.data
					}
				});
			},
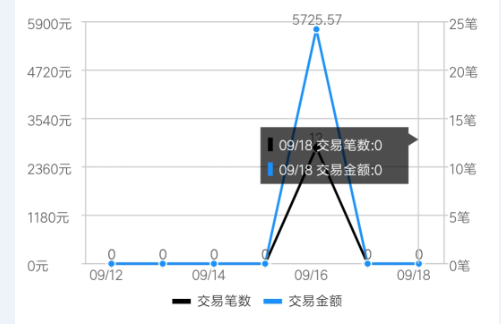
4、图表展示:
<view class="qiun-charts">
  <canvas canvas-id="canvasMix" id="canvasMix" class="charts" @touchstart="touchMix" @touchmove="moveMix" @touchend="touchEndMix"></canvas>
</view>