#读取实例图片#
from sklearn.datasets import load_sample_image
from sklearn.cluster import KMeans
import matplotlib.pyplot as plt
china=load_sample_image("china.jpg")
plt.imshow(china)
plt.show()
print(china.shape)

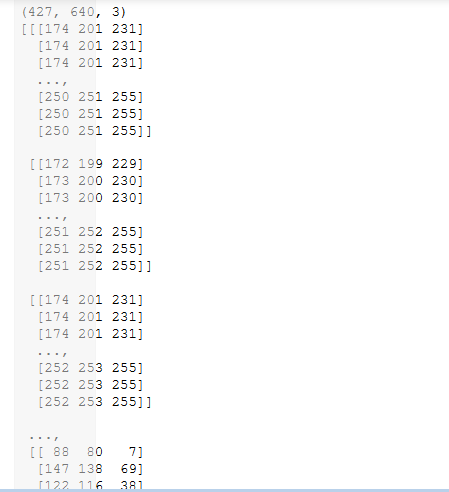
#观察图片数据格式#
print(china.dtype)
print(china.shape)
print(china)
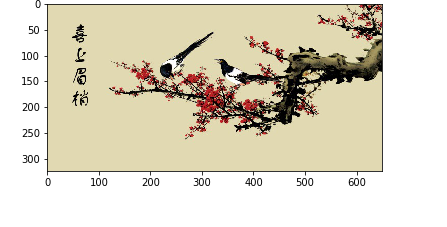
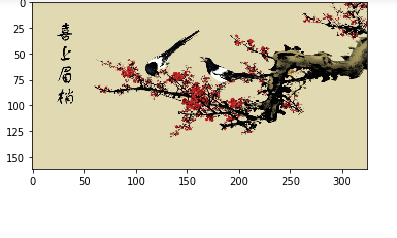
import matplotlib.image as img
ge=img.imread('F:\ge.jpg')
plt.imshow(ge)
plt.show()
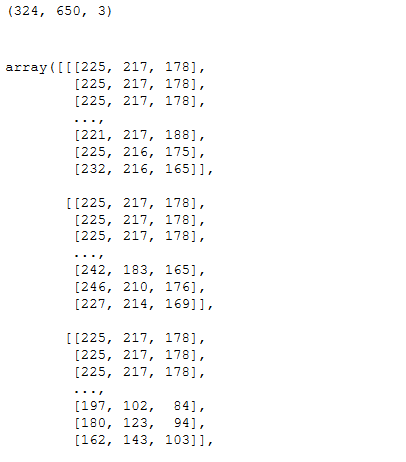
print(ge.shape)
ge
#降低分辨率#
ges=ge[::2,::2]
plt.imshow(ges)
plt.show()
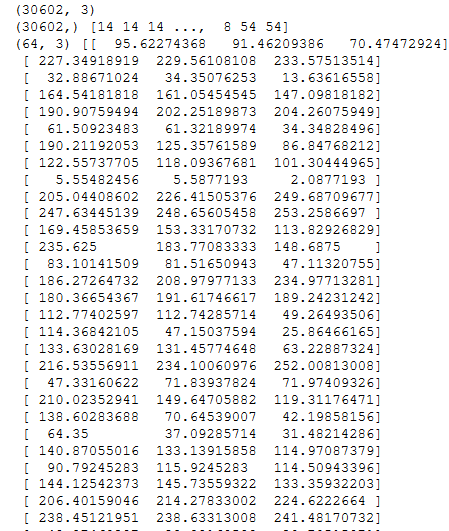
#用k均值聚类算法,将图片中所有的颜色值做聚类#
import numpy as np
china=load_sample_image("china.jpg")
plt.imshow(china)
plt.show()

image=china[::3,::3]
X=image.reshape(-1,3)
print(china.shape,image.shape,X.shape)

n_colors=64
model=KMeans(n_colors)
labels=model.fit_predict(X)
colors=model.cluster_centers_

#还原颜色,维数,数据类型
new_image=colors[labels]
new_image=new_image.reshape(image.shape)
new_image

plt.imshow(image)
plt.show()
plt.imshow(new_image.astype(np.uint8))
plt.show()


print(X.shape)
print(labels.shape,labels)
print(colors.shape,colors)
#原始图片与新图片所占用内存的大小#
import sys
print(sys.getsizeof(china))
print(sys.getsizeof(new_image))

观察图片的大小:

概率作业: