目录
- 文件结构
- pom.xml
- 主程序
- Controller
- Service
- 异常处理
- 配置
- 自定义注解以及 AOP
- 拦截器
- ApplicationRunner
- 定时调度
- logback-spring.xml 配置日志
- Actuator
- Prometheus
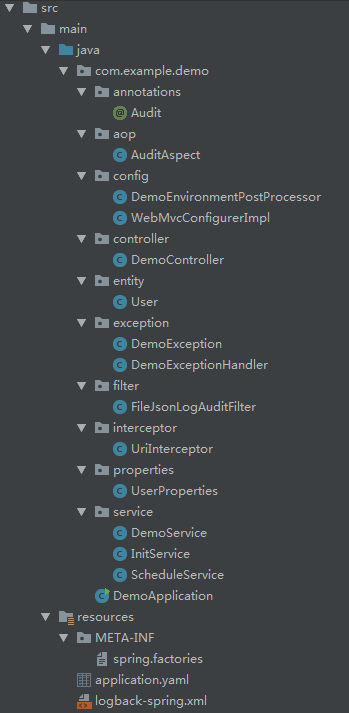
文件结构
pom.xml
<?xml version="1.0" encoding="UTF-8"?>
<project xmlns="http://maven.apache.org/POM/4.0.0" xmlns:xsi="http://www.w3.org/2001/XMLSchema-instance"
    xsi:schemaLocation="http://maven.apache.org/POM/4.0.0 https://maven.apache.org/xsd/maven-4.0.0.xsd">
    <modelVersion>4.0.0</modelVersion>
    <parent>
        <groupId>org.springframework.boot</groupId>
        <artifactId>spring-boot-starter-parent</artifactId>
        <version>2.4.0</version>
        <relativePath/> <!-- lookup parent from repository -->
    </parent>
    <groupId>com.example</groupId>
    <artifactId>demo</artifactId>
    <version>0.0.1-SNAPSHOT</version>
    <name>demo</name>
    <description>Demo project for Spring Boot</description>

    <properties>
        <java.version>1.8</java.version>
        <logstash.logback.version>5.2</logstash.logback.version>
        <prometheus.simple.client.version>0.8.0</prometheus.simple.client.version>
    </properties>

    <dependencies>
        <dependency>
            <groupId>org.springframework.boot</groupId>
            <artifactId>spring-boot-starter-web</artifactId>
            <exclusions>
                <exclusion>
                    <groupId>org.springframework.boot</groupId>
                    <artifactId>spring-boot-starter-tomcat</artifactId>
                </exclusion>
            </exclusions>
        </dependency>

        <dependency>
            <groupId>org.springframework.boot</groupId>
            <artifactId>spring-boot-starter-undertow</artifactId>
        </dependency>

        <dependency>
            <groupId>org.springframework.boot</groupId>
            <artifactId>spring-boot-starter-aop</artifactId>
        </dependency>

        <dependency>
            <groupId>org.springframework.boot</groupId>
            <artifactId>spring-boot-starter-validation</artifactId>
        </dependency>

        <dependency>
            <groupId>org.springframework.boot</groupId>
            <artifactId>spring-boot-starter-actuator</artifactId>
        </dependency>

        <dependency>
            <groupId>io.micrometer</groupId>
            <artifactId>micrometer-registry-prometheus</artifactId>
        </dependency>

        <dependency>
            <groupId>io.prometheus</groupId>
            <artifactId>simpleclient</artifactId>
            <version>${prometheus.simple.client.version}</version>
        </dependency>

        <dependency>
            <groupId>net.logstash.logback</groupId>
            <artifactId>logstash-logback-encoder</artifactId>
            <version>${logstash.logback.version}</version>
        </dependency>

        <dependency>
            <groupId>org.springframework.boot</groupId>
            <artifactId>spring-boot-starter-test</artifactId>
            <scope>test</scope>
        </dependency>
    </dependencies>

    <build>
        <plugins>
            <plugin>
                <groupId>org.springframework.boot</groupId>
                <artifactId>spring-boot-maven-plugin</artifactId>
            </plugin>
        </plugins>
    </build>

</project>
最简单的 spring boot 程序可以只引入 spring-boot-starter
因为这个例子是一个 web 程序,所以改成引入 spring-boot-starter-web
而 web 的默认服务器是 tomcat,可以通过 exclusion 把它去掉,然后引入 undertow 替换
主程序
package com.example.demo;

import org.springframework.boot.SpringApplication;
import org.springframework.boot.autoconfigure.SpringBootApplication;

@SpringBootApplication
public class DemoApplication {
    public static void main(String[] args) {
        SpringApplication.run(DemoApplication.class, args);
    }
}
通过 @SpringBootApplication 注解启动 spring boot 程序
Controller
package com.example.demo.controller;

import com.example.demo.annotations.Audit;
import com.example.demo.entity.User;
import com.example.demo.service.DemoService;
import org.springframework.beans.factory.annotation.Autowired;
import org.springframework.web.bind.annotation.GetMapping;
import org.springframework.web.bind.annotation.PathVariable;
import org.springframework.web.bind.annotation.PostMapping;
import org.springframework.web.bind.annotation.RequestBody;
import org.springframework.web.bind.annotation.RequestMapping;
import org.springframework.web.bind.annotation.RequestParam;
import org.springframework.web.bind.annotation.RestController;

import java.util.List;

@RestController
@RequestMapping("/api/v1")
public class DemoController {
    @Autowired
    private DemoService demoService;

    @Audit("get_all_user_id")
    @GetMapping("/users-id")
    public List<String> getId() {
        return demoService.getUsersId();
    }

    @Audit("get_users")
    @GetMapping("/users")
    public List<User> getUsers(@RequestParam(value = "gender", required = false) String gender) {
        return demoService.getUsers(gender);
    }

    @Audit("create_user")
    @PostMapping("/users/{id}")
    public void createUser(@PathVariable("id") String id,
                           @RequestBody User user) {
        demoService.createUser(id, user);
    }

    @Audit("get_user")
    @GetMapping("/user/{id}")
    public User getUser(@PathVariable("id") String id) {
        return demoService.getUser(id);
    }

    @Audit("update_user")
    @PostMapping("/user/{id}")
    public void updateUser(@PathVariable("id") String id,
                           @RequestBody User user) {
        demoService.updateUser(id, user);
    }
}
用于实现 Rest 接口,这个类的所有 URL 接口都以 "/api/v1" 开头
@PathVariable 定义的是 URL 路径里的变量
@RequestParam 定义的是 URL 路径的问号后带的变量
@RequestBody 是消息体带的变量
比如
curl -X GET "http://localhost:9000/api/v1/user/1"
curl -X GET "http://localhost:9000/api/v1/users?gender=male"
curl -l -H "Content-type: application/json" -X POST -d '{"name":"han","gender":"male","age":35,"salary":20000}' "http://localhost:9000/api/v1/user/1"
具体的业务交给了 DemoService 类实现
注解 @Autowired 用于自动初始化类,并实现单例化
Controller 会自动将请求的 body 携带的数据填到 User 类,User 类的变量名必须和 body 的名字一致
package com.example.demo.entity;

import java.io.Serializable;

public class User implements Serializable {
    private String name;
    private String gender;
    private int age;
    private float salary;

    // 这个空的构造函数是必须的,不然 Controller 无法将 request 的 body 取出
    public User() {
    }

    public User(String name, String gender, int age, float salary) {
        this.name = name;
        this.gender = gender;
        this.age = age;
        this.salary = salary;
    }

    public void setName(String name) {
        this.name = name;
    }
    public String getName() {
        return this.name;
    }

    public void setAge(int age) {
        this.age = age;
    }
    public int getAge() {
        return this.age;
    }

    public void setSalary(float salary) {
        this.salary = salary;
    }
    public float getSalary() {
        return this.salary;
    }

    public void setGender(String gender) {
        this.gender = gender;
    }
    public String getGender() {
        return this.gender;
    }
}
这几个接口实现了添加、查看、更改用户信息的功能
Service
package com.example.demo.service;

import com.example.demo.entity.User;
import com.example.demo.exception.DemoException;
import com.example.demo.properties.UserProperties;
import org.springframework.beans.factory.annotation.Autowired;
import org.springframework.stereotype.Service;

import javax.annotation.PostConstruct;
import java.util.ArrayList;
import java.util.List;
import java.util.Map;
import java.util.concurrent.ConcurrentHashMap;
import java.util.stream.Collectors;

@Service
public class DemoService {
    @Autowired
    private UserProperties userProperties;

    private Map<String, User> users = new ConcurrentHashMap<>();

    @PostConstruct
    public void init() {
        users.put("1", new User("Lin", "male", 30, 20000));
        users.put("2", new User("Zhao", "female", 25, 10000));
    }

    public User getUser(String id) {
        if (! users.containsKey(id)) {
            throw new DemoException("Demo-40001", "User not exist");
        }
        return users.get(id);
    }

    public List<String> getUsersId() {
        return new ArrayList<>(users.keySet());
    }

    public List<User> getUsers(String gender) {
        if (gender != null) {
            if (!gender.equals("male") && !gender.equals("female") ) {
                throw new DemoException("Demo-40005", "Invalid gender");
            }

            return users.values().stream()
                    .filter(user -> user.getGender().equals(gender))
                    .collect(Collectors.toList());
        } else {
            return new ArrayList<> (users.values());
        }
    }

    public void createUser(String id, User user) {
        if (users.containsKey(id)) {
            throw new DemoException("Demo-40002", "User already exist");
        } else if (userProperties.getSize() <= users.size()) {
            throw new DemoException("Demo-40003", "User db is full");
        } else if (userProperties.getNameLength() <= user.getName().length()) {
            throw new DemoException("Demo-40004", "User name must <= " + userProperties.getNameLength());
        }

        users.put(id, user);
    }

    public void updateUser(String id, User user) {
        if (! users.containsKey(id)) {
            throw new DemoException("Demo-40001", "User not exist");
        } else if (userProperties.getNameLength() <= user.getName().length()) {
            throw new DemoException("Demo-40004", "User name must <= " + userProperties.getNameLength());
        }
        users.put(id, user);
    }

}
@PostConstruct 表示在依赖注入完成后调用,正常的初始化顺序是 Construct -> Autowired -> PostConstruct,如果在构造函数使用了 @Autowired 的变量,会不起效果,因为是先执行构造函数再初始化 Autowired 变量,所以如果有这种需求就要用 @PostConstruct,上面这个例子可以在构造函数执行可以不用 @PostConstruct
异常处理
package com.example.demo.exception;

public class DemoException extends RuntimeException {
    private final String code;
    private final String message;

    public DemoException(String code, String message) {
        super(message);
        this.code = code;
        this.message = message;
    }

    public String getCode() {
        return code;
    }

    @Override
    public String getMessage() {
        return message;
    }
}
package com.example.demo.exception;

import org.slf4j.Logger;
import org.slf4j.LoggerFactory;
import org.springframework.http.HttpStatus;
import org.springframework.http.ResponseEntity;
import org.springframework.web.bind.annotation.ControllerAdvice;
import org.springframework.web.bind.annotation.ExceptionHandler;
import org.springframework.web.bind.annotation.ResponseBody;
import org.springframework.web.servlet.mvc.method.annotation.ResponseEntityExceptionHandler;

import java.io.Serializable;

@ControllerAdvice
public class DemoExceptionHandler extends ResponseEntityExceptionHandler {

    private final Logger logger = LoggerFactory.getLogger(this.getClass());

    private class Result implements Serializable {
        private String code;
        private String message;

        public String getCode() {
            return code;
        }
        public String getMessage() {
            return message;
        }

        private Result(String code, String message) {
            this.code = code;
            this.message = message;
        }
    }

    @ExceptionHandler(DemoException.class)
    @ResponseBody
    public ResponseEntity<Result> handleDemoException(DemoException ex) {
        logger.error("Demo Exception", ex.getMessage(), ex);
        Result result = new Result(ex.getCode(), ex.getMessage());
        return new ResponseEntity<>(result, HttpStatus.BAD_REQUEST);
    }

    @ExceptionHandler(Exception.class)
    @ResponseBody
    public ResponseEntity<Result> handleOtherError(Exception ex) {
        logger.error("Unknown Exception", ex.getMessage(), ex);
        Result result = new Result("Demo-50000", ex.getMessage());
        return new ResponseEntity<>(result, HttpStatus.INTERNAL_SERVER_ERROR);
    }
}
通过 @ControllerAdvice 和 ResponseEntityExceptionHandler 可以统一捕获处理程序抛出的异常,@ExceptionHandler(DemoException.class) 和 @ExceptionHandler(Exception.class) 表示这两个函数分别处理抛出的 DemoException 和 Exception,并通过 ResponseEntity 返回给客户端
DemoService 里抛出的 DemoException 异常或其他异常都会在这里统一处理
比如如果添加一个已经存在的 user,HTTP 请求的返回内容是
{
    "code": "Demo-40002",
    "message": "User already exist"
}
返回码则是 400 Bad Request
配置
# application.yaml

# server:
#   port: 9000

logging:
  level:
    root: INFO
    com:
      example:
        demo: INFO

user:
  size: 10
  name-length: 10

# 暴露 Actuator 的所有接口,并使 health 接口展示所有信息
# http://localhost:9000/actuator
# http://localhost:9000/actuator/health
# http://localhost:9000/actuator/metrics
# http://localhost:9000/actuator/prometheus
# 需要在 pom.xml 添加 actuator 包
management:
  endpoints:
    web:
      exposure:
        include: "*"
  endpoint:
    health:
      show-details: always
spring boot 默认 8080 端口,通过 server.port 可以指定为 9000
DemoService 读取的 UserProperties 类就是用于获取 application.yaml 的配置项
        <dependency>
            <groupId>org.springframework.boot</groupId>
            <artifactId>spring-boot-starter-validation</artifactId>
        </dependency>
package com.example.demo.properties;

import org.springframework.boot.context.properties.ConfigurationProperties;
import org.springframework.boot.context.properties.EnableConfigurationProperties;
import org.springframework.stereotype.Component;
import org.springframework.validation.annotation.Validated;

import javax.validation.constraints.Max;
import javax.validation.constraints.Min;
import javax.validation.constraints.NotNull;

@Component
@EnableConfigurationProperties
@ConfigurationProperties(prefix = "user")
@Validated
public class UserProperties {
    @NotNull
    private int size;

    @Min(5)
    @Max(20)
    private int nameLength = 10;

    public int getSize() {
        return size;
    }
    public void setSize(int size) {
        this.size = size;
    }

    public int getNameLength() {
        return nameLength;
    }
    public void setNameLength(int nameLength) {
        this.nameLength = nameLength;
    }
}
@EnableConfigurationProperties 表示读取配置文件
@ConfigurationProperties(prefix = "user") 表示读取 user 配置项
@Validated、@NotNull、@Min、@Max 用于验证配置的值
变量名必须和配置文件的一致,有连接符 - 的就用驼峰表示法命名
可以统一处理默认配置
package com.example.demo.config;

import org.springframework.boot.SpringApplication;
import org.springframework.boot.env.EnvironmentPostProcessor;
import org.springframework.core.Ordered;
import org.springframework.core.env.ConfigurableEnvironment;
import org.springframework.core.env.MapPropertySource;
import org.springframework.core.env.PropertySource;

import java.util.HashMap;
import java.util.Map;

public class DemoEnvironmentPostProcessor implements EnvironmentPostProcessor, Ordered {

    @Override
    public void postProcessEnvironment(ConfigurableEnvironment environment,
                                       SpringApplication application) {
        Map<String, Object> defaultMap = new HashMap<>();

        defaultMap.put("server.port", 9000);
        defaultMap.put("user.size", 100);
        defaultMap.put("user.name-length", 20);

        PropertySource<?> propertySource = new MapPropertySource("defaultProp", defaultMap);
        environment.getPropertySources().addLast(propertySource);
    }

    @Override
    public int getOrder() {
        return 0;
    }
}
这样如果 application.yaml 没指定某个配置项,而 defaultMap 又有相应的配置项,那就使用 defaultMap 指定的值
需要配置 resources/META-INF/spring.factories 文件
org.springframework.boot.env.EnvironmentPostProcessor=com.example.demo.config.DemoEnvironmentPostProcessor
这样这个类才起作用
自定义注解以及 AOP
package com.example.demo.annotations;

import java.lang.annotation.Documented;
import java.lang.annotation.ElementType;
import java.lang.annotation.Retention;
import java.lang.annotation.RetentionPolicy;
import java.lang.annotation.Target;

@Target(ElementType.METHOD)
@Retention(RetentionPolicy.RUNTIME)
@Documented
public @interface Audit {
    String value() default "";
}
自定义注解并加到 Controller 用于修饰 REST 接口
    @Audit("get_all_user_id")
    @GetMapping("/users-id")
    public List<String> getId() {
        return demoService.getUsersId();
    }
然后要实现一个 AOP(Aspect Oriented Programming) 对这个注解进行拦截处理
        <dependency>
            <groupId>org.springframework.boot</groupId>
            <artifactId>spring-boot-starter-aop</artifactId>
        </dependency>
package com.example.demo.aop;

import com.example.demo.annotations.Audit;
import io.micrometer.core.instrument.Metrics;
import net.logstash.logback.marker.LogstashMarker;
import org.aspectj.lang.JoinPoint;
import org.aspectj.lang.annotation.AfterReturning;
import org.aspectj.lang.annotation.AfterThrowing;
import org.aspectj.lang.annotation.Aspect;
import org.aspectj.lang.annotation.Before;
import org.aspectj.lang.annotation.Pointcut;
import org.aspectj.lang.reflect.MethodSignature;
import org.slf4j.Logger;
import org.slf4j.LoggerFactory;
import org.springframework.beans.factory.annotation.Autowired;
import org.springframework.core.annotation.Order;
import org.springframework.stereotype.Component;
import org.wildfly.common.annotation.NotNull;

import javax.servlet.http.HttpServletRequest;

import static net.logstash.logback.marker.Markers.append;

@Aspect
@Component
@Order(1)
public class AuditAspect {
    private final Logger logger = LoggerFactory.getLogger(this.getClass());

    @Autowired
    private HttpServletRequest request;

    private static final ThreadLocal<Long> threadLocal = new ThreadLocal<>();

    @Pointcut("@annotation(com.example.demo.annotations.Audit)")
    public void pcAudit() {
    }

    @Before(value = "pcAudit()")
    public void beforeAudit(JoinPoint point) {
        threadLocal.set(System.currentTimeMillis());
        String uri = request.getRequestURI();
        String method = request.getMethod();
        String auditName = getAnnotationName(point);
        logger.info(getMarker(method), "receive " + method + " request on uri " + uri + " to " + auditName);
    }

    @AfterReturning(value = "pcAudit()")
    public void afterAuditReturning(JoinPoint point) {
        String auditName = getAnnotationName(point);
        Metrics.counter("request_success_counter", "demo", auditName).increment();
        String uri = request.getRequestURI();
        String method = request.getMethod();
        long interval = System.currentTimeMillis() - threadLocal.get();
        logger.info(getMarker(method),
                "after " + method + " request on uri " + uri + " return, consume " + interval + "ms");
    }

    @AfterThrowing(value = "pcAudit()", throwing = "ex")
    public void afterAuditThrowing(JoinPoint point, Exception ex) {
        String auditName = getAnnotationName(point);
        Metrics.counter("request_fail_counter", "demo", auditName).increment();
        String uri = request.getRequestURI();
        String method = request.getMethod();
        long interval = System.currentTimeMillis() - threadLocal.get();
        logger.info(getMarker(method), "after " + method + " request on uri " + uri + ", consume "
                + interval + "ms, throw " + ex.getMessage());
    }

    private String getAnnotationName(@NotNull JoinPoint point) {
        MethodSignature methodSignature = (MethodSignature) point.getSignature();
        Audit audit = methodSignature.getMethod().getAnnotation(Audit.class);
        return audit.value();
    }

    private LogstashMarker getMarker(String action) {
        // marker 字段只会在 logback-spring.xml 中使用 LogstashEncoder 的 appender 会使用到,会打出来
        // 在其他 appender 中也会打 log,但不会带上 marker 字段
        return append("type", "audit").and(append("action", action));
    }
}
@Aspect 表示这个类用于进行 AOP 处理
@Order(1) 表示优先级,因为一个函数有可能被多个注解标记
@Pointcut("@annotation(com.example.demo.annotations.Audit)") 表示拦截 Audit 标记的函数
@Before(value = "pcAudit()") 表示在被标记的函数运行前执行
@AfterReturning(value = "pcAudit()") 表示在被标记的函数运行后执行
@AfterThrowing(value = "pcAudit()", throwing = "ex") 表示在被标记的函数抛异常后执行
getAnnotationName 用于获取 Audit 注解的值,比如 "get_all_user_id"
这里实现了在目标函数执行前后打印日志,计算函数执行时间,计算函数执行次数,等功能
拦截器
package com.example.demo.config;

import com.example.demo.interceptor.UriInterceptor;
import org.springframework.context.annotation.Configuration;
import org.springframework.web.servlet.config.annotation.InterceptorRegistry;
import org.springframework.web.servlet.config.annotation.WebMvcConfigurer;

@Configuration
public class WebMvcConfigurerImpl implements WebMvcConfigurer {
    @Override
    public void addInterceptors(InterceptorRegistry registry) {
        registry.addInterceptor(new UriInterceptor());
    }
}
通过继承 WebMvcConfigurer 添加了拦截器 UriInterceptor 用于拦截用户请求
可以添加多个,按添加的顺序执行
package com.example.demo.interceptor;

import org.springframework.http.HttpStatus;
import org.springframework.web.servlet.handler.HandlerInterceptorAdapter;

import javax.servlet.http.HttpServletRequest;
import javax.servlet.http.HttpServletResponse;

public class UriInterceptor extends HandlerInterceptorAdapter {
    @Override
    public boolean preHandle(HttpServletRequest request, HttpServletResponse response, Object handler)
            throws Exception {
        String urlList[] = {
                "^/api/v1/users-id$",
                "^/api/v1/users(/[^//]*){0,1}$",
                "^/api/v1/user/[^//]+$"
        };

        String uri = request.getRequestURI();
        for (String urlPattern : urlList) {
            if (uri.matches(urlPattern)) {
                return true;
            }
        }
        response.setStatus(HttpStatus.NOT_FOUND.value());
        response.getWriter().write("<html><head><title>Error Page</title></head><body>Invalid Request</body></html>");
        return false;
    }
}
UriInterceptor 通过继承 HandlerInterceptorAdapter 并重载 preHandle 函数实现
preHandle 函数在用户请求被执行之前运行
这里收到请求后,先检查是不是合法的 URL,如果是就返回 true,表示执行下一个拦截器,或是执行 Controller,如果不是合法的 URL,就返回我们自定义的 404 NOT FOUND 页面(不用这个拦截器会返回默认的 404 页面)
ApplicationRunner
package com.example.demo.service;

import org.slf4j.Logger;
import org.slf4j.LoggerFactory;
import org.springframework.boot.ApplicationArguments;
import org.springframework.boot.ApplicationRunner;
import org.springframework.stereotype.Component;


@Component
public class InitService implements ApplicationRunner {
    private final Logger logger = LoggerFactory.getLogger(this.getClass());

    @Override
    public void run(ApplicationArguments args) throws Exception {
        // TODO: init database
         logger.info("InitService : init database");
    }
}
有时需要在程序启动后做一些操作,可以用 ApplicationRunner 实现
定时调度
package com.example.demo.service;

import com.example.demo.entity.User;
import org.slf4j.Logger;
import org.slf4j.LoggerFactory;
import org.springframework.beans.factory.annotation.Autowired;
import org.springframework.context.annotation.Bean;
import org.springframework.scheduling.TaskScheduler;
import org.springframework.scheduling.annotation.EnableScheduling;
import org.springframework.scheduling.annotation.Scheduled;
import org.springframework.scheduling.concurrent.ThreadPoolTaskScheduler;
import org.springframework.stereotype.Component;

import java.util.List;

@EnableScheduling
@Component
public class ScheduleService {
    @Autowired
    private DemoService demoService;

    private final Logger logger = LoggerFactory.getLogger(this.getClass());

    //@Scheduled(cron = "0 0/2 * * * ?")
    @Scheduled(initialDelayString = "5000", fixedDelayString = "100000")
    public void saveUserToDB() {
        List<User> user = demoService.getUsers(null);
        // TODO: save user to database
        logger.info("schedule : save user list to database");
    }

    // 配置线程池
    // 不知道写在这里有没有用,可能写到一个专门初始化配置的类比较好
    @Bean
    public TaskScheduler configTaskScheduler() {
        ThreadPoolTaskScheduler scheduler = new ThreadPoolTaskScheduler();
        scheduler.setPoolSize(10);
        return scheduler;
    }
}
可以周期性调用,也可以通过 cron 指定固定时间调用
logback-spring.xml 配置日志
<?xml version="1.0" encoding="UTF-8"?>
<!-- scan: 配置文件如果发生改变,将会被重新加载,默认值为 true -->
<!-- scanPeriod: 监测配置文件是否有修改的时间间隔,默认单位是毫秒,默认的时间间隔为 1 分钟 -->
<!-- debug: 设置为 true 时,将打印出 logback 内部日志信息,实时查看 logback 运行状态,默认值为 false -->
<configuration  scan="true" scanPeriod="10 seconds"  debug="true">

    <!-- 定义变量,后面可以通过 ${log.path} 引用 -->
    <property name="log.path" value="./log" />

    <!-- 输出到控制台,
         name 可以是任意名字,最后面要添加到 <root>,
         class 是打印日志的类,ConsoleAppender 是打到控制台 -->
    <appender name="CONSOLE" class="ch.qos.logback.core.ConsoleAppender">
        <!-- filter 指定用于过滤的类,可以是自定义的,这里是过滤大于等于 info level 的日志 -->
        <filter class="ch.qos.logback.classic.filter.ThresholdFilter">
            <level>info</level>
        </filter>

        <encoder>
            <!-- 输出日志的格式 -->
            <Pattern>%d{yyyy-MM-dd HH:mm:ss.SSS} [%thread] [%-5level] [%logger{50}] - %msg%n</Pattern>
            <!-- 设置字符集 -->
            <charset>UTF-8</charset>
        </encoder>
    </appender>

    <!-- 输出到文件 -->
    <appender name="FILE" class="ch.qos.logback.core.rolling.RollingFileAppender">
        <!-- 路径及文件名 -->
        <file>${log.path}/demo.log</file>

        <!-- 此日志文件只记录 info 级别的 -->
        <filter class="ch.qos.logback.classic.filter.LevelFilter">
            <level>info</level>
            <onMatch>ACCEPT</onMatch>
            <onMismatch>DENY</onMismatch>
        </filter>

        <!-- 输出日志的格式 -->
        <encoder>
            <pattern>%d{yyyy-MM-dd HH:mm:ss.SSS} [%thread] [%-5level] [%logger{50}] - %msg%n</pattern>
            <charset>UTF-8</charset>
        </encoder>

        <!-- 日志的滚动策略,按日期,按大小记录 -->
        <rollingPolicy class="ch.qos.logback.core.rolling.TimeBasedRollingPolicy">
            <!-- 日志归档 -->
            <fileNamePattern>${log.path}/save/demo-%d{yyyy-MM-dd}.%i.log</fileNamePattern>
            <timeBasedFileNamingAndTriggeringPolicy class="ch.qos.logback.core.rolling.SizeAndTimeBasedFNATP">
                <maxFileSize>100MB</maxFileSize>
            </timeBasedFileNamingAndTriggeringPolicy>
            <!-- 日志文件保留天数 -->
            <maxHistory>15</maxHistory>
        </rollingPolicy>
    </appender>

    <!-- 输出到文件,使用 LogstashEncoder 输出 json 格式的日志 -->
    <appender name="FILE-JSON" class="ch.qos.logback.core.rolling.RollingFileAppender">
        <!-- 路径及文件名 -->
        <file>${log.path}/demo-json.log</file>

        <!-- 自定义 filter 只输出 audit 的非 ERROR 日志 -->
        <Filter class="com.example.demo.filter.FileJsonLogAuditFilter" />

        <encoder class="net.logstash.logback.encoder.LogstashEncoder">
            <includeCallerData>true</includeCallerData>
            <customFields>{"group":"example", "service":"demo"}</customFields>
            <timestampPattern>yyyy-MM-dd HH:mm:ss.SSS'Z'</timestampPattern>
            <timeZone>UTC +0</timeZone>
            <fieldNames>
                <timestamp>timestamp</timestamp>
                <thread>thread</thread>
                <logger>logger</logger>
                <message>message</message>
                <level>level</level>
                <callerLine>line</callerLine>
                <!-- 如果不设置为 ignore 的话会打出来 -->
                <version>[ignore]</version>
                <levelValue>[ignore]</levelValue>
                <callerClass>[ignore]</callerClass>
                <callerMethod>[ignore]</callerMethod>
                <callerFile>[ignore]</callerFile>
            </fieldNames>
        </encoder>

        <!-- 日志的滚动策略,按日期,按大小记录 -->
        <rollingPolicy class="ch.qos.logback.core.rolling.TimeBasedRollingPolicy">
            <!-- 日志归档 -->
            <fileNamePattern>${log.path}/save/demo-json-%d{yyyy-MM-dd}.%i.log</fileNamePattern>
            <timeBasedFileNamingAndTriggeringPolicy class="ch.qos.logback.core.rolling.SizeAndTimeBasedFNATP">
                <maxFileSize>100MB</maxFileSize>
            </timeBasedFileNamingAndTriggeringPolicy>
            <!-- 日志文件保留天数 -->
            <maxHistory>15</maxHistory>
        </rollingPolicy>
    </appender>

    <root level="info" additivity="true">
        <appender-ref ref="CONSOLE" />
        <appender-ref ref="FILE" />
        <appender-ref ref="FILE-JSON" />
    </root>

</configuration>
SpringBoot 会默认扫描 classpath 下面的 logback.xml、logback-spring.xml 文件
这里可以定义多个 appender,每个 appender 定义日志输出到哪里,是到 console 还是文件,使用什么样的 filter 过滤,输出格式怎么样,等等
这个例子中的 FILE-JSON appender 使用了 net.logstash.logback.encoder.LogstashEncoder 用于输出 JSON 格式的日志,并且使用了自定义的 filter
        <dependency>
            <groupId>net.logstash.logback</groupId>
            <artifactId>logstash-logback-encoder</artifactId>
            <version>${logstash.logback.version}</version>
        </dependency>
package com.example.demo.filter;

import ch.qos.logback.classic.Level;
import ch.qos.logback.classic.spi.LoggingEvent;
import ch.qos.logback.core.filter.Filter;
import ch.qos.logback.core.spi.FilterReply;
import org.slf4j.Marker;

import static net.logstash.logback.marker.Markers.append;

public class FileJsonLogAuditFilter extends Filter<Object> {

    @Override
    public FilterReply decide(Object eventObject) {
        LoggingEvent event = (LoggingEvent) eventObject;
        Level level = event.getLevel();
        Marker marker = event.getMarker();

        if (level != Level.ERROR) {
            if (marker != null && marker.contains(append("type", "audit"))) {
                return FilterReply.ACCEPT;
            } else {
                return FilterReply.DENY;
            }
        }
        return FilterReply.DENY;
    }
}
可以看到这个 Filter 只允许非 ERROR 并且有 {"type": "audit"} 这个 marker 的日志输出
import net.logstash.logback.marker.LogstashMarker;

    private LogstashMarker getMarker(String action) {
        // marker 字段只会在 logback-spring.xml 中使用 LogstashEncoder 的 appender 会使用到,会打出来
        // 在其他 appender 中也会打 log,但不会带上 marker 字段
        return append("type", "audit").and(append("action", action));
    }

logger.info(getMarker(method), "receive " + method + " request on uri " + uri + " to " + auditName);
可以看到 Audit AOP 中就使用了 marker,主要用于标记 log,在正常的日志中不会打印 marker,但在 LogstashEncoder 的 appender 会打印出来
FILE-JSON appender 的 log 看起是这样
{"timestamp":"2020-11-24 13:13:43.259Z","message":"after GET request on uri /api/v1/users return, consume 3ms","logger":"com.example.demo.aop.AuditAspect","thread":"XNIO-1 task-1","level":"INFO","type":"audit","action":"GET","line":55,"group":"example","service":"demo"}
CONSOLE appender 的 log 看起是这样
2020-11-25 01:08:25.203 [main] [INFO ] [com.example.demo.service.InitService] - InitService : init database
多个 appender 同时起作用
Actuator
Spring Boot Actuator 模块提供了生产级别的功能,比如健康检查,审计,指标收集,HTTP 跟踪等
这些功能都可以通过 HTTP 和 JMX 访问
        <dependency>
            <groupId>org.springframework.boot</groupId>
            <artifactId>spring-boot-starter-actuator</artifactId>
        </dependency>
application.yaml 需要配置
# 暴露 Actuator 的所有接口,并使 health 接口展示所有信息
# http://localhost:9000/actuator
# http://localhost:9000/actuator/health
# http://localhost:9000/actuator/metrics
# http://localhost:9000/actuator/prometheus
# 需要在 pom.xml 添加 actuator 包
management:
  endpoints:
    web:
      exposure:
        include: "*"
  endpoint:
    health:
      show-details: always
http://localhost:9000/actuator 可以查看有哪些 Actuator 可以用,比如 health,metrics,beans 等
举一些例子
http://localhost:9000/actuator/health 的返回如下
{
    "status": "UP",
    "components": {
        "diskSpace": {
            "status": "UP",
            "details": {
                "total": 175025696768,
                "free": 33702227968,
                "threshold": 10485760,
                "exists": true
            }
        },
        "ping": {
            "status": "UP"
        }
    }
}
http://localhost:9000/actuator/metrics 的返回如下
{
    "names": [
        "http.server.requests",
        "jvm.buffer.count",
        "jvm.buffer.memory.used",
        "jvm.buffer.total.capacity",
        "jvm.classes.loaded",
        "jvm.classes.unloaded",
        "jvm.gc.live.data.size",
        "jvm.gc.max.data.size",
        "jvm.gc.memory.allocated",
        "jvm.gc.memory.promoted",
        "jvm.memory.committed",
        "jvm.memory.max",
        "jvm.memory.used",
        "jvm.threads.daemon",
        "jvm.threads.live",
        "jvm.threads.peak",
        "jvm.threads.states",
        "logback.events",
        "process.cpu.usage",
        "process.start.time",
        "process.uptime",
        "request_success_counter",
        "system.cpu.count",
        "system.cpu.usage"
    ]
}
可以看到我们在 AOP 定义的 request_success_counter 这里可以看到
进一步查看 http://localhost:9000/actuator/metrics/request_success_counter
{
    "name": "request_success_counter",
    "description": null,
    "baseUnit": null,
    "measurements": [
        {
            "statistic": "COUNT",
            "value": 3.0
        }
    ],
    "availableTags": [
        {
            "tag": "demo",
            "values": [
                "get_all_user_id",
                "get_users"
            ]
        }
    ]
}
统计了访问次数
Prometheus
        <dependency>
            <groupId>io.micrometer</groupId>
            <artifactId>micrometer-registry-prometheus</artifactId>
        </dependency>

        <dependency>
            <groupId>io.prometheus</groupId>
            <artifactId>simpleclient</artifactId>
            <version>${prometheus.simple.client.version}</version>
        </dependency>
在 AuditAspect 类中,我们使用了 metrics 进行统计
除了在 metrics actuator 可以看到,在 prometheus actuator 也可以看到
String auditName = getAnnotationName(point);

Metrics.counter("request_success_counter", "demo", auditName).increment();

Metrics.counter("request_fail_counter", "demo", auditName).increment();
http://localhost:9000/actuator/prometheus
# HELP process_cpu_usage The "recent cpu usage" for the Java Virtual Machine process
# TYPE process_cpu_usage gauge
process_cpu_usage 0.0
# HELP http_server_requests_seconds
# TYPE http_server_requests_seconds summary
http_server_requests_seconds_count{exception="None",method="GET",outcome="SUCCESS",status="200",uri="/api/v1/users",} 1.0
http_server_requests_seconds_sum{exception="None",method="GET",outcome="SUCCESS",status="200",uri="/api/v1/users",} 0.155734128
http_server_requests_seconds_count{exception="None",method="GET",outcome="SUCCESS",status="200",uri="/actuator/metrics",} 2.0
http_server_requests_seconds_sum{exception="None",method="GET",outcome="SUCCESS",status="200",uri="/actuator/metrics",} 0.011018067
http_server_requests_seconds_count{exception="None",method="GET",outcome="SUCCESS",status="200",uri="/actuator/health",} 1.0
http_server_requests_seconds_sum{exception="None",method="GET",outcome="SUCCESS",status="200",uri="/actuator/health",} 0.074643576
http_server_requests_seconds_count{exception="None",method="GET",outcome="SUCCESS",status="200",uri="/api/v1/users-id",} 2.0
http_server_requests_seconds_sum{exception="None",method="GET",outcome="SUCCESS",status="200",uri="/api/v1/users-id",} 0.01569854
http_server_requests_seconds_count{exception="None",method="GET",outcome="SUCCESS",status="200",uri="/actuator",} 1.0
http_server_requests_seconds_sum{exception="None",method="GET",outcome="SUCCESS",status="200",uri="/actuator",} 0.153424829
http_server_requests_seconds_count{exception="None",method="GET",outcome="CLIENT_ERROR",status="404",uri="/**",} 1.0
http_server_requests_seconds_sum{exception="None",method="GET",outcome="CLIENT_ERROR",status="404",uri="/**",} 0.067295168
http_server_requests_seconds_count{exception="None",method="GET",outcome="SUCCESS",status="200",uri="/actuator/metrics/{requiredMetricName}",} 1.0
http_server_requests_seconds_sum{exception="None",method="GET",outcome="SUCCESS",status="200",uri="/actuator/metrics/{requiredMetricName}",} 0.021771337
http_server_requests_seconds_count{exception="None",method="GET",outcome="SUCCESS",status="200",uri="/actuator/beans",} 1.0
http_server_requests_seconds_sum{exception="None",method="GET",outcome="SUCCESS",status="200",uri="/actuator/beans",} 0.097360332
# HELP http_server_requests_seconds_max
# TYPE http_server_requests_seconds_max gauge
http_server_requests_seconds_max{exception="None",method="GET",outcome="SUCCESS",status="200",uri="/api/v1/users",} 0.0
http_server_requests_seconds_max{exception="None",method="GET",outcome="SUCCESS",status="200",uri="/actuator/metrics",} 0.0
http_server_requests_seconds_max{exception="None",method="GET",outcome="SUCCESS",status="200",uri="/actuator/health",} 0.0
http_server_requests_seconds_max{exception="None",method="GET",outcome="SUCCESS",status="200",uri="/api/v1/users-id",} 0.0
http_server_requests_seconds_max{exception="None",method="GET",outcome="SUCCESS",status="200",uri="/actuator",} 0.0
http_server_requests_seconds_max{exception="None",method="GET",outcome="CLIENT_ERROR",status="404",uri="/**",} 0.0
http_server_requests_seconds_max{exception="None",method="GET",outcome="SUCCESS",status="200",uri="/actuator/metrics/{requiredMetricName}",} 0.0
http_server_requests_seconds_max{exception="None",method="GET",outcome="SUCCESS",status="200",uri="/actuator/beans",} 0.0
# HELP jvm_memory_used_bytes The amount of used memory
# TYPE jvm_memory_used_bytes gauge
jvm_memory_used_bytes{area="heap",id="PS Survivor Space",} 0.0
jvm_memory_used_bytes{area="heap",id="PS Old Gen",} 1.5820736E7
jvm_memory_used_bytes{area="heap",id="PS Eden Space",} 1.73317984E8
jvm_memory_used_bytes{area="nonheap",id="Metaspace",} 4.5230552E7
jvm_memory_used_bytes{area="nonheap",id="Code Cache",} 1.296704E7
jvm_memory_used_bytes{area="nonheap",id="Compressed Class Space",} 6097952.0
# HELP jvm_gc_live_data_size_bytes Size of long-lived heap memory pool after reclamation
# TYPE jvm_gc_live_data_size_bytes gauge
jvm_gc_live_data_size_bytes 0.0
# HELP jvm_gc_memory_promoted_bytes_total Count of positive increases in the size of the old generation memory pool before GC to after GC
# TYPE jvm_gc_memory_promoted_bytes_total counter
jvm_gc_memory_promoted_bytes_total 0.0
# HELP jvm_classes_unloaded_classes_total The total number of classes unloaded since the Java virtual machine has started execution
# TYPE jvm_classes_unloaded_classes_total counter
jvm_classes_unloaded_classes_total 0.0
# HELP jvm_threads_states_threads The current number of threads having NEW state
# TYPE jvm_threads_states_threads gauge
jvm_threads_states_threads{state="runnable",} 10.0
jvm_threads_states_threads{state="blocked",} 0.0
jvm_threads_states_threads{state="waiting",} 15.0
jvm_threads_states_threads{state="timed-waiting",} 2.0
jvm_threads_states_threads{state="new",} 0.0
jvm_threads_states_threads{state="terminated",} 0.0
# HELP jvm_buffer_memory_used_bytes An estimate of the memory that the Java virtual machine is using for this buffer pool
# TYPE jvm_buffer_memory_used_bytes gauge
jvm_buffer_memory_used_bytes{id="direct",} 118702.0
jvm_buffer_memory_used_bytes{id="mapped",} 0.0
# HELP jvm_buffer_count_buffers An estimate of the number of buffers in the pool
# TYPE jvm_buffer_count_buffers gauge
jvm_buffer_count_buffers{id="direct",} 10.0
jvm_buffer_count_buffers{id="mapped",} 0.0
# HELP jvm_gc_memory_allocated_bytes_total Incremented for an increase in the size of the (young) heap memory pool after one GC to before the next
# TYPE jvm_gc_memory_allocated_bytes_total counter
jvm_gc_memory_allocated_bytes_total 0.0
# HELP jvm_buffer_total_capacity_bytes An estimate of the total capacity of the buffers in this pool
# TYPE jvm_buffer_total_capacity_bytes gauge
jvm_buffer_total_capacity_bytes{id="direct",} 118702.0
jvm_buffer_total_capacity_bytes{id="mapped",} 0.0
# HELP logback_events_total Number of error level events that made it to the logs
# TYPE logback_events_total counter
logback_events_total{level="warn",} 0.0
logback_events_total{level="debug",} 0.0
logback_events_total{level="error",} 0.0
logback_events_total{level="trace",} 0.0
logback_events_total{level="info",} 25.0
# HELP request_success_counter_total
# TYPE request_success_counter_total counter
request_success_counter_total{demo="get_all_user_id",} 2.0
request_success_counter_total{demo="get_users",} 1.0
# HELP system_cpu_count The number of processors available to the Java virtual machine
# TYPE system_cpu_count gauge
system_cpu_count 4.0
# HELP jvm_threads_daemon_threads The current number of live daemon threads
# TYPE jvm_threads_daemon_threads gauge
jvm_threads_daemon_threads 13.0
# HELP jvm_threads_peak_threads The peak live thread count since the Java virtual machine started or peak was reset
# TYPE jvm_threads_peak_threads gauge
jvm_threads_peak_threads 27.0
# HELP jvm_memory_committed_bytes The amount of memory in bytes that is committed for the Java virtual machine to use
# TYPE jvm_memory_committed_bytes gauge
jvm_memory_committed_bytes{area="heap",id="PS Survivor Space",} 1.1534336E7
jvm_memory_committed_bytes{area="heap",id="PS Old Gen",} 6.8681728E7
jvm_memory_committed_bytes{area="heap",id="PS Eden Space",} 2.03948032E8
jvm_memory_committed_bytes{area="nonheap",id="Metaspace",} 4.8324608E7
jvm_memory_committed_bytes{area="nonheap",id="Code Cache",} 1.4352384E7
jvm_memory_committed_bytes{area="nonheap",id="Compressed Class Space",} 6684672.0
# HELP process_uptime_seconds The uptime of the Java virtual machine
# TYPE process_uptime_seconds gauge
process_uptime_seconds 587.891
# HELP jvm_memory_max_bytes The maximum amount of memory in bytes that can be used for memory management
# TYPE jvm_memory_max_bytes gauge
jvm_memory_max_bytes{area="heap",id="PS Survivor Space",} 1.1534336E7
jvm_memory_max_bytes{area="heap",id="PS Old Gen",} 1.244659712E9
jvm_memory_max_bytes{area="heap",id="PS Eden Space",} 5.95591168E8
jvm_memory_max_bytes{area="nonheap",id="Metaspace",} -1.0
jvm_memory_max_bytes{area="nonheap",id="Code Cache",} 2.5165824E8
jvm_memory_max_bytes{area="nonheap",id="Compressed Class Space",} 1.073741824E9
# HELP jvm_classes_loaded_classes The number of classes that are currently loaded in the Java virtual machine
# TYPE jvm_classes_loaded_classes gauge
jvm_classes_loaded_classes 9090.0
# HELP jvm_threads_live_threads The current number of live threads including both daemon and non-daemon threads
# TYPE jvm_threads_live_threads gauge
jvm_threads_live_threads 27.0
# HELP jvm_gc_max_data_size_bytes Max size of long-lived heap memory pool
# TYPE jvm_gc_max_data_size_bytes gauge
jvm_gc_max_data_size_bytes 1.244659712E9
# HELP system_cpu_usage The "recent cpu usage" for the whole system
# TYPE system_cpu_usage gauge
system_cpu_usage 0.23906219894981506
# HELP process_start_time_seconds Start time of the process since unix epoch.
# TYPE process_start_time_seconds gauge
process_start_time_seconds 1.60623930251E9
可以看到有很多系统默认的统计,也有我们自定义的
# HELP request_success_counter_total
# TYPE request_success_counter_total counter
request_success_counter_total{demo="get_all_user_id",} 2.0
request_success_counter_total{demo="get_users",} 1.0