#!/usr/bin/env python
#-*- coding:utf-8 -*-
import numpy as np
import matplotlib.pyplot as plt
from sklearn.cluster import KMeans
from sklearn import preprocessing
from scipy.spatial.distance import cdist
from sklearn import metrics

# 读取原始数据
X = []
y_true = []
id = []

f = open('data/wina.data')
for line in f:
    y = []
    for index,item in enumerate(line.split(",")):
        if index == 0:
            id.append(int(item))
            continue
        y.append(float(item))
    X.append(y)
# 转化为numpy array
X = np.array(X)
y_true = np.array(id)


min_max_scaler = preprocessing.MinMaxScaler()
X = min_max_scaler.fit_transform(X)


K = range(1, 10)
meandistortions = []
for k in K:
    kmeans = KMeans(n_clusters=k)
    kmeans.fit(X)
    meandistortions.append(sum(np.min(cdist(X, kmeans.cluster_centers_, 'euclidean'), axis=1)) / X.shape[0])
plt.plot(K, meandistortions, 'bx-')
plt.xlabel('k')
plt.ylabel('meandistortions')
plt.title('best K of the model')
plt.show()
n_clusters = 3


cls = KMeans(n_clusters).fit(X)
y_pre = cls.predict(X)

n_samples,n_features=X.shape     #总样本量,总特征数
inertias = cls.inertia_   #样本距离最近的聚类中心的总和
adjusted_rand_s=metrics.adjusted_rand_score(y_true,y_pre)           #调整后的兰德指数
homogeneity_s=metrics.homogeneity_score(y_true,y_pre)               #同质化得分
silhouette_s=metrics.silhouette_score(X,y_pre,metric='euclidean')   #平均轮廓系数
print("兰德指数ART",adjusted_rand_s)
print("同质化得分homo",homogeneity_s)
print("平均轮廓系数",silhouette_s)

centers=cls.cluster_centers_  #各类别中心

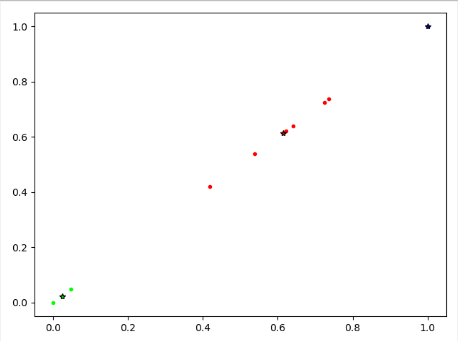
colors=['#ff0000','#00ff00','#0000ff']   #设置不同类别的颜色
plt.figure()    #建立画布
for i in range(n_clusters):    #循环读取类别
    index_sets=np.where(y_pre==i)  #找到相同类的索引集合、
    cluster=X[index_sets]   #将相同类的数据划分为一个聚类子集
    plt.scatter(cluster[:,0],cluster[:,0],c=colors[i],marker='.')   #展示聚类子集内的样本点
    plt.plot(centers[i][0],centers[i][0],'*',markerfacecolor=colors[i],markeredgecolor='k',markersize=6)
plt.show()
