学习
大页面和透明大页面
内存是由块管理,即众所周知的页面。一个页面有 4096 字节。1MB 内存等于 256 个页面。1GB 内存等于 256000 个页面等等。CPU 有内嵌的内存管理单元,这些单元中包含这些页面列表,每个页面都使用页表条目参考。
让系统管理大量内存有两种方法:
- 增加硬件内存管理单元中页表数
- 增大页面大小
第一个方法很昂贵,因为现代处理器中的硬件内存管理单元只支持数百或者书签页表条目。另外适用于管理数千页面(MB 内存)硬件和内存管理算法可能无法很好管理数百万(甚至数十亿)页面。这会造成性能问题:但程序需要使用比内存管理单元支持的更多的页面,该系统会退回到缓慢的基于软件的内存管理,从而造成整个系统运行缓慢。
红帽企业版 Linux 6 采用第二种方法,即使用超大页面。
简单说,超大页面是 2MB 和 1GB 大小的内存块。2MB 使用的页表可管理多 GB 内存,而 1GB 页是 TB 内存的最佳选择。
差大页面必须在引导时分配。它们也很难手动管理,且经常需要更改代码以便可以有效使用。因此红帽企业版 Linux 也部署了透明超大页面 (THP)。THP 是一个提取层,可自动创建、管理和使用超大页面的大多数方面。
THP 系统管理员和开发者减少了很多使用超大页面的复杂性。因为 THP 的目的是改进性能,所以其开发者(社区和红帽开发者)已在各种系统、配置、程序和负载中测试并优化了 THP。这样可让 THP 的默认设置改进大多数系统配置性能。
注:THP 目前只能映射异步内存区域,比如堆和栈空间。
Transparent Huge Pages的一些官方介绍资料:
Transparent Huge Pages (THP) are enabled by default in RHEL 6 for all applications. The kernel attempts to allocate hugepages whenever possible and any Linux process will receive 2MB pages if the mmap region is 2MB naturally aligned. The main kernel address space itself is mapped with hugepages, reducing TLB pressure from kernel code. For general information on Hugepages, see: What are Huge Pages and what are the advantages of using them?
The kernel will always attempt to satisfy a memory allocation using hugepages. If no hugepages are available (due to non availability of physically continuous memory for example) the kernel will fall back to the regular 4KB pages. THP are also swappable (unlike hugetlbfs). This is achieved by breaking the huge page to smaller 4KB pages, which are then swapped out normally.
But to use hugepages effectively, the kernel must find physically continuous areas of memory big enough to satisfy the request, and also properly aligned. For this, a khugepaged kernel thread has been added. This thread will occasionally attempt to substitute smaller pages being used currently with a hugepage allocation, thus maximizing THP usage.
In userland, no modifications to the applications are necessary (hence transparent). But there are ways to optimize its use. For applications that want to use hugepages, use of posix_memalign() can also help ensure that large allocations are aligned to huge page (2MB) boundaries.
Also, THP is only enabled for anonymous memory regions. There are plans to add support for tmpfs and page cache. THP tunables are found in the /sys tree under /sys/kernel/mm/redhat_transparent_hugepage.
2:命令
cat /sys/kernel/mm/transparent_hugepage/enabled 该命令适用于其它Linux系统
[root@getlnx06 ~]# cat /sys/kernel/mm/transparent_hugepage/enabled

always madvise [never]
使用命令查看时,如果输出结果为[always]表示透明大页启用了。[never]表示透明大页禁用、[madvise]表示
3:如何HugePages_Total返回0,也意味着透明大页禁用了
[root@getlnx06 ~]# grep -i HugePages_Total /proc/meminfo
HugePages_Total: 0
4:
cat /proc/sys/vm/nr_hugepages返回0也意味着透明大页禁用了,这个表示有多少个大页???
[root@jiangyi01.sqa.zmf /home/ahao.mah]
# cat /proc/sys/vm/nr_hugepages
0
设置2000个大页:
[root@jiangyi01.sqa.zmf /home/ahao.mah]
#echo 2000 >  /proc/sys/vm/nr_hugepages
发现默认,2000个透明大页是没有被用到
[root@jiangyi01.sqa.zmf /home/ahao.mah]
#grep -i HugePages_ /proc/meminfo
HugePages_Total:    2000
HugePages_Free:     2000
HugePages_Rsvd:        0
HugePages_Surp:        0
如何使用透明大页?
/proc/buddyinfo的理解
/proc/buddyinfo是linuxbuddy系统管理物理内存的debug信息。
在Linux中使用buddy算法解决物理内存的外碎片问题,其把所有空闲的内存,以2的幂次方的形式,分成11个块链表,分别对应为1、2、4、8、16、32、64、128、256、512、1024个页块。
而Linux支持NUMA技术,对于NUMA设备,NUMA系统的结点通常是由一组CPU和本地内存组成,每一个节点都有相应的本地内存,因此buddyinfo 中的Node0表示节点ID;而每一个节点下的内存设备,又可以划分为多个内存区域(zone),因此下面的显示中,对于Node0的内存,又划分类DMA、Normal、HighMem区域。而后面则是表示空闲的区域。
此处以Normal区域进行分析,第二列值为100,表示当前系统中normal区域,可用的连续两页的内存大小为100*2*PAGE_SIZE;第三列值为52,表示当前系统中normal区域,可用的连续四页的内存大小为52*2^2*PAGE_SIZE
cat /proc/buddyinfo
Node 0, zone      DMA     23     15      4      5      2      3      3      2      3      1      0
Node 0, zone   Normal    149    100     52     33     23      5     32      8     12      2     59
Node 0, zone  HighMem     11     21     23     49     29     15      8     16     12      2    142
PAGE_SIZE:在32位机中一般为4096。
PAGE_SIZE:在64位机中一般为
[root@jiangyi01.sqa.zmf /home/ahao.mah]
#cat /proc/buddyinfo
Node 0, zone      DMA      1      1      1      0      2      1      1      0      1      1      3
Node 0, zone    DMA32    263   3113   3988   2062   1922   1161    769    639    582      0      0
Node 0, zone   Normal   4033   5345  34166  41732  38549  26725  15639   9526   6372   1410  15443
原文解释
/proc/buddyinfo
This file is used primarily for diagnosing memory fragmentation issues. Using the buddy algorithm, each column represents the number of pages of a certain order (a certain size) that are available at any given time. For example, for zone DMA (direct memory access), there are 90 of 2^(0PAGE_SIZE) chunks of memory. Similarly, there are 6 of 2^(1PAGE_SIZE) chunks, and 2 of 2^(2*PAGE_SIZE) chunks of memory available.
The DMA row references the first 16 MB on a system, the HighMem row references all memory greater than 4 GB on a system, and the Normal row references all memory in between.
The following is an example of the output typical of /proc/buddyinfo:
[root@jiangyi01.sqa.zmf /home/ahao.mah]
#cat /proc/buddyinfo
Node 0, zone      DMA      1      1      1      0      2      1      1      0      1      1      3
Node 0, zone    DMA32    197   2692   4007   2065   1922   1161    769    639    582      0      0
Node 0, zone   Normal   3450    214  31052  41870  38553  26732  15642   9527   6373   1406  15443
Each column of numbers represents the number of pages of that order which are available. In the example below, there are 7 chunks of 2 ^ 0 * PAGE_SIZE available in ZONE_DMA, and 12 chunks of 2 ^ 3 * PAGE_SIZE available in ZONE_NORMAL, etc...
This information can give you a good idea about how fragmented memory is and give you a clue as to how big of an area you can safely allocate.
下面这段话很重要
When a Linux system has been running for a while memory fragmentation can increase which depends heavily on the nature of the applications that are running on it. The more processes allocate and free memory, the quicker memory becomes fragmented. And the kernel may not always be able to defragment enough memory for a requested size on time. If that happens, applications may not be able to allocate larger contiguous chunks of memory even though there is enough free memory available. Starting with the 2.6 kernel, i.e. RHEL4 and SLES9, memory management has improved tremendously and memory fragmentation has become less of an issue.
想看memory fragmentation 可以执行: echo m > /proc/sysrq-trigger
To see memory fragmentation you can use the magic SysRq key. Simply execute the following command:
# echo m > /proc/sysrq-trigger

This command will dump current memory information to /var/log/messages.
如果执行:echo m > /proc/sysrq-trigger 没有输出,那是因为你的sysrq没有enable,需要执行如下:
# echo 1 > /proc/sys/kernel/sysrq

Starting with the 2.6 kernel, i.e. RHEL4 and SLES9, you don’t need SysRq to dump memory information. You can simply check /proc/buddyinfo for memory fragmentation.
其实,从kernel2.6 开始,不需要执行:echo m > /proc/sysrq-trigger 才能dump memory information,也可以直接看/proc/buddyinfo文件
[root@jiangyi01.sqa.zmf /home/ahao.mah]
#echo 1 > /proc/sys/kernel/sysrq
[root@jiangyi01.sqa.zmf /home/ahao.mah]
#echo m > /proc/sysrq-trigger
[root@jiangyi01.sqa.zmf /home/ahao.mah]
#grep Normal /var/log/messages | tail -1
Mar  3 17:19:27 jiangyi01.sqa.zmf kernel: Node 0 Normal: 3745*4kB (UEM) 278*8kB (UEM) 31097*16kB (UEM) 41853*32kB (UEM) 38552*64kB (UEM) 26731*128kB (UEM) 15641*256kB (UEM) 9528*512kB (UEM) 6373*1024kB (UEM) 1406*2048kB (UEM) 15443*4096kB (UEMR) = 89285348kB
案例
背景:
公司某个大型业务系统反馈最近数据库服务器总是宕机(此处描述不准确,后面解释),最后,客户、运维人员都觉得实在是忍无可忍了,项目经理打电话找到我问是否能帮忙诊断一下,刚好第二天要去现场沟通另外一个系统的测试需求,于是答应第二天顺便看一下。
排查解决过程:
第二天来到现场,正在沟通需求的时候,运维人员突然说,操作又开始卡了,
于是连上服务器,先用top大概看了一下资源的使用情况,此时CPU已经基本上满载了,而且可以发现用户态的CPU占比并不高,大部分时间竟然都是内核态的CPU占用,
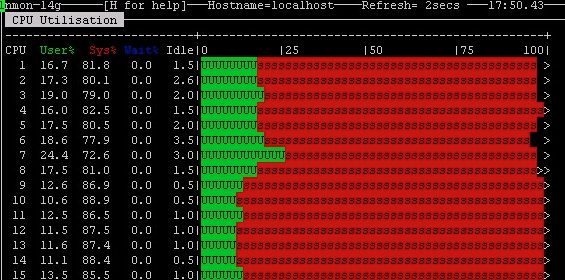
当时我开始怀疑可能是数据库服务对底层的某个调用出了问题,有死循环?
于是立刻用perf top大概看了一下,
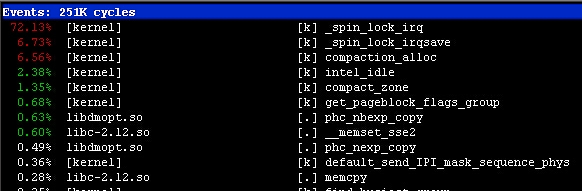
发现比重较大的是自旋锁还有一个compaction_alloc,内存碎片整理?
从该信息判断,可能是内存的什么操作导致了很多线程在临界区各种等待。
为了进一步弄明白具体是什么操作导致,于是对内核参数的调用栈进行取样
perf record -a -g -F 1000 sleep 60
“-g'的意思是按照调用关系存储数据;“-F 1000 sleep 60”表示按照每秒取1000个样本的频率取一分钟。
取完样后,使用perf report -g打开取样的数据,可以看到如下的调用栈:
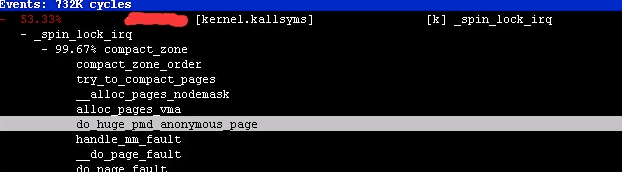
很明显这个自旋锁是由内存页的碎片整理导致,而进行碎片整理是由hugepage导致的,
看到这里的时候,我突然想起来linux的一个THP特性,貌似是kelnel 2.6.38版本后开始加进来的,
这个特性实际上就是会把这种巨页的使用对用户透明,用户不需要再进行巨页的配置,
内存会自动将连续的512个普通页作为一个巨页处理,
正如我们在前面的调用栈看到的,这种特性就需要对内存碎片进行整理,
所以我们看到的现象是内存碎片页移动导致的自旋锁,而根本原因是THP特性所导致的。
知道了问题原因,解决也就容易了,只要把THP关闭就可以了。
关闭的方法如下:
vi /etc/rc.local
在文件末尾添加如下指令:

if test -f /sys/kernel/mm/redhat_transparent_hugepage/enabled; then
   echo never > /sys/kernel/mm/redhat_transparent_hugepage/enabled
fi
if test -f /sys/kernel/mm/redhat_transparent_hugepage/defrag; then
   echo never > /sys/kernel/mm/redhat_transparent_hugepage/defrag
fi
保存后,重启即可。
PS:此处不同版本的linux路径会有些区别,自己看好了
vi /sys/kernel/mm/redhat_transparent_hugepage/enabled
如果显示如下:
即为关闭THP生效。
其实这样做完还不算完全解决问题,就如我们前面说的,
THP的引入是为了减少维护人员配置巨页的工作,我们把THP特性关掉了,
最好的实践是我们应该再根据我们数据库服务需要的共享内存大小进行hugepage的配置。
毕竟在现在动辄几十G,甚至上百G的内存,如果在按照4K普通页大小去维护TLB,也是一个很大的开销。
这里hugepage的配置,因为数据库不同,甚至数据库版本不同,配置过程也不大相同,最重要的一点,我发现这篇日志写的有点太长了。
因此,这里就不展开赘述了,有时间可以开帖讲一讲。
解决效果:
在进行如上两步处理后,连续观察了几天,果然再没有所谓的“宕机”事件了。
这里“宕机”用了引号,对应最前面反馈问题时项目经理所说的服务器宕机描述,其实这个描述本身就是错误的,明天我准备再针对这个详细解释一下:如何正确的提问。
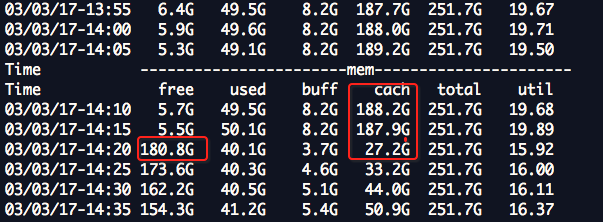
案例2: 瞬间内存中的cache大量释放,导致,IO压力很大
这个问题可能是因为,程序,在请求 连续的大的内存,虽然内存还是有的,但是,连续的大的内存片没有了,可能会导致,触发transparent_hugepage ,在el7上transparent_hugepage 默认又是开启的,所以,可以尝试改为never观察
#cat /sys/kernel/mm/transparent_hugepage/enabled
[always] madvise never
sudo sh -c 'echo never > /sys/kernel/mm/transparent_hugepage/enabled'
REF
http://www.cnblogs.com/itfriend/archive/2011/12/14/2287160.html