工作原理
存在一个样本数据集合,也称作训练样本集,并且样本集中每个数据都存在标签,即我们知道样本集中每一数据与所属分类的对应关系。输入没有标签的新数据后,将新数据的每个特征与样本集中数据对应的特征进行比较,然后算法提取样本集中特征最相似数据(最近邻)的分类特征。一般来说,我们只选择样本数据集中前k个最相似的数据,这就是k-近邻算法中k的出处,通常k是不大于20的整数。最后选择k个最相似数据中出现次数最多的分类,作为新数据的分类。
举个例子,现在我们用k-近邻算法来分类一部电影,判断它属于爱情片还是动作片。现在已知六部电影的打斗镜头、接吻镜头以及电影评估类型,如下图所示。
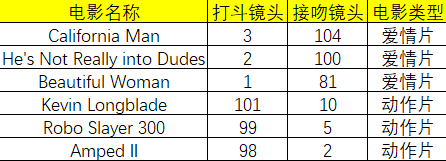
现在我们有一部电影,它有18个打斗镜头、90个接吻镜头,想知道这部电影属于什么类型。根据k-近邻算法,我们可以这么算。首先计算未知电影与样本集中其他电影的距离(先不管这个距离如何算,后面会提到)。现在我们得到了样本集中所有电影与未知电影的距离。按照距离递增排序,可以找到k个距离最近的电影。

现在假定k=3,则三个最靠近的电影依次是He's Not Really into Dudes、Beautiful Woman、California Man。
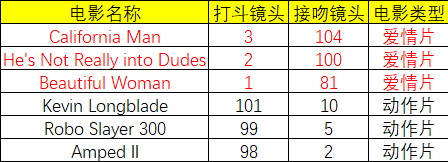
k-近邻算法按照距离最近的三部电影的类型,决定未知电影的类型,而这三部电影全是爱情片,因此我们判定未知电影是爱情片。
python实现
首先编写一个用于创建数据集和标签的函数,要注意的是该函数在实际用途上没有多大意义,仅用于测试代码。
def createDataSet():
    group = array([[1.0,1.1],[1.0,1.0],[0,0],[0,0.1]])
    labels = ['A','A','B','B']
    return group, labels
然后是函数classify0(),该函数的功能是使用k-近邻算法将每组数据划分到某个类中,其伪代码如下:
对未知类别属性的数据集中的每个点依次执行以下操作:
(1)计算已知类别数据集中的点与当前点之间的距离;
(2)按照距离递增次序排序;
(3)选取与当前点距离最小的k个点;
(4)确定前k个点所在类别的出现频率;
(5)返回前k个点出现频率最高的类别作为当前点的预测分类。
Python代码如下:
def classify0(inX, dataSet, labels, k):
    dataSetSize = dataSet.shape[0]  # shape[0]表示矩阵有多少行 shape[1]表示矩阵有多少列
    diffMat = tile(inX, (dataSetSize,1)) - dataSet  # 计算Ai-Bi
    sqDiffMat = diffMat**2  #计算(Ai-Bi)^2
    sqDistances = sqDiffMat.sum(axis=1) # 计算(A0-B0)^2+...+(Ai-Bi)^2
    distances = sqDistances**0.5    # 计算((A0-B0)^2+...+(Ai-Bi)^2)^0.5 也就是欧式距离
    sortedDistIndicies = distances.argsort()    # 得到数组的值按递增排序的索引
    classCount = {}
    for i in range (k): #距离最近的k个点
        voteIlabel = labels[sortedDistIndicies[i]]
        classCount[voteIlabel] = classCount.get(voteIlabel, 0)+1    # 如果voteIlabels的key不存在就返回0
    sortedClassCount = sorted(classCount.items(),key=operator.itemgetter(1), reverse=True)
    return sortedClassCount[0][0]
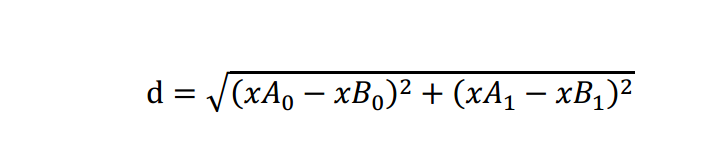
该函数具有4个输入参数,分别是待分类的输入向量inX、输入的训练样本集dataSet、标签向量labels、选择距离最近的k个点。其中距离使用欧式距离,计算公式如下:
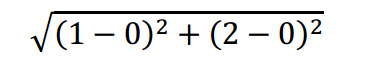
例如,点(0,0)与(1,2)之间的欧式距离计算为:
如果数据集存在4个特征值,则点(1,0,0,1)与(7,6,9,4)之间的欧式距离计算为:

计算完所有点之间的距离后,可以对数据按照从小到大的次序排序。然后,确定前k个距离最小元素所在的主要分类。输入k总是正整数;最后,将classCount字典分解为元组列表,然后按照从大到小的次序进行排序,最后返回频率最高的元素标签。
运行程序后得到如下结果应该是B
算法实战
举两个例子,一个是约会对象的好感度预测,一个是手写识别系统。
约会对象好感度预测
故事背景
海伦小姐是一个大龄单身女青年,她一直通过网络寻找适合自己的另一半。尽管网上会遇到不一样的约会对象,但是她并不是喜欢每一个人。经过一番总结,她发现她曾和三种类型的人约会过:
- [ ] 不喜欢的人
- [ ] 魅力一般的人
- [ ] 极具魅力的人
她还发现当她归类约会对象时主要考虑以下三个特征:
- [ ] 月收入
- [ ] 颜值
- [ ] 每周跑步的公里数
她将这些数据保存在文本文件datingTestSet2.txt中。
准备数据:从文本文件中解析数据
首先要将待处理数据的格式改变为分类器可以接受的格式。创建名为file2matrix()的函数,以此来处理输入格式问题。该函数的输入为文件名字符串,输出为训练样本矩阵和类标签向量。
def file2matrix(filename):
    fr = open(filename,encoding = 'utf-8')
    arrayOfLines = fr.readlines()   #读取文件的每一行
    numberOfLines = len(arrayOfLines) #获得文件行数
    returnMat = zeros((numberOfLines,3))
    classLabelVector = []
    index = 0
    for line in arrayOfLines:
        line = line.strip() #去除首尾空格和回车
        listFromLine = line.split() #按照tab键分割数据
        returnMat[index,:] = listFromLine[0:3]
        classLabelVector.append(int(listFromLine[-1]))
        index += 1
    return  returnMat,classLabelVector
打开文件,得到文件的行数。然后创建以零填充的矩阵。循环处理文件中的每行数据,首先使用函数line.strip()截取掉所有的回车字符,然后使用tab字符 将上一步得到的整行数据分割成一个元素列表。接着,选取前3个元素,将它们存到特征矩阵中。利用负索引将列表的最后一列存储到向量classLabelVector中。
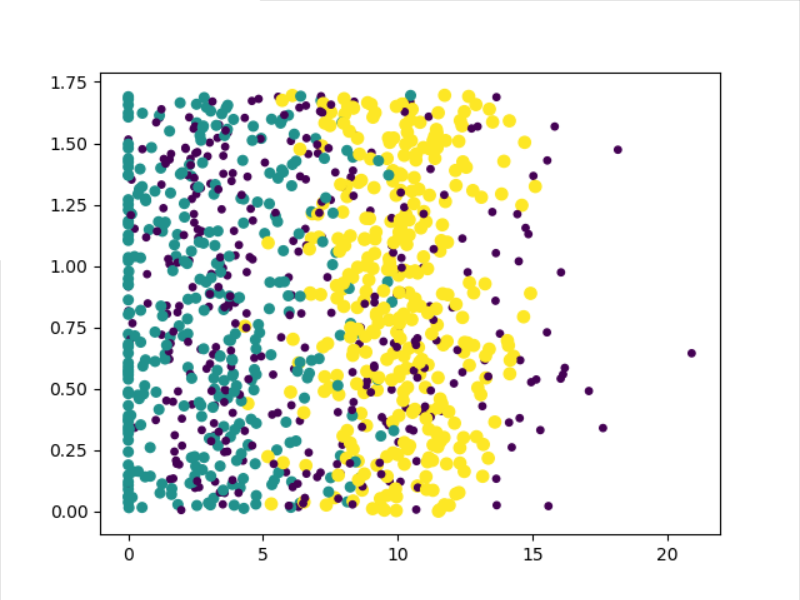
分析数据:使用Matplotlib创建散点图
这一步不过多解释,创建可视化数据图。
def drawFig(datingDataMat,datingLabels):
    fig = plt.figure()
    ax = fig.add_subplot(111)
    ax.scatter(datingDataMat[:, 1], datingDataMat[:, 2],15.0*array(datingLabels), 15.0*array(datingLabels))
    plt.show()
准备数据:归一化数值
因为月收入的数值和其他两个特征相比大很多,因此对于计算距离的影响远大于其他两个特征。但是在海伦看来这是三个等权重的特征,月收入不应该如此严重地影响到计算结果。
因此我们需要进行数值归一化。采用公式newValue = (oldValue-min)/(max-min)可以将任意取值范围的特征值转化为0到1的区间。其中min和max分别是数据集中最小特征值和最大特征值。
def autoNorm(dataSet):
    minVals = dataSet.min(0)    #参数0可以从选取每一列的最小值组成向量
    maxVals = dataSet.max(0)
    ranges = maxVals - minVals
    normDataSet = zeros(shape(dataSet))
    m = dataSet.shape[0]
    normDataSet = dataSet - tile(minVals,(m,1))
    normDataSet = normDataSet/tile(ranges,(m,1))
    return normDataSet, ranges, minVals
测试算法:作为完整程序验证分类器
在数据集中选取10%的数据作为测试数据。
def datingClassTest():
    hoRatio = 0.10  # 10%的数据作为测试集
    datingDataMat, datingLabels = file2matrix("datingTestSet2.txt")  # load data setfrom file
    normMat, ranges, minVals = autoNorm(datingDataMat)
    m = normMat.shape[0]
    numTestVecs = int(m * hoRatio)
    errorCount = 0.0
    for i in range(numTestVecs):
        classifierResult = classify0(normMat[i, :], normMat[numTestVecs:m, :], datingLabels[numTestVecs:m], 3)
        print("the classifier came back with: %d, the real answer is: %d" % (classifierResult, datingLabels[i]))
        if (classifierResult != datingLabels[i]): errorCount += 1.0
    print("the total error rate is: %f" % (errorCount / float(numTestVecs)))
得到结果如下:
the classifier came back with: 3, the real answer is: 3
the classifier came back with: 2, the real answer is: 2
the classifier came back with: 1, the real answer is: 1
the classifier came back with: 1, the real answer is: 1
...
the classifier came back with: 3, the real answer is: 3
the classifier came back with: 3, the real answer is: 3
the classifier came back with: 2, the real answer is: 2
the classifier came back with: 1, the real answer is: 1
the classifier came back with: 3, the real answer is: 1
the total error rate is: 0.050000
错误率仅为5%左右,基本上可以正确的分类。
使用算法:构建完整可用的系统
def classifyPerson():
    resultList = ["not at all", "in small doses", "in large doses"]
    percentTats = float(input("monthly income?"))
    ffMiles = float(input("level of appearance?"))
    iceCream = float(input("running miles per month?"))
    datingDataMat, datingLabels = file2matrix("datingTestSet2.txt")  # load data setfrom file
    normMat, ranges, minVals = autoNorm(datingDataMat)
    inArr = array([ffMiles, percentTats, iceCream])
    classifierResult = classify0(inArr, datingDataMat, datingLabels, 3)
    print("You will probably like this person:",resultList[classifierResult-1])
海伦可以将她要约会的对象信息输入程序,程序会给出她对对方的喜欢诚度的预测值。例如输入一个月收入为20000、颜值为5、每周运动量为1公里的数据,得到的结果是:
monthly income?20000
level of appearance?5
running miles per month?1
You will probably like this person: in small doses
手写识别系统
为了简单起见,这里只识别数字0-9。数据集分为训练集和测试集分别存放在两个文件夹下。
准备数据:将图像转换为测试向量
和之前一个例子不一样的地方在于数据的处理上。我们必须将图像格式处理为一个向量。我们将32x32的二进制图像矩阵转换为1x1024的向量。
编写函数img2vector,将图像转换为向量。
def img2vector(filename):
    returnVector = zeros((1,1024))
    fr = open(filename)
    for i in range(32):
        lineStr = fr.readline()
        for j in range(32):
            returnVector[0,32*i+j] = int(lineStr[j])
    return returnVector
测试算法:使用k-近邻算法识别手写数字
def handwritingClassTest():
    hwLabels = []
    trainingFileList = listdir("trainingDigits")
    mTrain = len(trainingFileList)
    trainingMat = zeros((mTrain,1024))
    for i in range(mTrain):
        filenameStr = trainingFileList[i]
        fileStr = filenameStr.split('.')[0]
        classNum = int(fileStr.split('_')[0])
        hwLabels.append(classNum)
        trainingMat[i,:] = img2vector("trainingDigits/%s"%filenameStr)
    testFileList = listdir("testDigits")
    errorCount = 0.0
    mTest = len(testFileList)
    for i in range(mTest):
        filenameStr = testFileList[i]
        fileStr = filenameStr.split('.')[0]
        classNum = int(fileStr.split('_')[0])
        testVector = img2vector("testDigits/%s"%filenameStr)
        classifierResult = classify0(testVector, trainingMat, hwLabels, 4)
        print("the classifier came back with: %d, the real answer is: %d" %(classifierResult, classNum))
        if(classifierResult != classNum):
            errorCount += 1.0
    print("
the total number of errors is: %d" % errorCount)
    print("
the total error rate is: %f" % (errorCount / float(mTest)))
得到结果如下:
the classifier came back with: 0, the real answer is: 0
the classifier came back with: 0, the real answer is: 0
the classifier came back with: 0, the real answer is: 0
the classifier came back with: 0, the real answer is: 0
the classifier came back with: 0, the real answer is: 0
...
the classifier came back with: 9, the real answer is: 9
the classifier came back with: 9, the real answer is: 9
the classifier came back with: 9, the real answer is: 9
the classifier came back with: 9, the real answer is: 9

the total number of errors is: 11

the total error rate is: 0.011628
小结
k-近邻算法是分类数据最简单最有效的算法。k-近邻是基于实例的学习,使用算法时必须有大量接近实际数据的训练样本数据。k-近邻算法必须保存全部数据集,如果训练的数据集很大,必须使用大量的存储空间。此外,由于必须对数据集中的每个数据计算距离值,实际使用时可能非常耗时。
附录
文中代码及数据集:https://github.com/Professorchen/Machine-Learning/tree/master/kNN