一. 插件安装
下载jmeter-plugins-manager-1.3 jar插件
放置到jmeter的lib/ext文件夹下
重启jmeter
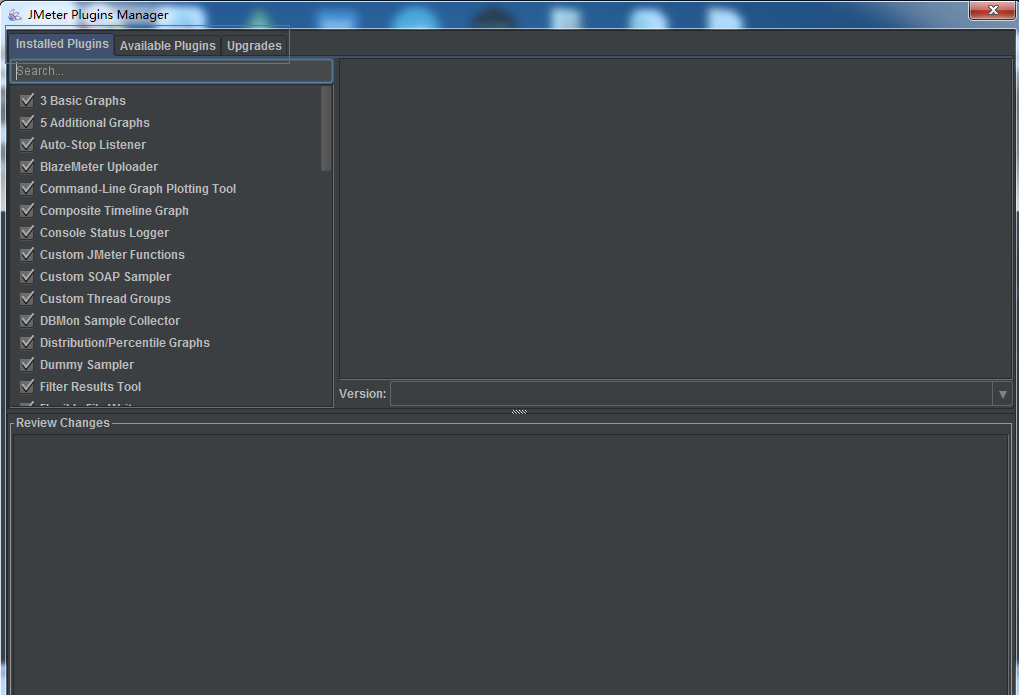
打开插件管理器
选项options > plugins manager
Installed Plugins:已经安装的插件
Available Plugins:可以被安装的插件
Upgrades:需要升级的插件
Available Plugins中选中插件(关键字soap/jpgc)——Apply Chages and Restart Jmeter


二. 插件功能介绍
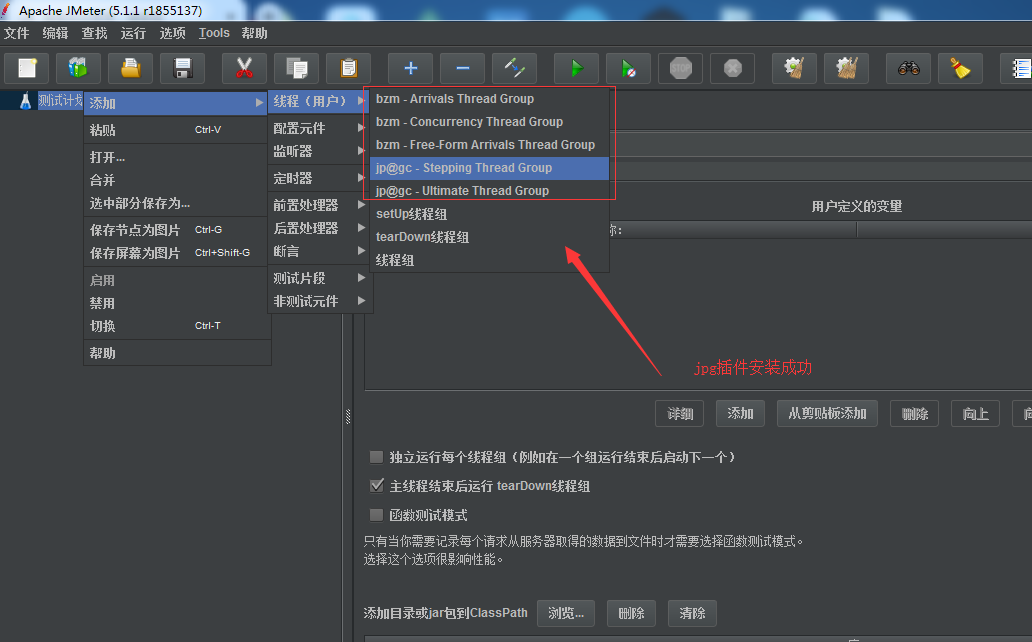
1. 线程组
jp@gc-Stepping Thread Group 阶梯线程组
jp@gc-Utilmate Thread Group 终极线程组
2. 取样器
Custom SOAP Sampler SOAP取样器
3. 监视器
jp@gc-Active Threads Over Time
jp@gc-Flexible File Writer
jp@gc-PerMon Metrics Collector
jp@gc-Response Times Over Time
jp@gc-Transactions per Second
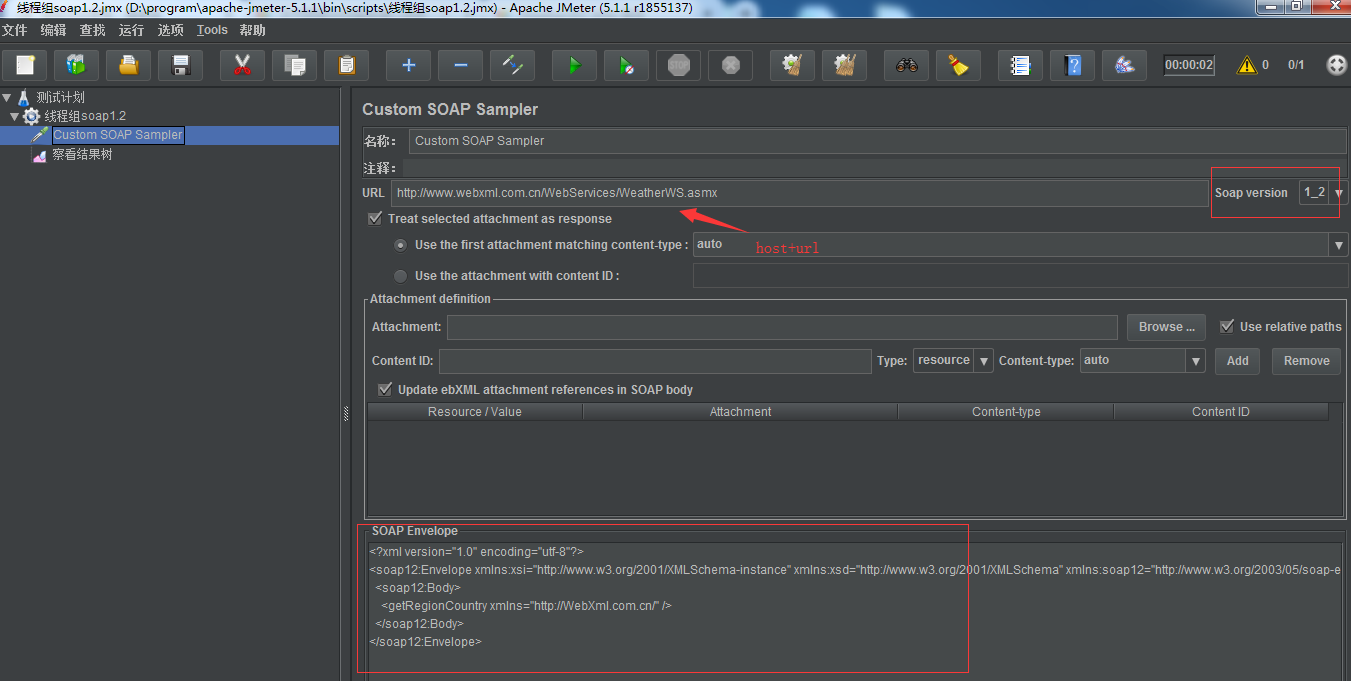
三. soup接口的另一种方法:Custom SOAP Sampler
http+xml不能兼容jmeter3.x写的soap接口,为了兼容,这里提供了另一种方法
1. url: 输入soap地址
soap version:选择1_2
2. soap envolope:输入soap的接口请求内容

响应结果里乱码问题怎么解决见博客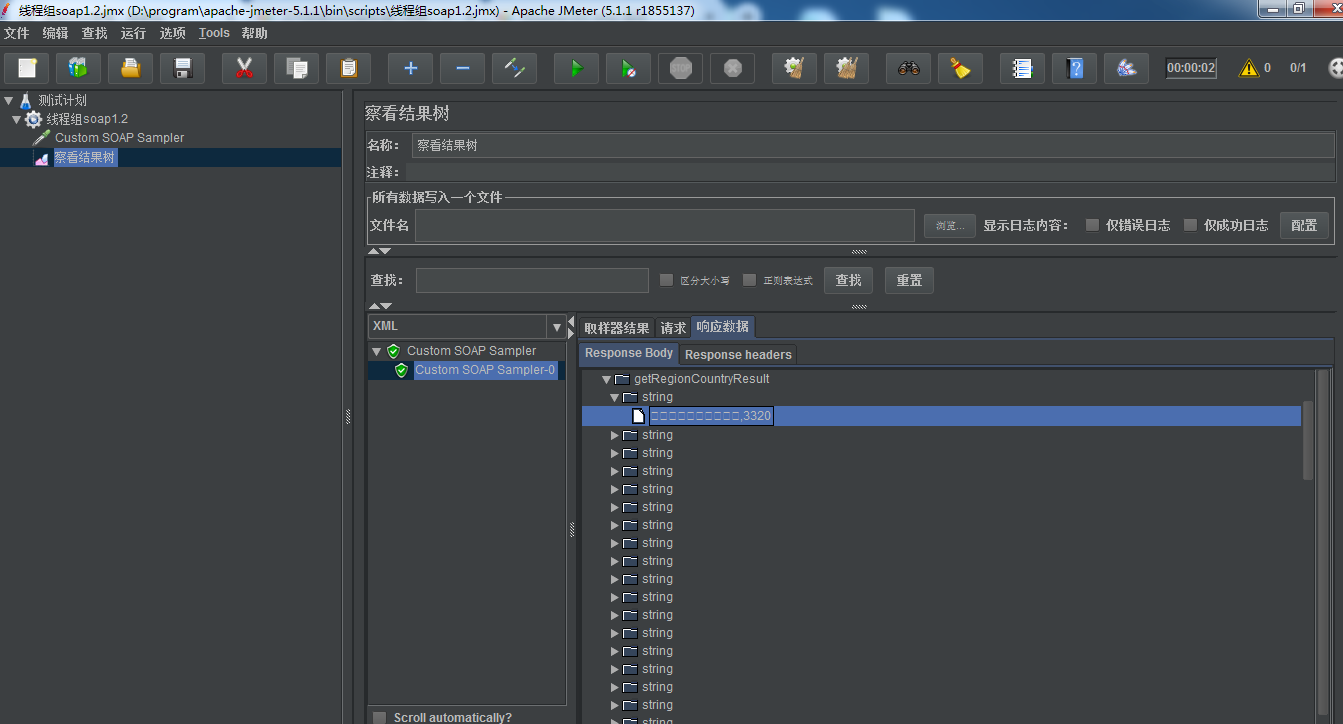
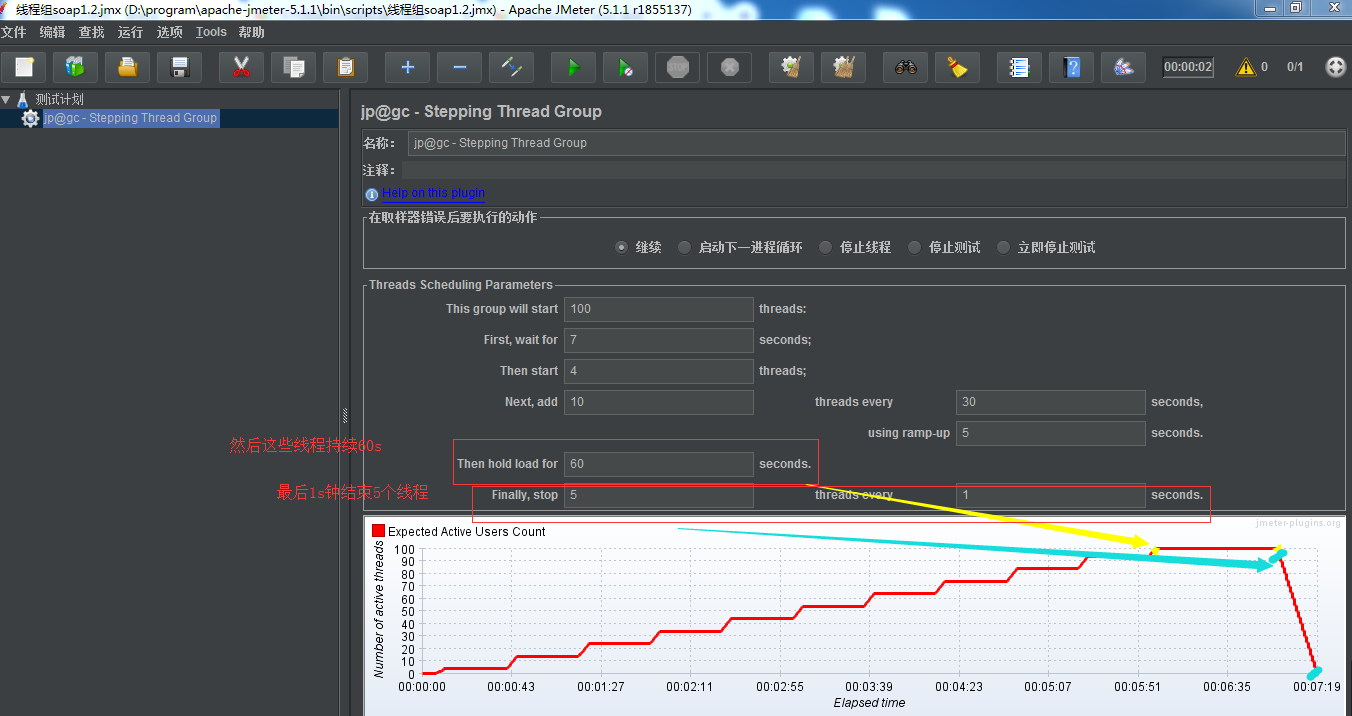
四. Stepping Thread Group 阶梯场景设计:找出性能瓶颈,做负载测试
Threads Scheduling Parameters
This group will start 100 threads 总线程数 xx
First, wait for 0 seconds 启动第一个线程前,需要等待xx秒
Next,add 10 threads every 30 seconds. 每隔xx秒启动xx个线程
using ramp-up 5 seconds 用xx秒启动
Then hold load for 60 seconds 总线程都启动后,持续运行 xx 秒
Finally,stop 5 threads every 1 seconds. 最后,每 xx 秒停止 xx 个线程

用5s种去加载10个线程,这10个线程去运行30s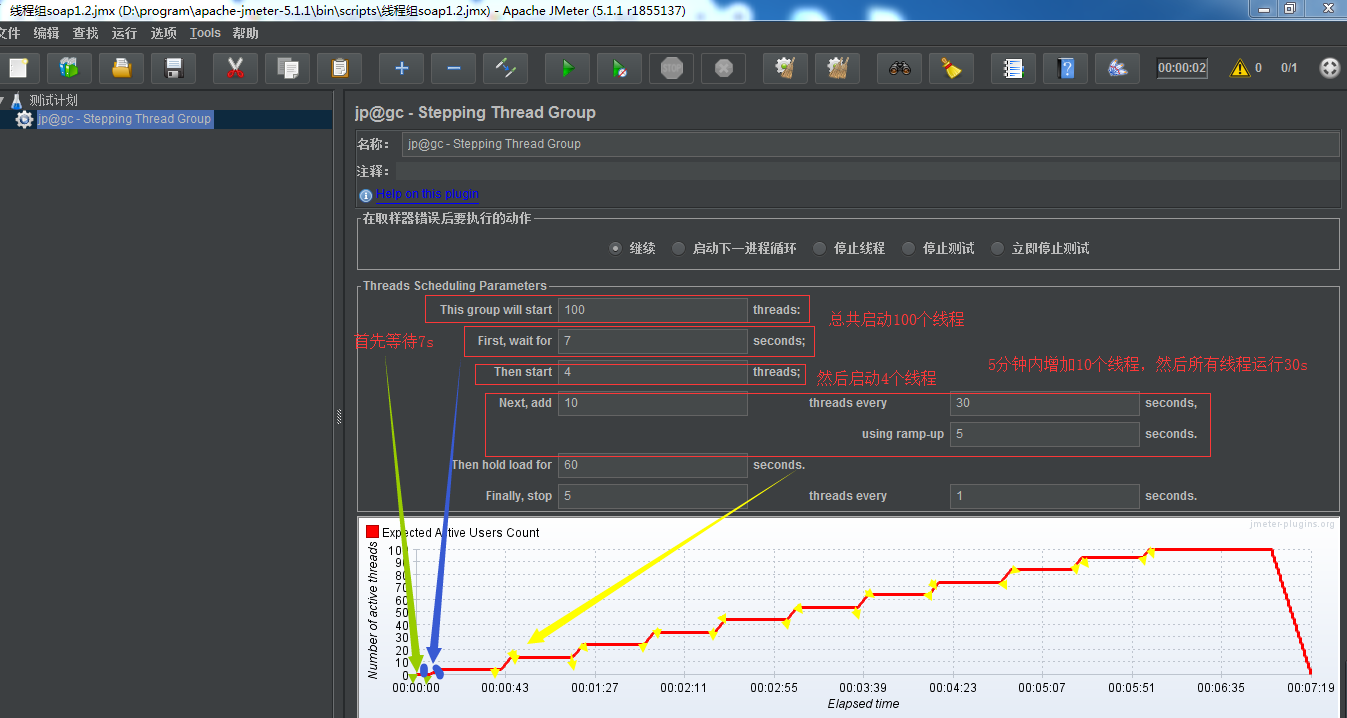
适用场景:
负载测试,找出性能的瓶颈
不知道性能拐点,寻找拐点
设计难点:
下一步启动线程数和运行时间
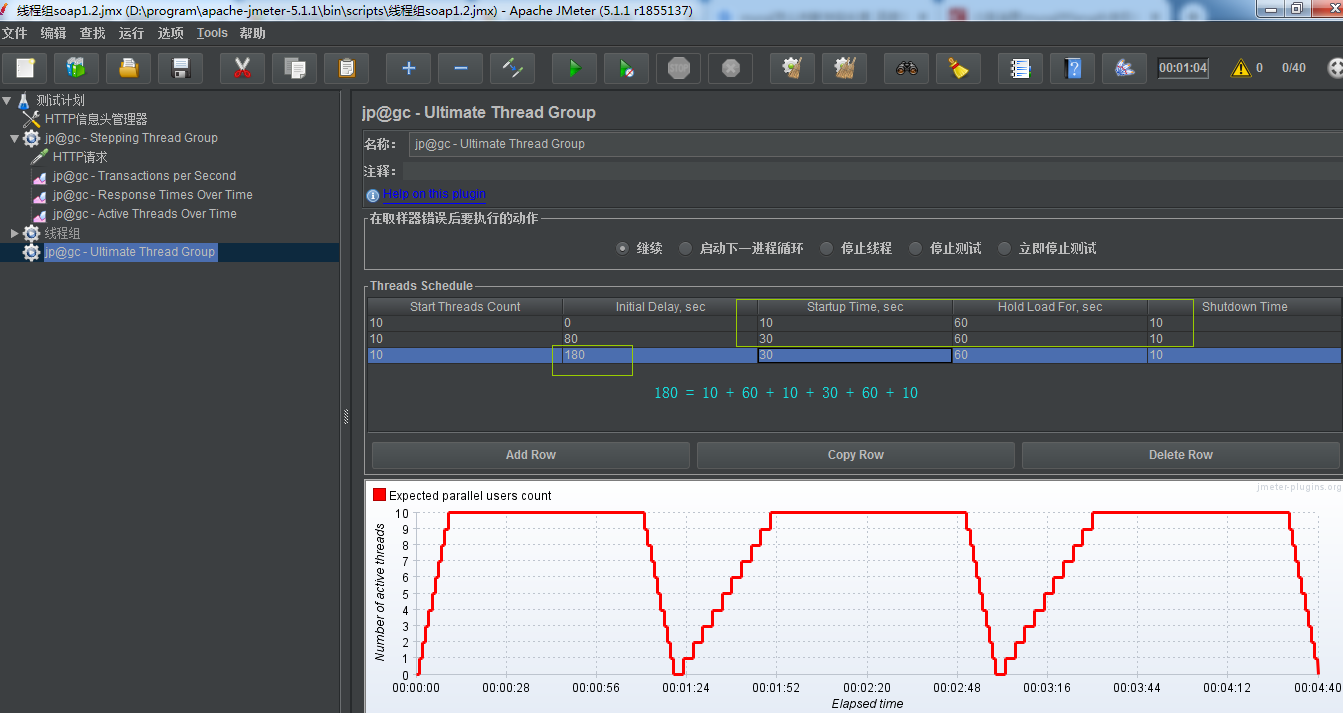
五. Ultimate Thread Group 波浪型场景设计
Threads Scheduling
Start Threads Count 线程数 xx
Initial Delay, sec 初始化时间 单位秒
Startup Time, sec 启动时间,单位秒
Hold load for .sec 持续运行时间,单位秒
Shutdown Time 停止所有线程共用几秒

使用场景
有时间规律
验证服务器资源(内存)能否及时回收,有没有出现内存泄漏的情况
设计难点
下一个波浪,在上一个波浪总耗时之后开始
六. Ultimate Thread Group 设计阶梯场景
设计难点
计算一个任务线程运行时间
七. 插件监视器
Transactions per Second --TPS
Response Times Over Time --响应时间线
Active Threads Over Time --实时线程数
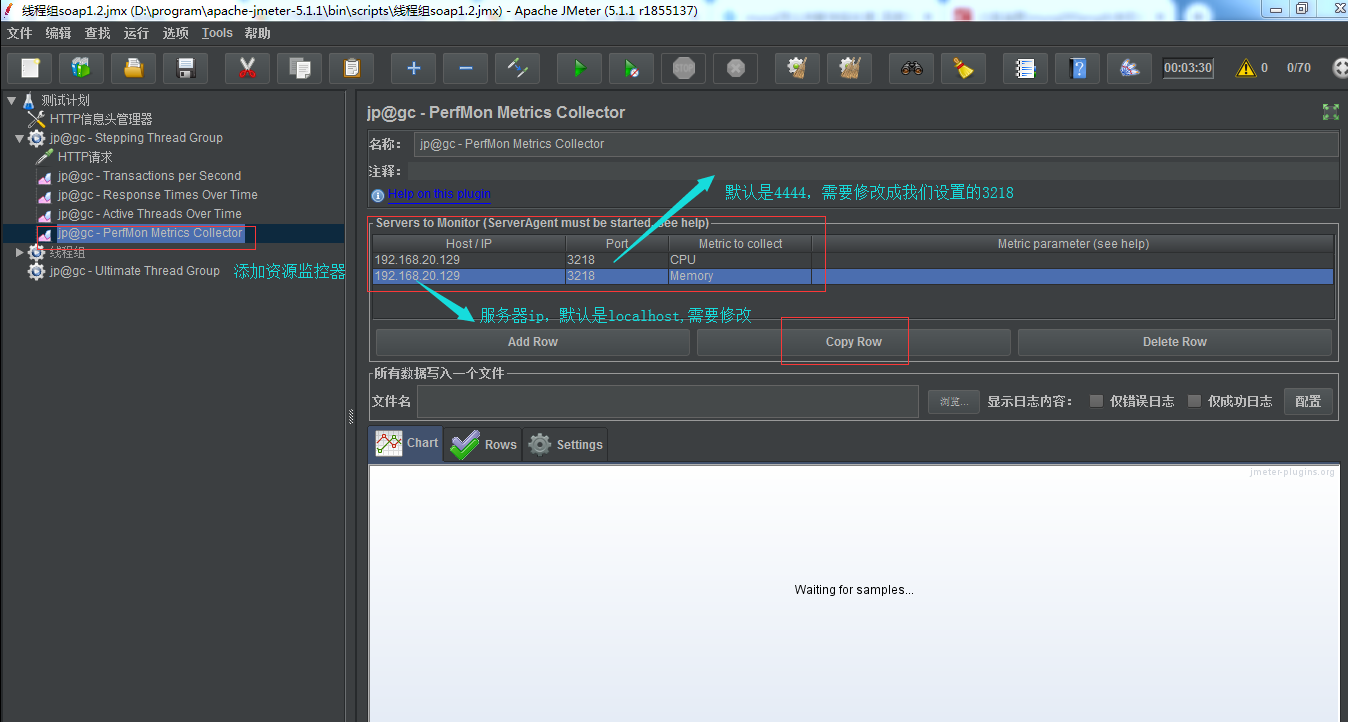
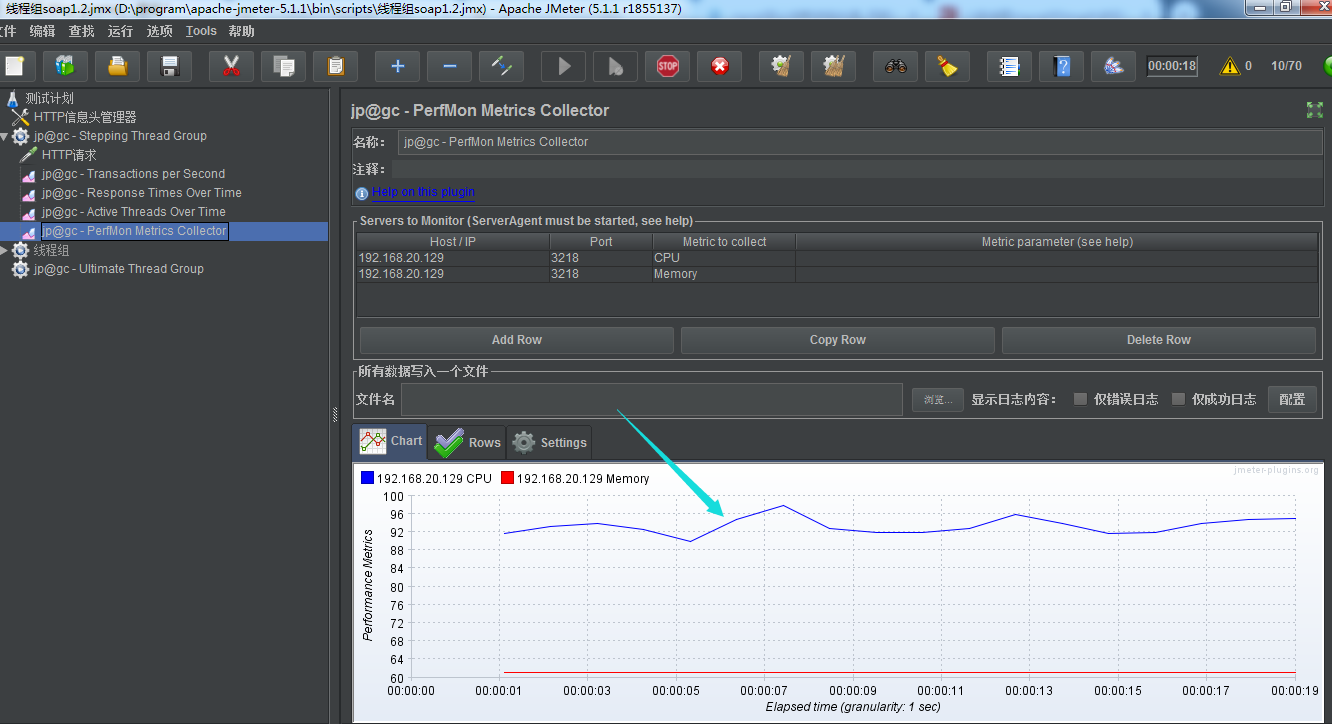
PerfMon metrics Collector --资源监控
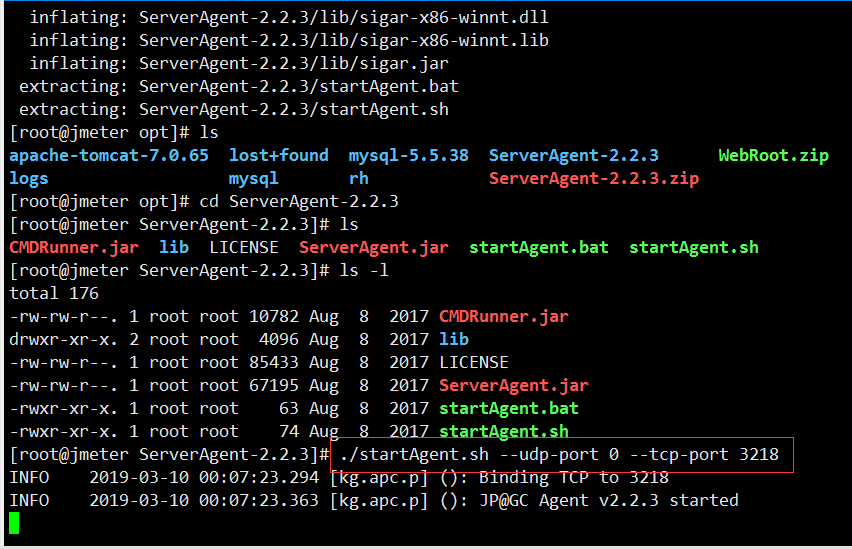
八. 资源监视工具
资源监控软件:SeverAgent
上传到服务器:rz 选择ServerAgent-2.2.3.zip
解压:unzip ServerAgent-2.2.3.zip
启动服务:默认端口是4444,可能被阿里云禁用,因此需要修改端口(--udp-port 0表示禁用udp)
./startagent.sh --udp-port 0 --tcp-port 3218
或 java -jar ./CMDRunner.jar --tool PerfMonAgent --udp-port 0 --tcp-port 3218
端口:3218可以自己定义
添加资源监视器:PerfMon Metries Collector
servers to moniter
ip port cpu/memory
udp:无连接 tcp:面向连接

运行过程中不要停掉startAgent服务