一、代码
html代码
1 <!-- html -->
2 <nz-card   style="background-color: #0e0b2a;border: 0px;color: #8cc5fe;min-height: 180px; 100%;height: 100%;">
3     <div style="padding: 4px 12px;height: 200px;">
4         <label>
5                 {{title}}
6         </label>
7         <div echarts id="powerline" [options]="option" (chartInit)="onChartInit($event)"   [loading]="isLoading" [loadingOpts]="loadingOpts" [autoResize]="'true'"  style="position: relative;left: 4px;-webkit-tap-highlight-color: transparent;user-select: none;overflow-y: hidden; 100%;height: 100%;"  class="demo-chart"></div>
8     </div>
9 </nz-card>
ts代码
  1 import { Component, OnInit, Input, SimpleChanges, HostListener, ElementRef } from '@angular/core';
  2 import * as echarts from 'echarts';
  3 import { fromEvent } from 'rxjs';
  4
  5 @Component({
  6   selector: 'app-powerline',
  7   templateUrl: './powerline.component.html',
  8   styleUrls: ['./powerline.component.css']
  9 })
 10 export class PowerlineComponent implements OnInit {
 11   @Input() title:string;
 12   @Input() value:any;
 13
 14
 15
 16   public option:any;
 17   public  echartsInstance: any;
 18
 19   //时间轴
 20   private timeline_data:any;
 21   //功率曲线轴
 22   private power_data:any;
 23
 24   //自定义监听事件
 25   private pageResize:any;
 26   constructor(private el:ElementRef) {
 27     //监听窗口resize事件,调用重绘图表方法,重新绘图
 28     this.pageResize = fromEvent(window, 'resize').subscribe(() => {
 29         this.resizeChart();
 30     });
 31   }
 32
 33   //ngx-echarts初始化,获得图表实例
 34   onChartInit(event) {
 35     this.echartsInstance = event;
 36  }
 37
 38
 39   //重新绘制图表
 40   resizeChart() {
 41     if (this.echartsInstance) {
 42       this.echartsInstance.resize();
 43     }
 44   }
 45
 46   ngOnInit() {
 47
 48   }
 49
 50   ngOnChanges(changes: SimpleChanges): void {
 51     // this.power_data = this.processPowerLineData();
 52     this.option = {
 53       title: {
 54           text: '',
 55       },
 56       tooltip: {
 57           trigger: 'axis'
 58       },
 59       legend: {
 60         data:['功率'],
 61         bottom :10,
 62       },
 63       grid:{
 64         x:35,
 65         y:25,
 66         x2:30,
 67         y2:50,
 68         borderWidth:1
 69       },
 70       toolbox: {
 71           show: false,
 72           feature: {
 73               magicType: {show: false, type: ['stack', 'tiled']},
 74               saveAsImage: {show: false}
 75           }
 76       },
 77       xAxis: {
 78           name:'时间',
 79           type: 'category',
 80           nameGap :6,
 81           nameTextStyle :{
 82             color :'#364c64',
 83           },
 84           boundaryGap: false,
 85           axisLine :{
 86               show:true,
 87               lineStyle :{
 88                   color:'#083b73',
 89                   width :0,
 90                   //shadowOffsetY :10,
 91               },
 92           },
 93           axisTick :{
 94               show:false,
 95           },
 96           splitLine :{
 97               show:false,
 98           },
 99           axisLabel:{
100              color :'#364c64' ,
101
102           },
103           data: this.processTimeLineData(),
104       },
105       yAxis: [{
106           type: 'value',
107           name:'功率(KW)',
108           max:1000,
109           nameTextStyle :{
110             color :'#364c64',
111           },
112           axisLine :{
113               show:true,
114               lineStyle :{
115                   color:'#19193f',
116                   width :2,
117                   //shadowOffsetY :10,
118               },
119           },
120           axisTick :{
121               show:false,
122           },
123           splitLine :{
124               show:false,
125           },
126           axisLabel:{
127             color :'#364c64' ,
128             margin:35,
129             textStyle: {
130                      align:'left',
131                      // baseline:'left',
132                      // left:-40,
133              }
134
135           },
136
137       },{
138           type: 'value',
139           name:'',
140           max:2500,
141           axisLine :{
142               show:true,
143               lineStyle :{
144                   color:'#19193f',
145                   width :2,
146               },
147           },
148           axisTick :{
149               show:false,
150           },
151           splitLine :{
152               show:false,
153           },
154           axisLabel:{
155              color :'#22a0f3' ,
156
157           },
158
159       }],
160       series: [{
161           name: '功率',
162           type: 'line',
163           symbol: 'none',
164           itemStyle :{
165               show: false,
166               color :'#22a0f3',
167               borderWidth :1,
168           },
169           lineStyle :{
170             color:'#22a0f3',
171             //type:'dashed',
172           },
173           smooth: true,
174           data:this.processPowerLineData(),
175         //   data:this.power_data,
176         //   data: [300, 590, 350, 790, 360, 550, 450,300, 590, 350, 790,300, 590, 350, 790, 360, 550, 450,300, 590, 350,300, 590,580]
177       }]
178     };
179
180 }
181
182
183   //处理功率曲线时间轴数组
184   processTimeLineData(){
185     const _self=this;
186     _self.timeline_data = [];
187     if(_self.value){
188         if(0 != _self.value.length){
189             _self.value.map(
190                 item =>{
191                     let tem_a = item.time;
192                     if(tem_a.length ==1){
193                         tem_a = "0" + item.time + ":00";
194                     }else if(tem_a.length == 2){
195                         tem_a = item.time + ":00";
196                     }else{
197                         tem_a = item.time + ":00";
198                     }
199                     // parseInt(item.tem_a)
200                     _self.timeline_data.push(tem_a);
201                 }
202             )
203         }else{
204             _self.timeline_data = ['00:00','01:00','02:00','03:00','04:00','05:00','06:00','07:00','08:00','09:00','10:00','11:00','12:00','13:00','14:00','15:00','16:00','17:00','18:00','19:00','20:00','21:00','22:00','23:00',"24:00"];
205         }
206     }else{
207         _self.timeline_data = ['00:00','01:00','02:00','03:00','04:00','05:00','06:00','07:00','08:00','09:00','10:00','11:00','12:00','13:00','14:00','15:00','16:00','17:00','18:00','19:00','20:00','21:00','22:00','23:00',"24:00"];
208     }
209     return _self.timeline_data;
210 }
211
212   //处理功率曲线数据数组
213   processPowerLineData(){
214       const _self=this;
215       _self.power_data = [];
216       if(_self.value){
217           if(0 != _self.value.length){
218             _self.value.map(
219                 item =>{
220                     _self.power_data.push(parseInt(item.powerp)) ;
221                 }
222             )
223           }else{
224             _self.power_data = [0,0,0,0,0,0,0,0,0,0,0,0,0,0,0,0,0,0,0,0,0,0,0,0];
225           }
226       }else{
227         _self.power_data = [0,0,0,0,0,0,0,0,0,0,0,0,0,0,0,0,0,0,0,0,0,0,0,0];
228       }
229       return _self.power_data;
230   }
231
232
233   ngOnDestroy(): void {
234       //销毁功率因数曲线的订阅事件
235       if(this.pageResize){
236         this.pageResize.unsubscribe();
237       }
238   }
239
240 }
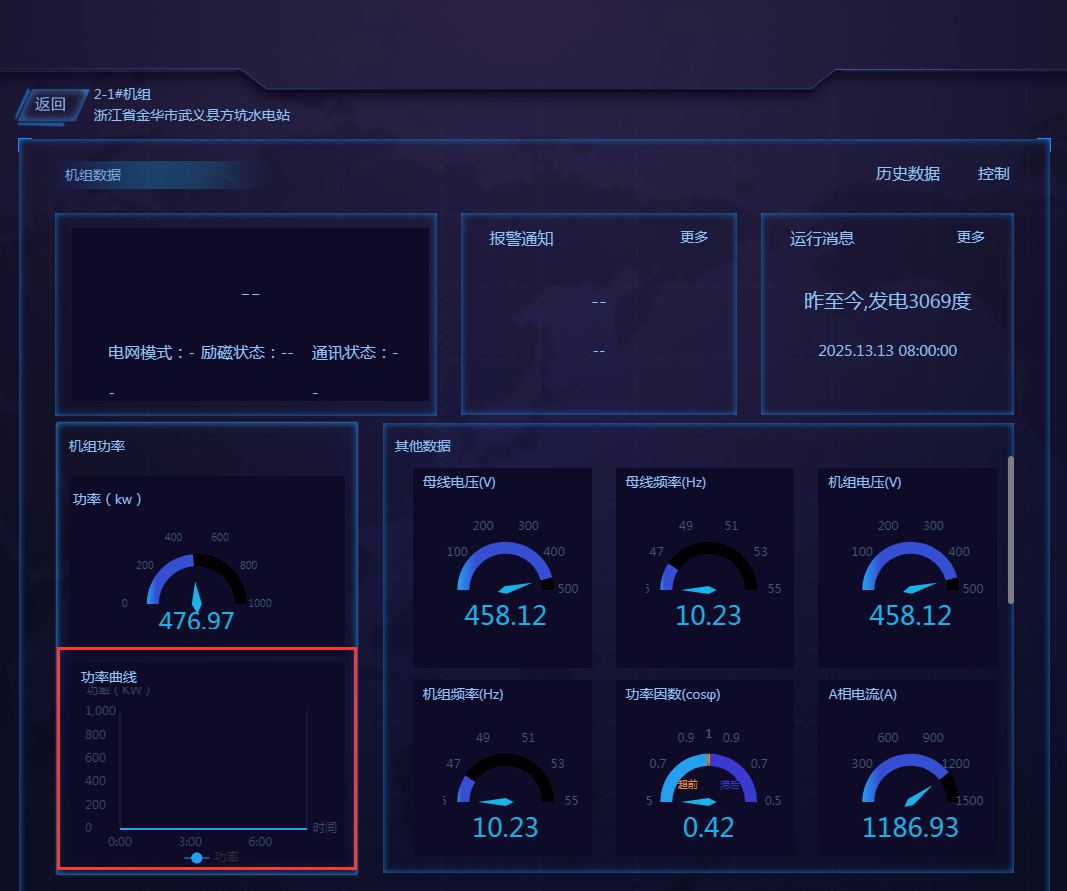
二、截图
改变窗口大小前:

改变窗口大小后:
三、说明
注意:ngx-echarts想要图表能够随着窗口大小自适应,有两个关键点:
① 容纳图表的容器支持自适应
② 监听窗口的resize事件,当监听到变化时候,重新绘制图表