1.Hystrix服务监控Dashboard 介绍
Hystrix服务监控Dashboard仪表盘
在实际生产中,成千上万的服务,我们怎么知道提供服务的高可用情况,即服务的成功失败超时等相关情况;
Hystrix提供了,实时的服务调用监控项目Dashboard,能够实时记录通过Hystrix发起的请求执行情况,并可以通过图表的形式展现给用户看,非常的直观
2.具体实现
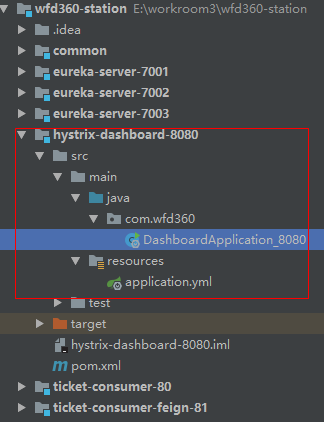
第一步:构建Dashboard监控模块,模块名称为:hystrix-dashboard-8080,端口号为:8080
pom.xml文件导入jar包如下:
    <dependencies>
        <dependency>
            <groupId>org.springframework.cloud</groupId>
            <artifactId>spring-cloud-starter-hystrix</artifactId>
        </dependency>
        <dependency>
            <groupId>org.springframework.cloud</groupId>
            <artifactId>spring-cloud-starter-hystrix-dashboard</artifactId>
        </dependency>
        <dependency>
            <groupId>org.springframework.boot</groupId>
            <artifactId>spring-boot-starter-actuator</artifactId>
        </dependency>
    </dependencies>
application.yml文件
server:
  port: 8080
  context-path: /
启动类:DashboardApplication_8080,
注意添加注解:@EnableHystrixDashboard


package com.wfd360;

import org.springframework.boot.SpringApplication;
import org.springframework.boot.autoconfigure.SpringBootApplication;
import org.springframework.boot.autoconfigure.jdbc.DataSourceAutoConfiguration;
import org.springframework.boot.autoconfigure.orm.jpa.HibernateJpaAutoConfiguration;
import org.springframework.cloud.netflix.hystrix.dashboard.EnableHystrixDashboard;

/**
 * @author 姿势帝-博客园
 * @address https://www.cnblogs.com/newAndHui/
 * @WeChat 851298348
 * @create 07/19 5:12
 * @description
 */
@SpringBootApplication(exclude={DataSourceAutoConfiguration.class, HibernateJpaAutoConfiguration.class})
@EnableHystrixDashboard
public class DashboardApplication_8080 {
    public static void main(String[] args) {
        SpringApplication.run(DashboardApplication_8080.class, args);
    }
}
启动项目: hystrix-dashboard-8080
访问:http://localhost:8080/hystrix.stream
界面如下:
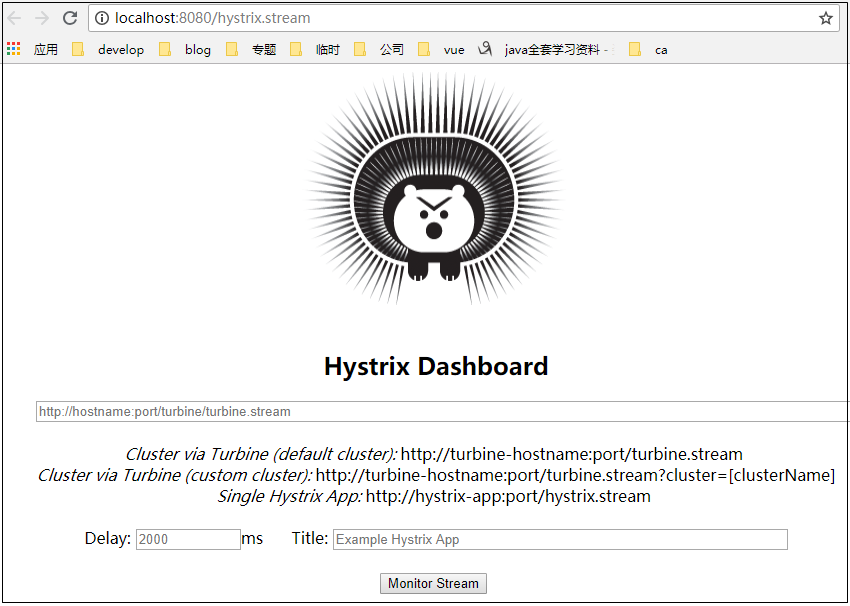
部署成功!
第二步:启动项目 ticket-lock-provider-6004
这里注意,需要保证 ticket-lock-provider-6004 为 hystrix项目
即:
1.application.yml上配置超时时间
2.启动类上添加注解 @EnableCircuitBreaker
3.控制层方法上有服务熔断降级处理
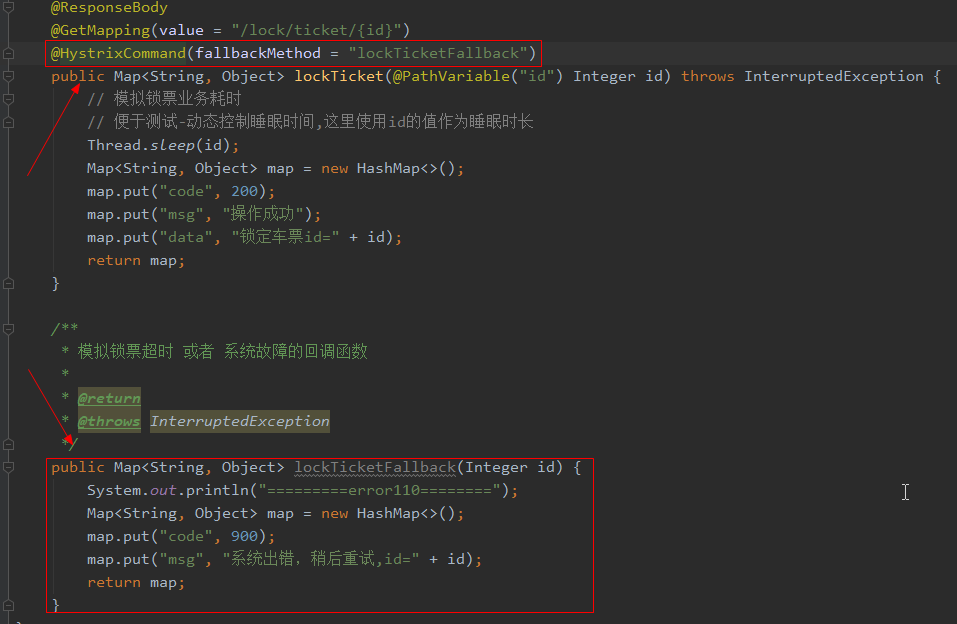
其实就是上一节中注释的代码全部打开
验证服务提供者配置是否成功
访问:http://localhost:6004/lock/ticket/10 ,看能否正常获取数据或服务熔断
访问:http://localhost:6004/hystrix.stream ,看能否不断ping 出如下数据
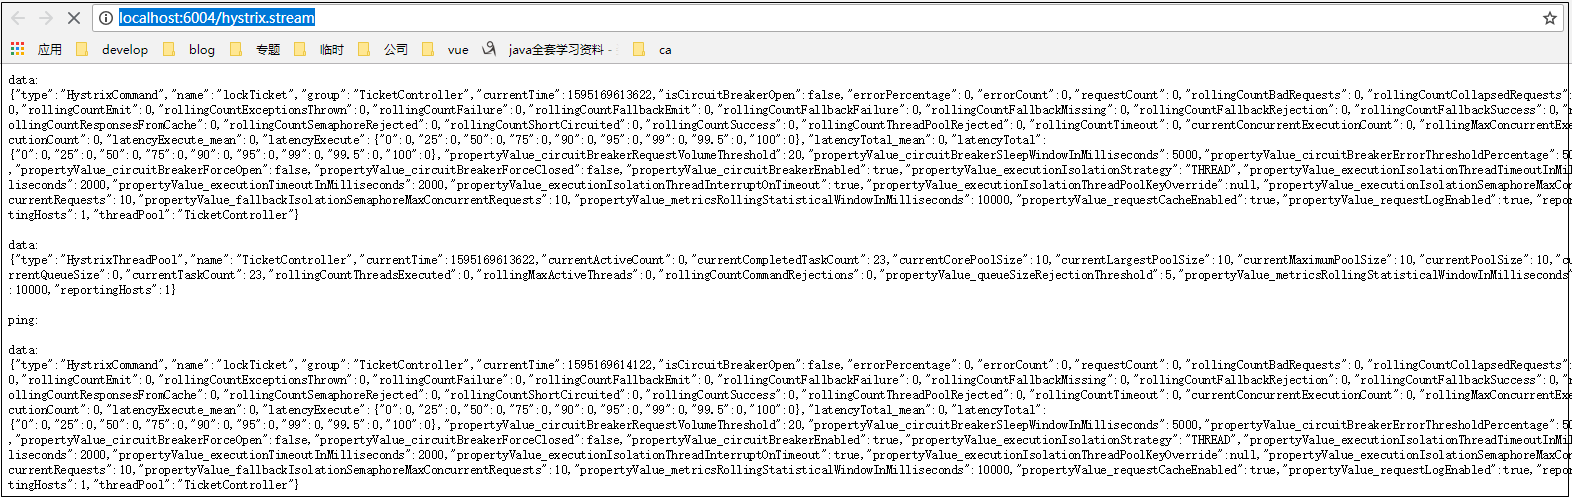
这些数据我们看起来很困难,但是只要借助Dashboard项目,看起来就是仪表盘了
第三步:将连接 http://localhost:6004/hystrix.stream 放入dashboard的中进行检测 http://localhost:8080/hystrix.stream
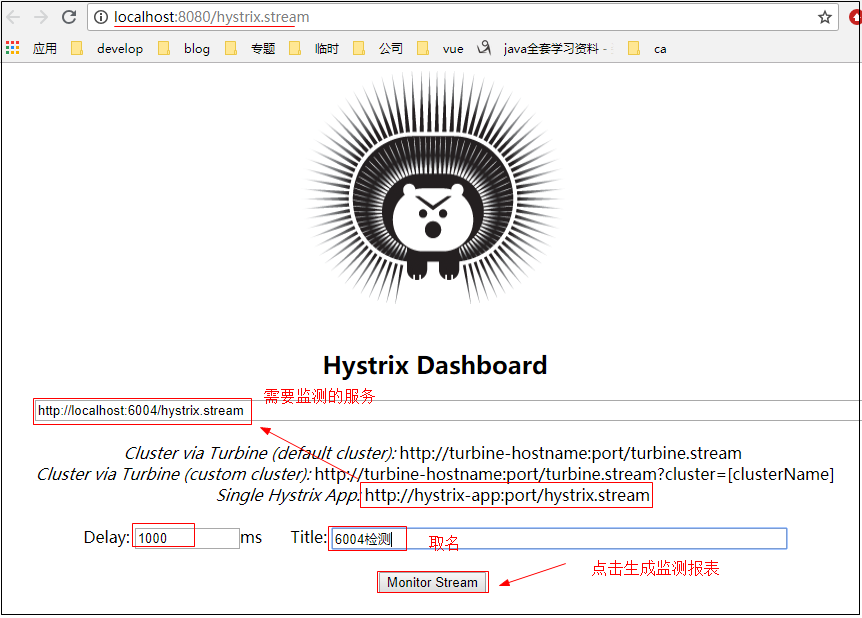
生产监测报表如下:

测试时,你可以不断的访问6004服务,观察报表的变化情况!
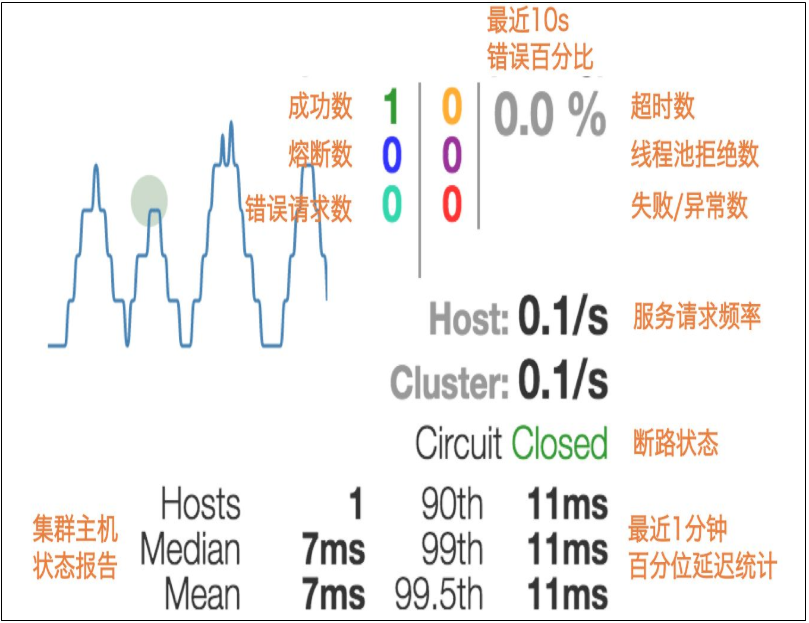
简要说一下图的含义
下面灰色的圆圈代表是健康情况,如果红色代表不健康,形状越大流量越大
凸起来的灰色线,代表的是访问的流量的变化情况
第一列 针对的是request
第一个绿色的数字,代表成功访问请求的数量,对应横向的绿色Success。
第二个蓝色的数字,代表Short-Circuited
第三个青色的数字,代表错误请求的数量
第二列 针对的是response
第一个橙色的数字,代表超时访问的数量
第二个紫色的数字,代表拒绝访问的数量
第三个红色的数字,代表失败的服务数量
第三列 针对的是request/response 错误比例 或者成功比例
最重要的一个指标是参考 Circuit 代表熔断器的状态 close的关闭,open是打开
图标中个数据的含义:
完美!
springCloud课程与代码下载:https://www.cnblogs.com/newAndHui/p/13210228.html