原文地址
由于项目需要,最近在找关于绘制实时曲线图的文章,但看了很多自己实现的话太慢,所以使用了第三方控件来实现(由于是项目中使用所以我比较倾向与开源的项目,如果出问题的话可以很好的找到根源)。这里记录是让我以后可以回顾,也可以让志同道合的程序猿减少搜索时间。
下面我们就介绍一下DynamicDataDisplay中实时曲线图的功能(其他没有时间去研究),由于在网上能找到类似的配置文章。
首先我们要去官网下载dll(或者直接NuGet,这里没有用过就不介绍了),DynamicDataDisplay找到需要的DynamicDataDisplay.dll并在项目中引用
然后在项目中配置命名空间 xmlns:d3="http://research.microsoft.com/DynamicDataDisplay/1.0",再在内容中添加<d3:ChartPlotter>基本配置问题就已经解决。
CPU的使用率的实时显示问题,CPU所使用的api可以自己去查找,我这里就不说明了。
下面我们来直接贴代码
MainWindow.xaml文件内容如下:
- <Window xmlns:dxga="http://schemas.devexpress.com/winfx/2008/xaml/gauges"
- xmlns="http://schemas.microsoft.com/winfx/2006/xaml/presentation"
- xmlns:x="http://schemas.microsoft.com/winfx/2006/xaml"
- x:Class="LinechartApplication.MainWindow"
- Title="MainWindow" Height="400" Width="650"
- xmlns:d3="http://research.microsoft.com/DynamicDataDisplay/1.0" Loaded="Window_Loaded">
- <Grid>
- <Grid.RowDefinitions>
- <RowDefinition Height="Auto"/>
- <RowDefinition Height="*"/>
- </Grid.RowDefinitions>
- <StackPanel Orientation="Horizontal">
- <Button Content="滚屏or不滚屏" Click="Button_Click"/>
- </StackPanel>
- <d3:ChartPlotter x:Name="plotter" Margin="10,10,20,10" Grid.Row="1">
- <d3:ChartPlotter.VerticalAxis>
- <d3:VerticalIntegerAxis />
- </d3:ChartPlotter.VerticalAxis>
-
- <d3:ChartPlotter.HorizontalAxis>
- <d3:HorizontalIntegerAxis />
- </d3:ChartPlotter.HorizontalAxis>
-
- <d3:Header Content="CPU 实时性能"/>
- <d3:VerticalAxisTitle Content="百分比"/>
- </d3:ChartPlotter>
- </Grid>
- </Window>
- using System;
- using System.Globalization;
- using System.IO;
- using System.Reflection;
- using System.Threading;
- using System.Windows;
- using System.Diagnostics;
- using System.Windows.Threading;
- using System.Windows.Media;
- using Microsoft.Research.DynamicDataDisplay;
- using Microsoft.Research.DynamicDataDisplay.DataSources;
- using System.Collections;
-
- namespace LinechartApplication
- {
- /// <summary>
- /// MainWindow.xaml 的交互逻辑
- /// </summary>
- public partial class MainWindow : Window
- {
-
- private ObservableDataSource<Point> dataSource = new ObservableDataSource<Point>();
- private PerformanceCounter performanceCounter = new PerformanceCounter();
- private DispatcherTimer dispatcherTimer = new DispatcherTimer();
- private int currentSecond = 0;
-
- bool buttonbool = false;//标志是否滚屏
- public MainWindow()
- {
- InitializeComponent();
-
- }
-
- private void Window_Loaded(object sender, RoutedEventArgs e)
- {
- plotter.AddLineGraph(dataSource, Colors.Red, 2, "百分比");
- plotter.LegendVisible = true;
- dispatcherTimer.Interval = TimeSpan.FromSeconds(1);
- dispatcherTimer.Tick += timer_Tick;
- dispatcherTimer.IsEnabled = true;
- plotter.Viewport.FitToView();
- }
-
- int xaxis = 0;
- int yaxis = 0;
- int group = 20;//默认组距
-
- Queue q = new Queue();
- private void timer_Tick(object sender, EventArgs e)
- {
- performanceCounter.CategoryName = "Processor";
- performanceCounter.CounterName = "% Processor Time";
- performanceCounter.InstanceName = "_Total";
- double x = currentSecond;
- double y = performanceCounter.NextValue();
- Point point = new Point(x, y);
- dataSource.AppendAsync(base.Dispatcher, point);
- if (wendu)
- {
- if (q.Count < group)
- {
- q.Enqueue((int)y);//入队
- yaxis = 0;
- foreach (int c in q)
- if (c > yaxis)
- yaxis = c;
- }
- else {
- q.Dequeue();//出队
- q.Enqueue((int)y);//入队
- yaxis = 0;
- foreach (int c in q)
- if (c > yaxis)
- yaxis = c;
- }
-
- if (currentSecond - group > 0)
- xaxis = currentSecond - group;
- else
- xaxis = 0;
-
- Debug.Write("{0}
", yaxis.ToString());
- plotter.Viewport.Visible = new System.Windows.Rect(xaxis, 0, group, yaxis);//主要注意这里一行
- }
- currentSecond++;
- }
-
- private void Button_Click(object sender, RoutedEventArgs e)
- {
- if (wendu)
- {
- wendu = false;
- }
- else {
- wendu = true;
- }
- }
- }
- }
DynamicDataDisplay实现实时显示曲线的功能有很多但没有看到x轴移动的功能所以下面就是主要内容(如何沿着x轴移动)在使用DynamicDataDisplay时候我发现会出现图像缩放的情况(就是x轴一直被缩放,所有数据都会被压缩在一块,很不方便)。使用plotter.Viewport.Visible = new System.Windows.Rect(xaxis, 0, group, yaxis);这行代码就可以解决按照x轴移动的功能。这个就像一个窗口,我们定义窗口位置和大小就能想看到我们所需要的数据。第一和第二个参数是原点坐标,第三个参数是X轴长度,第四个参数是Y长度。定义好了之后所有在这个区间的内容都会被显示,多余的参数不显示。随着窗口的移动也就是X轴移动的功能。代码中,使用了队列,队列的长度就等于显示窗口的长度也就是X轴的长度。队列的作用是取该队列中最大的值来确定窗口的高度。
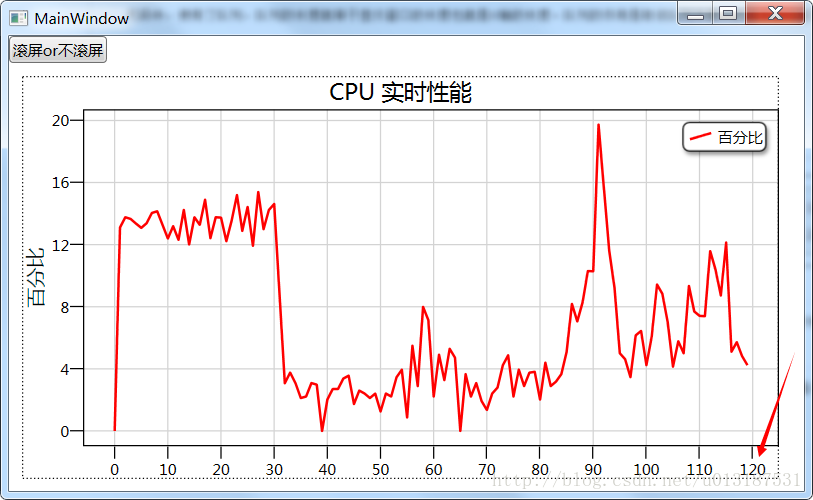
不滚屏时图像(我们可以看到X轴都挤到一块)
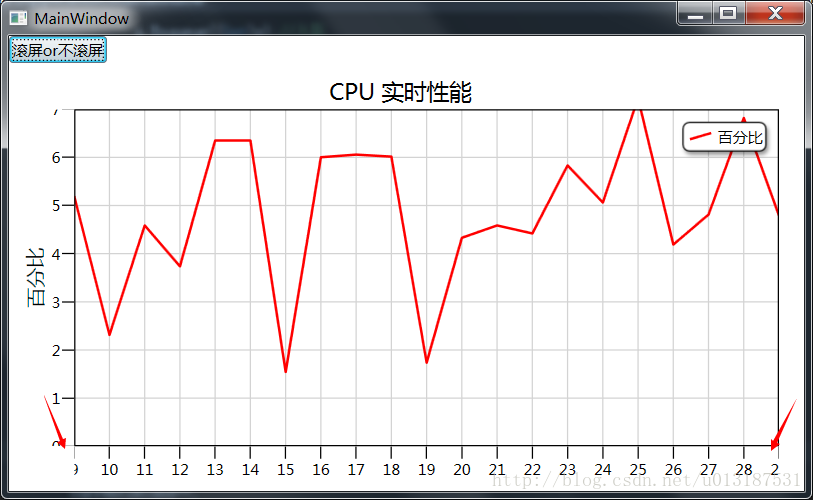
滚屏时图像(我们可以看到X起始点和结束点)
资源下载http://download.csdn.net/detail/u013187531/9842653