SpringCloud完美的整合Hystrix-dashboard,Hystrix-dashboard是一款针对Hystrix进行实时监控的工具,通过Hystrix Dashboard我们可以在直观地看到各Hystrix Command的请求响应时间, 请求成功率等数据。可以实时反馈信息帮助我们快速发现系统中,但是只使用Hystrix Dashboard的话, 你只能看到单个应用内的服务信息。
在上一个项目上重构地址
1.pom.xml(必须包)
<dependency>
<groupId>org.springframework.boot</groupId>
<artifactId>spring-boot-starter-actuator</artifactId>
</dependency>

<!--引入hystrix熔断器 -->
<dependency>
<groupId>org.springframework.cloud</groupId>
<artifactId>spring-cloud-starter-hystrix</artifactId>
</dependency>
<!--引入hystrix dashboard(仪表盘)-->
<dependency>
<groupId>org.springframework.cloud</groupId>
<artifactId>spring-cloud-starter-hystrix-dashboard</artifactId>
</dependency>
2.启动类
package com.niugang;
import org.springframework.boot.SpringApplication;
import org.springframework.boot.autoconfigure.SpringBootApplication;
import org.springframework.cloud.client.circuitbreaker.EnableCircuitBreaker;
import org.springframework.cloud.client.discovery.EnableDiscoveryClient;
import org.springframework.cloud.client.loadbalancer.LoadBalanced;
import org.springframework.cloud.netflix.hystrix.dashboard.EnableHystrixDashboard;
import org.springframework.context.annotation.Bean;
import org.springframework.context.annotation.ComponentScan;
import org.springframework.web.client.RestTemplate;

/**
 * 负责服务的发现与消费
 *
 * @author niugang
 *
 */
@SpringBootApplication
@EnableDiscoveryClient
@EnableCircuitBreaker
@EnableHystrixDashboard //启动仪表盘

/*
 * @SpringCloudApplication
 * 包含了
 * @SpringBootApplication
 * @EnableDiscoveryClient
 * @EnableCircuitBreaker
 * 着三个注解
 */
@ComponentScan
public class Application {
    //负载均衡
@LoadBalanced
@Bean
public RestTemplate restTemplate() {
return new RestTemplate();
}

public static void main(String[] args) {

SpringApplication.run(Application.class, args);
}
}

3.访问
启动工程后访问 http://localhost:9002/hystrix,看到如下
![]()

上面截图是HystrixBoard的监控首页,该页面并没有什么监控信息。从1,2,3标号中可以知道HystrixBoard提供了三种不同的监控方式。
标号1:默认的集群方式:通过URL http://turbine-hostname:port/turbine.stream开启,实现对默认集群的监控。
标号2:指定的集群监控,通过URL http://turbine-hostname:port/turbine.stream?cluster=[clusterName]开启对clusterName的集群监控。
标号3:单体应用的监控,通过URL http://hystrix-app:port/hystrix.stream开启,实现对具体某个服务实例的监控。
标号4:Delay:改参数用来控制服务器上轮训监控信息的延迟时间,默认为2000毫秒,可以通过配置该属性来降低客户端的网络和CPU消耗。
标号5:Title:该参数对应了上图头补标题Hystrix Stream之后的内容,默认会使用具体监控实例的URL,可以通过该信息来展示更合适的标题。
点击Monitor Stream ,如果没有请求会先显示Loading ...,刷新几次http://localhost:9002/queryUser/5,仪表板监控如下:
![]()

访问http://localhost:9002/hystrix.stream 也会不断的显示ping(浏览器一直在刷新):
![]()

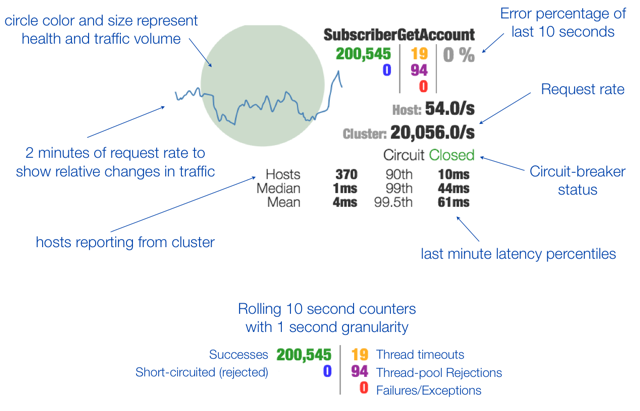
Hystrix Dashboard Wiki上详细说明了图上每个指标的含义,如下图:
![]()
![]()

左上部实心圆和一条曲线含义:
实心圆:通过颜色的变化代表了实例的健康程度,它的大小也会根据实例的请求流量发生变化,流量越来实心圆越大。
曲线:用来记录2分钟内流量的相对变化,可通过它来观察流量的上升和下降趋势。
微信公众号

![]()