kibana只需要在一台机器安装即可
1):解压
tar -zxvf kibana-5.5.2-linux-x86_64.tar.gz -C /home/angel/servers/
2):修改kibana中的config/ kibana.yml 文件
Vim /home/angel/servers/kibana-5.5.2-linux-x86_64/config/kibana.yml
server.host: "hadoop01"
server.port: 5601
elasticsearch.url: "http://hadoop01:9200"
kibana.index: ".kibana"
3):安装x-pack
bin/kibana-plugin install file:///home/angel/software/x-pack-5.5.2.zip

4):启动kibana
/home/angel/servers/kibana-5.5.2-linux-x86_64/bin/kibana
5):在elsticsearch上也安装x-pack
bin/elasticsearch-plugin install file:///home/angel/software/x-pack-5.5.2.zip
6):在elasticsearch的配置文件中添加配置:
xpack.security.enabled : false
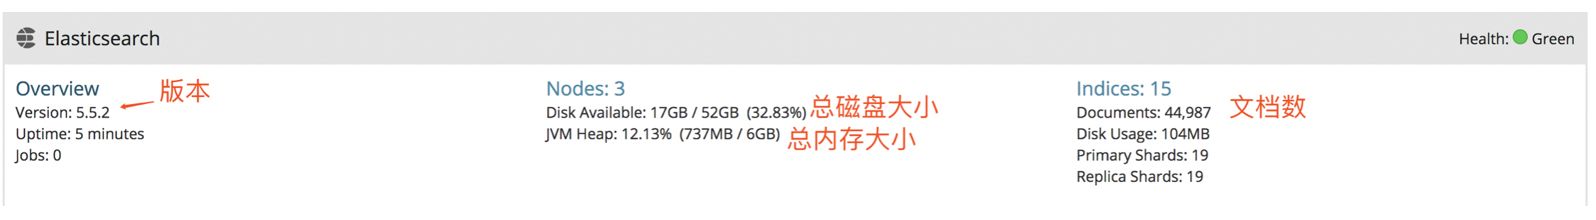
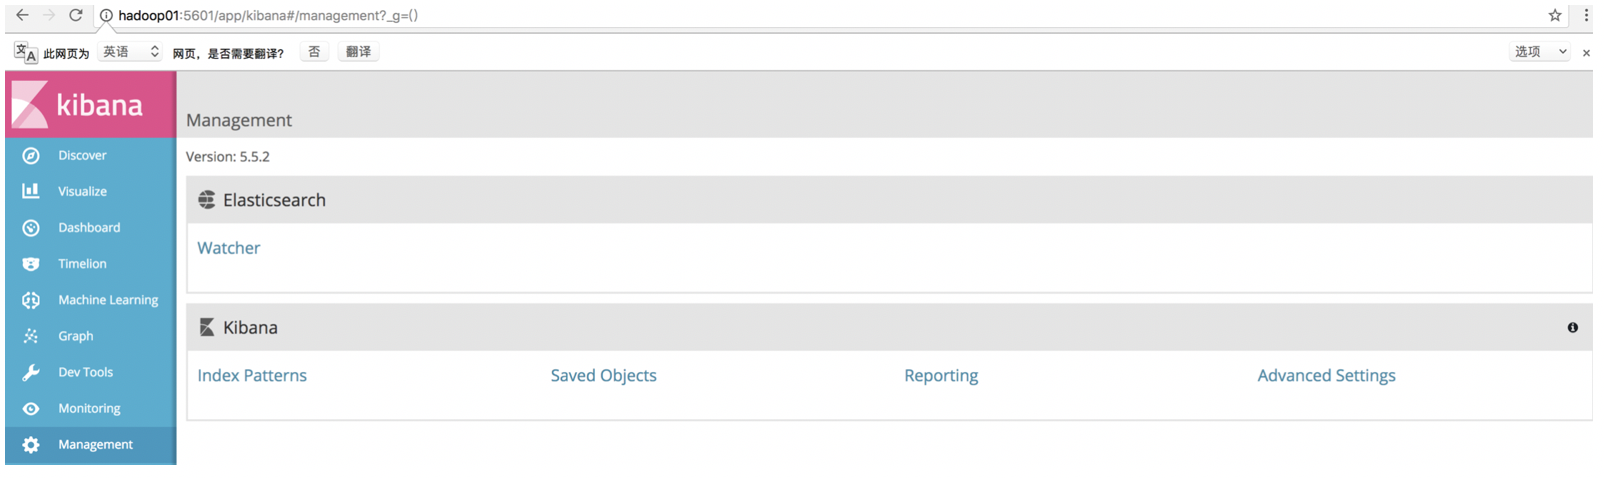
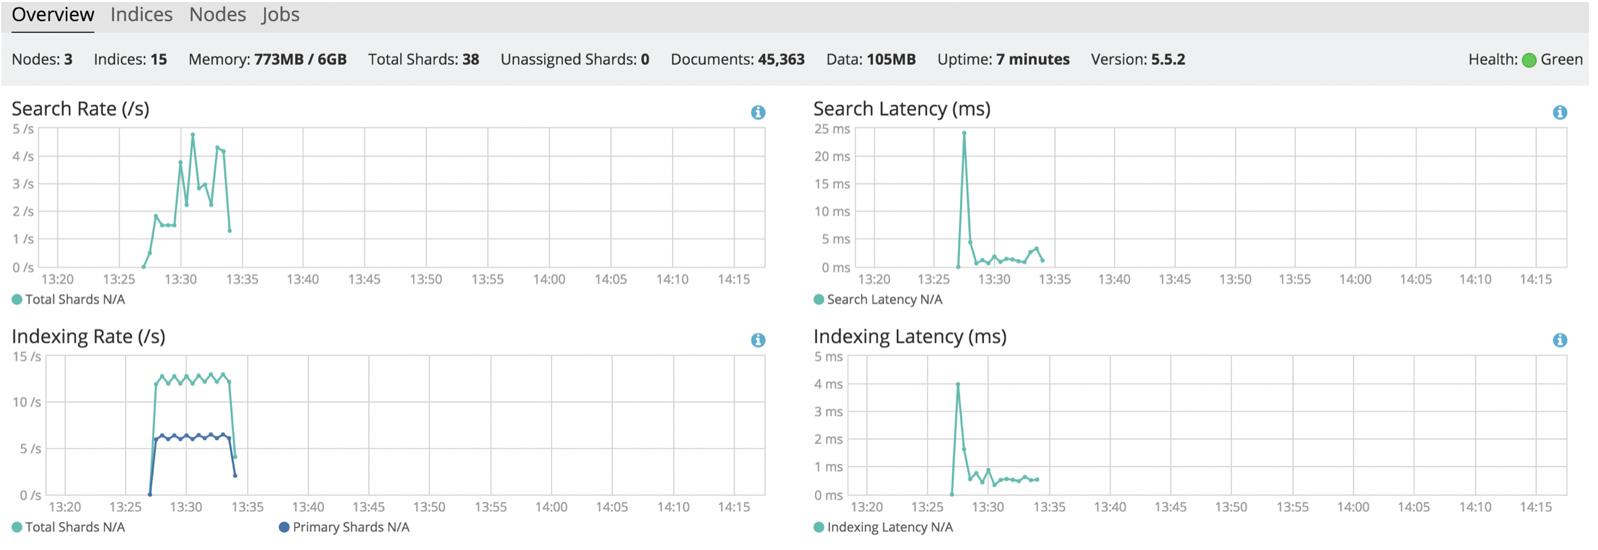
点击Overview,可以查看elasticsearch的正常搜索效率和索引率
点击nodes,可以查看当前es的Memory和CPU使用率

查看kibana单的运行信息
查看客户请求和对客户响应时间

查看kibana所在机器当前系统负载情况:
