随机漫步
# random_walk.py 随机漫步

from random import choice

class RandomWalk():
    """一个生成随机漫步数据的类"""

    def __init__(self, num_points=5000):
        """初始化随机漫步的属性"""

        self.num_points = num_points

        # 所有随机漫步都始于(0, 0)
        self.x_values = [0]
        self.y_values = [0]

    def fill_walk(self):
        """计算随机漫步包含的所有点"""

        # 不断漫步,知道列表达到指定的长度
        while len(self.x_values) < self.num_points:

            # 决定前进方向以及沿这个方向前进的距离
            x_direction = choice([1, -1])
            x_distance = choice([0, 1, 2, 3, 4])
            x_step = x_direction * x_distance

            y_direction = choice([1, -1])
            y_distance = choice([0, 1, 2, 3, 4])
            y_step = y_direction * y_distance

            # 拒绝原地踏步
            if x_step == 0 and y_step == 0:
                continue

            # 计算下一个点的x和y值
            next_x = self.x_values[-1] + x_step
            next_y = self.y_values[-1] + y_step

            self.x_values.append(next_x)
            self.y_values.append(next_y)
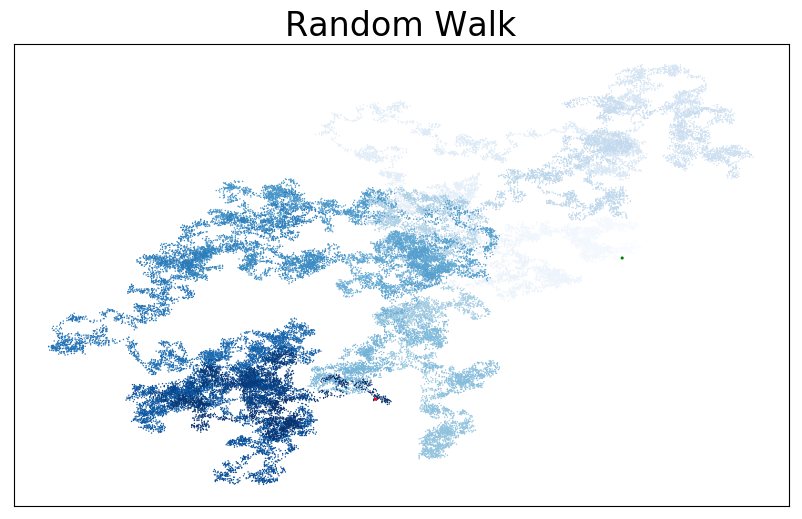
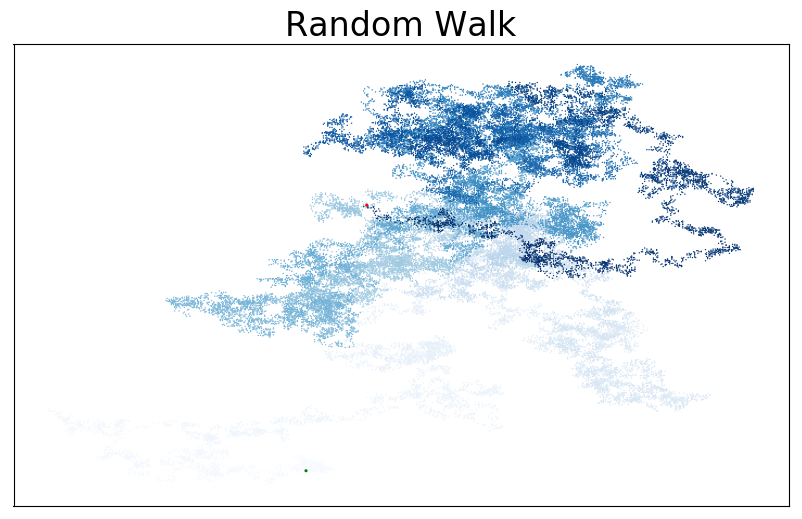
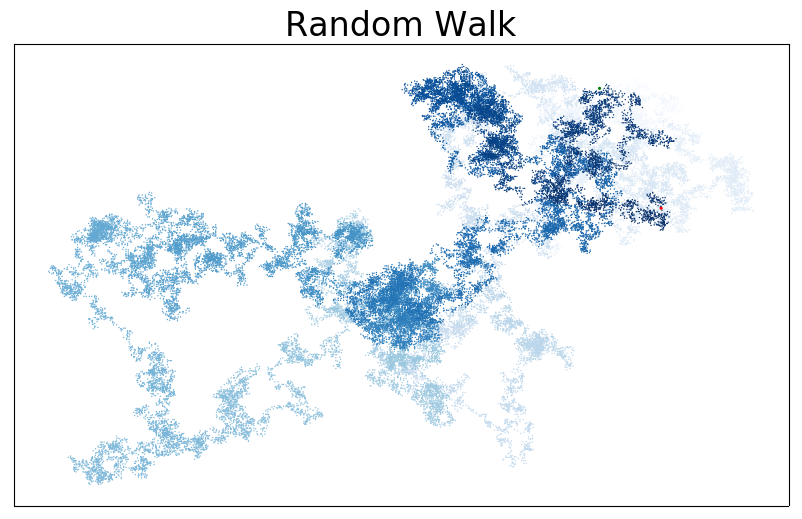
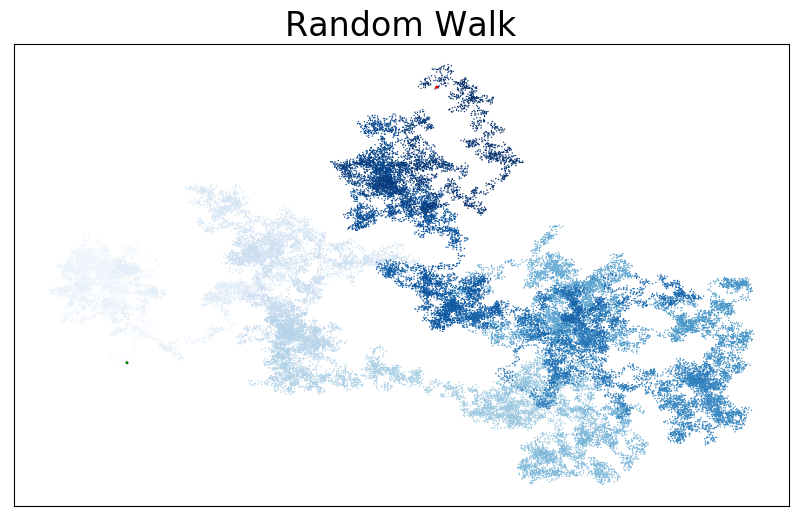
# rw_visual.py 随机漫步实现
import matplotlib.pyplot as plt
import random

from random_walk import RandomWalk

# 只要程序处于活动状态,就不断地模拟随机漫步
while True:
    # 创建一个RandomWalk实例,并将其包含的点都绘制出来
    rw = RandomWalk(50000)
    rw.fill_walk()

    # 设置绘图窗口的尺寸
    plt.figure(figsize=(10, 6))

    # 映射
    point_numbers = list(range(rw.num_points))
    plt.scatter(rw.x_values, rw.y_values, edgecolors='none', s=1, c=point_numbers, cmap=plt.cm.Blues)

    # 突出起点和终点
    plt.scatter(0, 0, c='green', edgecolors='none', s=5)
    plt.scatter(rw.x_values[-1], rw.y_values[-1], c='red', edgecolors='none', s=5)

    # 设置坐标轴的标签以及标题
    plt.xlabel('Axis X', fontsize=14)
    plt.ylabel('Axis Y', fontsize=14)
    plt.title('Random Walk', fontsize=24)

    # 隐藏坐标轴
    plt.axes().get_xaxis().set_visible(False)
    plt.axes().get_yaxis().set_visible(False)

    # 显示
    #plt.show()

    # 保存图表
    filename = 'rw_' + str(random.randint(000000, 999999)) + '.png'
    plt.savefig('images/' + filename, bbox_inches='tight')

    # 不可既使用show显示,又使用svaefig保存,否则保存图像为空

    # 询问是否继续
    flag = input('Make another walk? (y/n):')
    if flag.lower() not in ['y', 'yes']:
        break