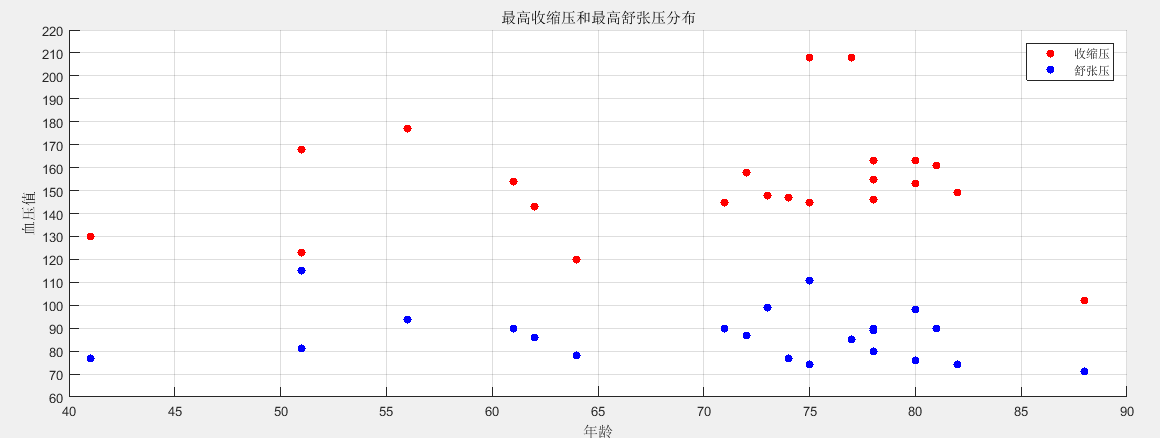
有时候需要在matlab scatter绘图中显示不同颜色区分,如下图是人体血压高压、低压与年龄关系的散点图。
红色点表示高压
绿色点表示低压
用 matlab 如何实现呢?
1.创建一维矩阵x,y1,y2 分别表示年龄、高压和低压
x=[75;78;51;82;77;88;41;78;78;61;71;74;62;81;75;64;80;72;51;80;56;73]

y1=[208;146;168;149;208;102;130;155;163;154;145;147;143;161;145;120;153;158;123;163;177;148]

y2=[111;80;115;74;85;71;77;89;90;90;90;77;86;90;74;78;98;87;81;76;94;99]
2.调用scatter方法
%绘制高压散点图,红色填充
>> scatter(x,y1,'r','field')

%保有已绘制图形
>> hold on

%绘制低压散点图,绿色填充
>> scatter(x,y2,'b','field')
或者使用半角逗号连接多个方法
>> scatter(x,y1,'r','field'),scatter(x,y2,'b','field')
3.scatter用法:
scatter(x,y)
scatter(x,y,sz)
scatter(x,y,sz,c)
scatter(x,y,sz,c,type)
x: x轴坐标数据
y: y轴坐标数据
sz: 图中标记大小,默认大小为36
c: 标记颜色
| 长名称 | 短名称 | RGB 三元数 |
|---|---|---|
'yellow' |
'y' |
[1 1 0] |
'magenta' |
'm' |
[1 0 1] |
'cyan' |
'c' |
[0 1 1] |
'red' |
'r' |
[1 0 0] |
'green' |
'g' |
[0 1 0] |
'blue' |
'b' |
[0 0 1] |
'white' |
'w' |
[1 1 1] |
'black' |
'k' |
[0 0 0] |
type: 标记形状
| 值 | 说明 |
|---|---|
'o' |
圆圈 |
'+' |
加号 |
'*' |
星号 |
'.' |
点 |
'x' |
叉号 |
'square' 或 's' |
方形 |
'diamond' 或 'd' |
菱形 |
'^' |
上三角 |
'v' |
下三角 |
'>' |
右三角 |
'<' |
左三角 |
'pentagram' 或 'p' |
五角星(五角形) |
'hexagram' 或 'h' |
六角星(六角形) |
'none' |
无标记 |