1.工具安装
yum -y install httpd-tools
ab -n 10000 -c 500 -r http://www.XXXXX.com.cn/
-n 一共创建多少个请求
-c 每一次并发数
-r 忽略一些错误
指标说明:
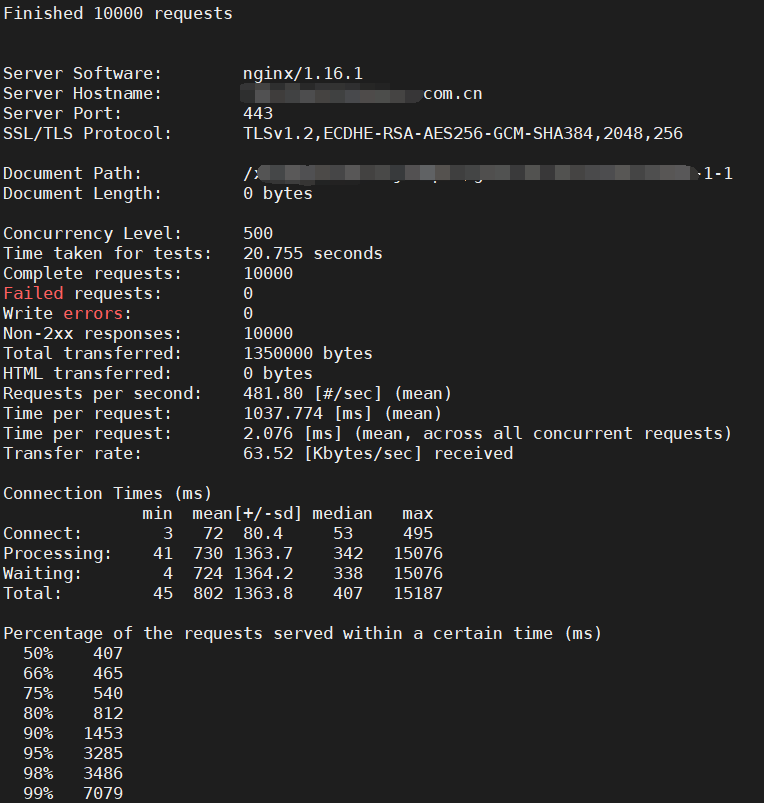
Server Software: nginx/1.16.1
Server Hostname: XXXXXXcom.cn
Server Port: 443
SSL/TLS Protocol: TLSv1.2,ECDHE-RSA-AES256-GCM-SHA384,2048,256
Document Path: /xiaokang/api/TjSample/getList?startDate=2020-1-1
Document Length: 0 bytes HTTP相应数据大小
Concurrency Level: 500 并发数
Time taken for tests: 20.755 seconds 完成所有请求所需时间
Complete requests: 10000 总请求数
Failed requests: 0 请求失败数量
Write errors: 0 网络连接写入失败数量
Non-2xx responses: 10000
Total transferred: 1350000 bytes 网络总传输大小
HTML transferred: 0 bytes 传输总大小
Requests per second: 481.80 [#/sec] (mean) 吞吐量,每秒请求数
Time per request: 1037.774 [ms] (mean) 服务器收到请求,响应页面花费时间
Time per request: 2.076 [ms] (mean, across all concurrent requests) 并发的每个请求平均消耗时间
Transfer rate: 63.52 [Kbytes/sec] received 平均每秒网络上的流量,可以帮助排除是否存在网络流量过大导致响应时间延长的问题
网络上消耗的时间的分解:
Connection Times (ms)
min mean[+/-sd] median max
Connect: 3 72 80.4 53 495
Processing: 41 730 1363.7 342 15076
Waiting: 4 724 1364.2 338 15076
Total: 45 802 1363.8 407 15187
Percentage of the requests served within a certain time (ms)
50% 407
66% 465
75% 540
80% 812
90% 1453
95% 3285
98% 3486
99% 7079
100% 15187 (longest request)
整个场景中所有请求的响应情况。在场景中每个请求都有一个响应时间
其中 50% 的用户响应时间小于 407毫秒
80 % 的用户响应时间小于 812毫秒
最大的响应时间小于 15187毫秒