摘要: 以下基于上篇Hadoop2.6与HBase1.0集群架构: http://lizhenliang.blog.51cto.com/7876557/1665130 http://lizhenliang.blog.51cto.com/7876557/1661354 Hadoop集群基本部署完成,接下来就需要有一个监控系统,能及时发现性能瓶颈,给故障排除提供有力依据。
以下环境搭建基于Hadoop2.6与HBase1.0集群架构
Hadoop集群基本部署完成,接下来就需要有一个监控系统,能及时发现性能瓶颈,给故障排除提供有力依据。监控hadoop集群系统好用的比较少,自身感觉ambari比较好用,但不能监控已有的集群环境,挺悲催的。ganglia在网上看到原生支持Hadoop、Hbase性能监控,试用一段时间感觉还不错,监控项比较全面,配置简单,软件包在epel网络源中,使用yum安装方便快捷。
Ganglia是一个开源集群监控系统,主要用来监控系统性能,如:cpu、mem、硬盘利用率、I/O负载、网络流量等。
Ganglia涉及到三个组件:
gmetad:定期从gmond获取数据,并将数据存储到RRD存储引擎中。
gmond:被监控端代理程序,用于收集监控信息,并发送给gmetad。
ganglia-web:WEB前端,RRD绘图后通过PHP展示。
Ganglia集群监控系统部署:
1.CentOS7 YUM源自带epel网络源,直接安装(部署到Master上,尽量单独放一台机器上)
1 yum install epel-release
2 yum install ganglia-web ganglia-gmetad ganglia-gmond
2.配置监控端(在HMaster0上配置)
2.1 配置监控程序
1 vi /etc/ganglia/gmetad.conf   #修改以下两项
2 data_source "Hadoop" 192.168.18.215 192.168.18.216 192.168.18.217 192.168.18.218192.168.18.219
3 case_sensitive_hostnames 1
参数说明:
第一个是数据源,Hadoop是集群名字,后跟IP是集群中被监控节点地址。
第二个意思是是否区分主机名大小写,默认是0,修改为1,否则节点中主机名有大写的将保存为小写,写到/var/lib/ganglia/rrds/Hadoop中,导致图形无数据。
2.2 关联Apache,因为Ganglia自创建的配置ganglia.conf有问题,所以先删除,再创建个软连接到Apache根目录下。
1 rm /etc/httpd/conf.d/ganglia.conf
2 ln -s /usr/share/ganglia /var/www/html/ganglia
2.3 启动Apache和Ganglia,并设置开机启动
1 service httpd start
2 service gmetad start
3 chkconfig httpd on
4 chkconfig gmetad on
3. 安装与配置被监控端(每台同样配置)
3.1 安装与配置代理程序
 1 yum install ganglia-gmond
 2 vi /etc/ganglia/gmond.conf
 3  ……
 4  cluster{
 5    name = "Hadoop"              #集群名,和上面那个一样
 6    owner = "unspecified"
 7    latlong = "unspecified"
 8    url = "unspecified"
 9  }
10
11  /* Thehost section describes attributes of the host, like the location */
12  host {
13    location = "unspecified"
14  }
15
16  /*Feel free to specify as many udp_send_channels as you like.  Gmond
17     used to only support having a single channel*/
18  udp_send_channel{
19    #bind_hostname = yes # Highly recommended,soon to be default.
20                        # This option tells gmond to use asource  address
21                         # that resolves to themachine's hostname.  Without
22                         # this, the metrics mayappear to come from any
23                         # interface and the DNSnames associated with
24                         # those IPs will be usedto create the RRDs.
25    #mcast_join = 239.2.11.71   #关闭多播
26    host = 192.168.18.215     #添加发送IP/主机名
27    port = 8649          #默认端口
28    ttl = 1
29  }
30
31  /* Youcan specify as many udp_recv_channels as you like as well. */
32  udp_recv_channel{
33    #mcast_join = 239.2.11.71
34    port = 8649
35    bind = 192.168.18.215      #接收地址
36    retry_bind = true
37    # Size of the UDP buffer. If you are handlinglots of metrics you really
38    # should bump it up to e.g. 10MB or evenhigher.
39    # buffer = 10485760
40  }
41  ……
3.2 将修改好的gmond.conf配置scp到其他节点
1 scp /etc/ganglia/gmond.conf root@HMaster1:/etc/ganglia/gmond.conf #分别拷贝HSlave0、1、2
3.3 启动代理程序,并设置开机启动
1 service gmond start
2 chkconfig gmond on
4.添加Hadoop被Ganglia监控,去掉文件中以***释并修改(每台同样配置)
 1 vi /opt/hadoop-2.6.0/etc/hadoop/hadoop-metrics2.properties
 2 *.sink.ganglia.class=org.apache.hadoop.metrics2.sink.ganglia.GangliaSink31
 3 *.sink.ganglia.period=10
 4 *.sink.ganglia.supportsparse=true
 5 *.sink.ganglia.slope=jvm.metrics.gcCount=zero,jvm.metrics.memHeapUsedM=both
 6 *.sink.ganglia.dmax=jvm.metrics.threadsBlocked=70,jvm.metrics.memHeapUsedM=40
 7 namenode.sink.ganglia.servers=192.168.18.215:8649    #当有多个ganglia监控系统时,以逗号分隔
 8 datanode.sink.ganglia.servers=192.168.18.215:8649     #都指定ganglia服务器
 9 resourcemanager.sink.ganglia.servers=192.168.18.215:8649
10 nodemanager.sink.ganglia.servers=192.168.18.215:8649
5. 添加HBase被Ganglia监控,添加如下(每台同样配置)
vi /opt/hbase-1.0.1.1/conf/hadoop-metrics2-hbase.properties
*.sink.ganglia.class=org.apache.hadoop.metrics2.sink.ganglia.GangliaSink31
*.sink.ganglia.period=10
hbase.sink.ganglia.period=10
hbase.sink.ganglia.servers=192.168.18.215:8649
6.重启Hadoop和HBase
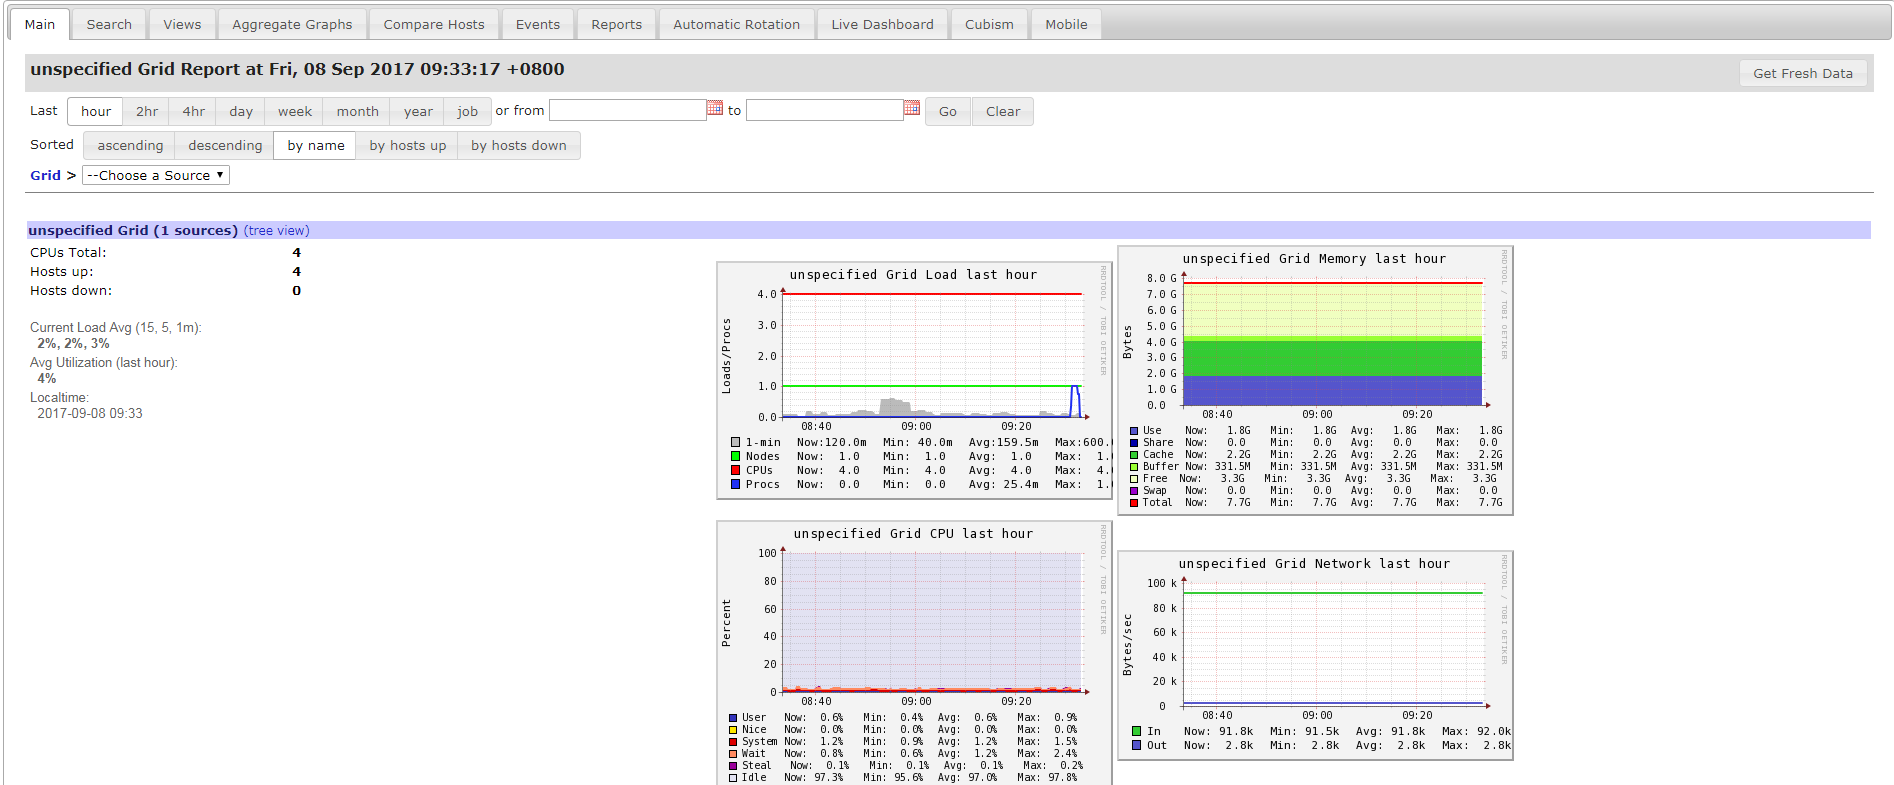
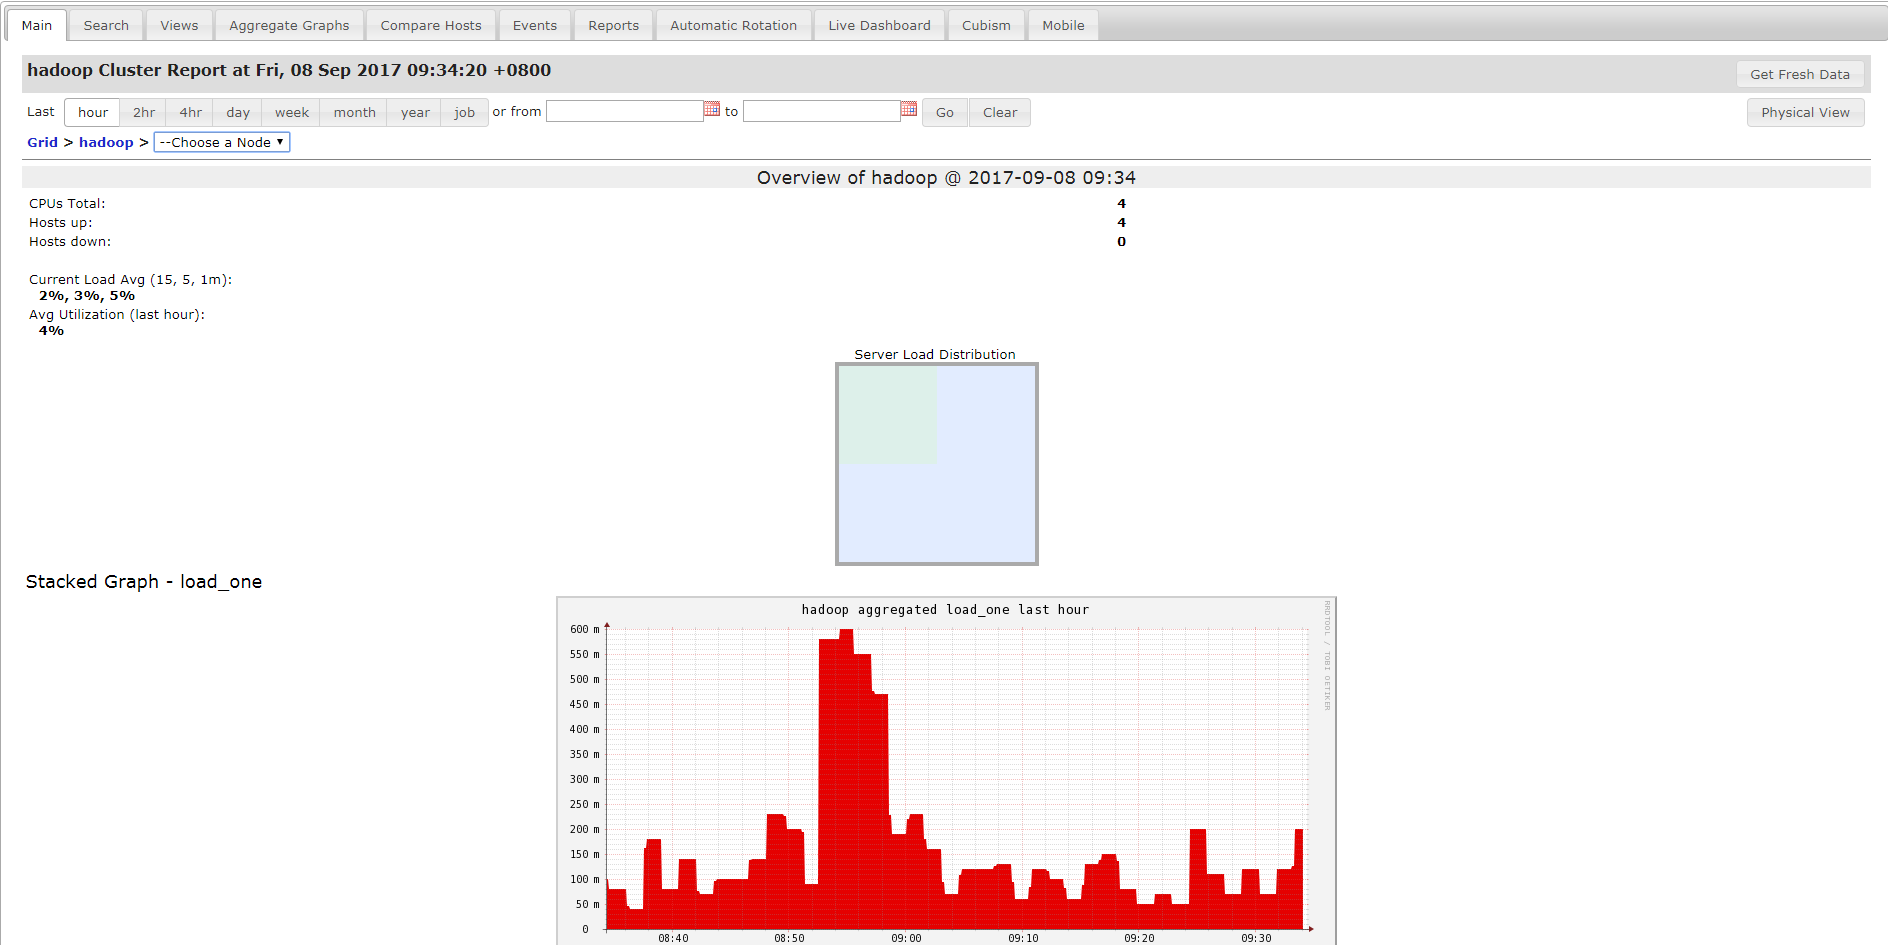
7.通过WEB查看性能监控数据
访问的网址为: http://192.168.18.215/ganglia