1、问题描述:
公司的数据平台的HiveJdbc查询一直有一个问题,就是日志获取太慢了,有时候差不多和结果一起出来的,这就非常影响用户的体验,半天都没任何输出。另一个是Beeline客户端不一致,beeline客户端每次都能很快的获取日志。
这里首先我们普及一个经验就是第一批日志获取的快慢,非常影响用户体验。如果第一批日志来的快,用户可以确认任务已经开始跑了,MR的JobId也会返回。日志的示例如下:
INFO  : Compiling command(queryId=app_20180412185224_ebd3d373-31bb-430b-9daf-44f01049a9d4): select count(*) from ods.team
INFO  : Semantic Analysis Completed
INFO  : Returning Hive schema: Schema(fieldSchemas:[FieldSchema(name:_c0, type:bigint, comment:null)], properties:null)
INFO  : Completed compiling command(queryId=app_20180412185224_ebd3d373-31bb-430b-9daf-44f01049a9d4); Time taken: 0.057 seconds
INFO  : Concurrency mode is disabled, not creating a lock manager
INFO  : Executing command(queryId=app_20180412185224_ebd3d373-31bb-430b-9daf-44f01049a9d4): select count(*) from ods.team
INFO  : Query ID = app_20180412185224_ebd3d373-31bb-430b-9daf-44f01049a9d4
INFO  : Total jobs = 1
INFO  : Launching Job 1 out of 1
INFO  : Starting task [Stage-1:MAPRED] in serial mode
INFO  : Number of reduce tasks determined at compile time: 1
INFO  : In order to change the average load for a reducer (in bytes):
INFO  :   set hive.exec.reducers.bytes.per.reducer=<number>
INFO  : In order to limit the maximum number of reducers:
INFO  :   set hive.exec.reducers.max=<number>
INFO  : In order to set a constant number of reducers:
INFO  :   set mapreduce.job.reduces=<number>
INFO  : number of splits:3
INFO  : Submitting tokens for job: job_1523499276700_0219
hive-jdbc查询后端的流程(hive-jdbc版本2.1.0):
1、启动一个线程T1,T1用于阻塞获取结果,T1还用于启动日志获取线程T2
2、T2启动获取Hive的查询日志
详细的代码请看下面这个DEMO, T1就是main线程获取hive日志的结果,T2就是LogTask获取hive的查询日志
public class HiveJdbcQueryLog {
  public static void main(String[] args) throws Exception {
      Class.forName("org.apache.hive.jdbc.HiveDriver");
      Connection connection = DriverManager.getConnection("jdbc:hive2://hive-server0:10000", "app", "");
      HiveStatement stmt = (HiveStatement) connection.createStatement();

      String sql = "select count(*) from table";

      try {
          Thread logThread = new Thread(new LogTask(stmt));
          logThread.setDaemon(true);
          logThread.start();
          boolean hasResult = stmt.execute(sql);
          logThread.interrupt();
          if (hasResult) {
              ResultSet resultSet = stmt.getResultSet();
              ResultSetMetaData metaData = resultSet.getMetaData();
              int colCount = metaData.getColumnCount();
              List<String> res = Lists.newArrayList();
              while (resultSet.next()) {
                  List<String> row = Lists.newArrayList();
                  for (int i = 1; i <= colCount; i++) {
                      row.add(resultSet.getString(i));
                  }
                  res.addAll(row);
              }
              System.out.println(JSON.toJSONString(res));
          } else {
              stmt.getUpdateCount();
          }
      } catch (Exception ex) {
          ex.printStackTrace();
      }finally {
          stmt.close();
          connection.close();
      }
  }

  public static class LogTask implements Runnable {
      private HiveStatement stmt;
      public LogTask(HiveStatement stmt) {
          this.stmt = stmt;
      }
      @Override
      public void run() {
          try {
              while (stmt.hasMoreLogs()) {
                  try {
                      for (String line : stmt.getQueryLog(true, 1000)) {
                          System.out.println(line);
                      }
                      Thread.sleep(200);
                  } catch (SQLException e) {
                      e.printStackTrace();
                  }
              }
          } catch (Exception e) {
              e.printStackTrace();
          }
      }
  }
}
几个比较奇怪的现象:
1、在数据平台执行查询任务,有时候获取hive日志也能很快,但是大部分的时候都很慢
2、当我把DEMO里面的获取日志的线程,也就是上述的T2线程(LogTask),里面的Sleep去掉时,日志能比较快的返回。但是HiveServer2上的日志会被打爆,因为不Sleep会获取几十万次,HiveServer2容易宕机。
2个怀疑的点:
1)有可能是HiveServer2堵塞,负载高或者日志文件很大,read IO需要很长时间
2)网络问题,HiveJdbc和HiveServer2之间是使用Thrift通信的,有可能网络原因,导致很慢。
2、排查过程
排查过程可以说是非常曲折,刚开始中间试过打日志,用Greys看耗时等等,但是一直没什么结果,直到最近一次排查才有突破!!
1)首先比较比较快速的是在DP服务器上用Greys查看了HiveStatement.getQueryLog方法耗时,确认第一批日志获取有快有慢的现象,有的时候是5S左右就有返回,有的时候需要15-20S左右才有返回。结果如下:
// 一次很慢的日志获取的,结果出来了,日志才出来
`---+Tracing for : thread_name="Thread-78" thread_id=0x84;is_daemon=true;priority=5;
    `---+[17331,17331ms]org.apache.hive.jdbc.HiveStatement:getQueryLog()
        +---[0,0ms]org.apache.hive.jdbc.HiveStatement:checkConnection(@858)
        +---[0,0ms]java.util.ArrayList:<init>(@864)
        +---[0,0ms]org.apache.hive.jdbc.HiveStatement:getFetchOrientation(@868)
        +---[0,0ms]org.apache.hive.service.rpc.thrift.TFetchResultsReq:<init>(@868)
        +---[0,0ms]org.apache.hive.service.rpc.thrift.TFetchResultsReq:setFetchType(@870)
        +---[17330,17330ms]org.apache.hive.service.rpc.thrift.TCLIService$Iface:FetchResults(@871)
        +---[17330,0ms]org.apache.hive.service.rpc.thrift.TFetchResultsResp:getStatus(@872)
        +---[17330,0ms]org.apache.hive.jdbc.Utils:verifySuccessWithInfo(@872)
        +---[17330,0ms]org.apache.hive.service.rpc.thrift.TFetchResultsResp:getResults(@895)
        +---[17330,0ms]org.apache.hive.jdbc.HiveConnection:getProtocol(@895)
        +---[17330,0ms]org.apache.hive.service.cli.RowSetFactory:create(@895)
        +---[17330,0ms]org.apache.hive.service.cli.RowSet:iterator(@896)


// 一次正常的日志获取,大概点击执行之后5s有了数据(5s大概是一次RPC耗时)
`---+Tracing for : thread_name="Thread-71" thread_id=0x79;is_daemon=true;priority=5;
    `---+[4557,4557ms]org.apache.hive.jdbc.HiveStatement:getQueryLog()
        +---[0,0ms]org.apache.hive.jdbc.HiveStatement:checkConnection(@858)
        +---[0,0ms]java.util.ArrayList:<init>(@864)
        +---[0,0ms]org.apache.hive.jdbc.HiveStatement:getFetchOrientation(@868)
        +---[0,0ms]org.apache.hive.service.rpc.thrift.TFetchResultsReq:<init>(@868)
        +---[0,0ms]org.apache.hive.service.rpc.thrift.TFetchResultsReq:setFetchType(@870)
        +---[4554,4554ms]org.apache.hive.service.rpc.thrift.TCLIService$Iface:FetchResults(@871)
        +---[4554,0ms]org.apache.hive.service.rpc.thrift.TFetchResultsResp:getStatus(@872)
        +---[4554,0ms]org.apache.hive.jdbc.Utils:verifySuccessWithInfo(@872)
        +---[4554,0ms]org.apache.hive.service.rpc.thrift.TFetchResultsResp:getResults(@895)
        +---[4554,0ms]org.apache.hive.jdbc.HiveConnection:getProtocol(@895)
        +---[4554,0ms]org.apache.hive.service.cli.RowSetFactory:create(@895)
        +---[4555,0ms]org.apache.hive.service.cli.RowSet:iterator(@896)
在调用hive-jdbc的client端,用Greys查询看的耗时都在TCLIService$Iface:FetchResults方法里面。看到这个信息的时候,肯定第一反应是RPC获取结果耗时在HiveServer端,要么是在网络上。这就是上面我基本怀疑的2个点。 很可惜,这2个怀疑的点最后都被证明是错的!!!!
2)然后在HiveServer端和Client端,分别开起了tcpdump监听网络事件,然后在T2线程(Hive日志获取的线程)上也打上了queryLog,开始获取log的时间,第一次收到queryLog的时间等等。开始debug!!!
不得不说tcpdump日志需要比对时间非常麻烦,下面我就直接贴出来我整理的事件时间轴:
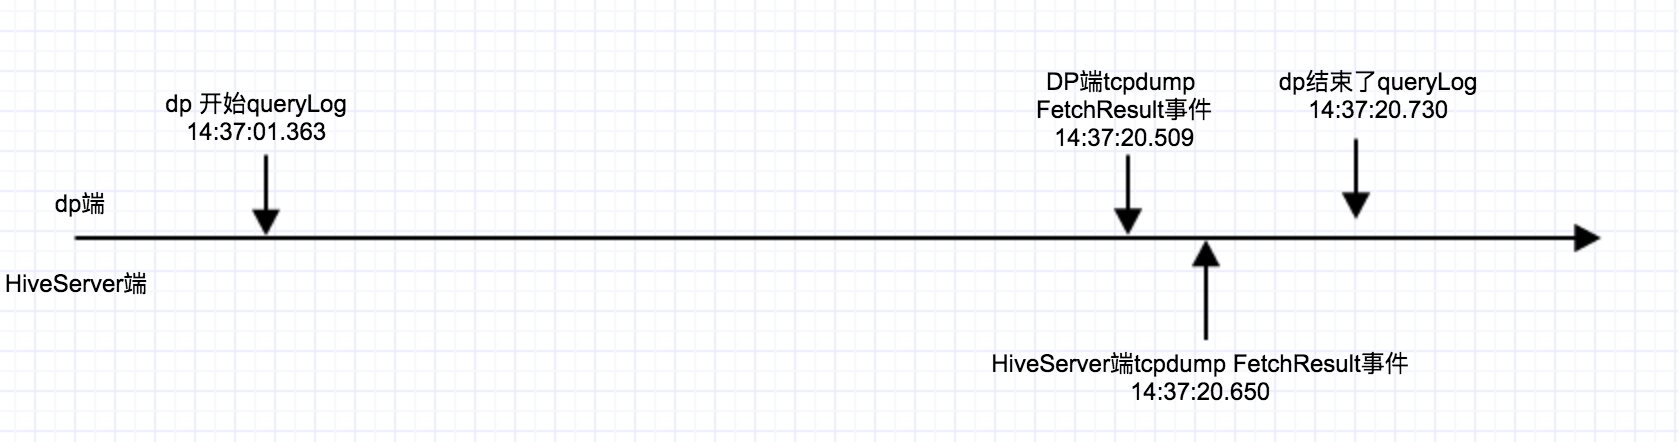
上图可以看出来,时间上HiveServer端收到FetchResults事件已经是19s之后了,更奇怪的是dp端通过tcpdump可以看到发出fetchResult事件也在19S之后了。所以基本排除了HiveServer的耗时操作的可能性,还有网络超时的可能性。
基本就可以确定了,就是Client端的hive-jdbc的问题,那么到底DP端这段时间干了什么事情,还没rpc请求就要耗时19S么????雷政富tm才12s啊!!
3、翻看hive-jdbc源码
HiveStatement和HiveConnection
// HiveStatement
public List<String> getQueryLog(boolean incremental, int fetchSize)
		throws SQLException, ClosedOrCancelledStatementException {
	List<String> logs = new ArrayList<String>();
	TFetchResultsResp tFetchResultsResp = null;
	try {
		if (stmtHandle != null) {
			TFetchResultsReq tFetchResultsReq = new TFetchResultsReq(stmtHandle,
					getFetchOrientation(incremental), fetchSize);
			tFetchResultsReq.setFetchType((short)1);
			tFetchResultsResp = client.FetchResults(tFetchResultsReq);
			Utils.verifySuccessWithInfo(tFetchResultsResp.getStatus());
		} else {
      ...........
	} catch (SQLException e) {
		throw e;
	} catch (Exception e) {
		throw new SQLException("Error when getting query log: " + e, e);
	}
  ..........
	return logs;
}
client.FetchResults方法完整的是 TCLIService.Iface.FetchResults方法,是一个Thrift接口方法。不过debug过程发现client 实际是对TCLIService.Iface的一个JDK动态代理。这样做是为了能对client对象做同步管理,代码如下:
// HiveConnection
public static TCLIService.Iface newSynchronizedClient(
      TCLIService.Iface client) {
    return (TCLIService.Iface) Proxy.newProxyInstance(
        HiveConnection.class.getClassLoader(),
      new Class [] { TCLIService.Iface.class },
      new SynchronizedHandler(client));
}
private static class SynchronizedHandler implements InvocationHandler {
  private final TCLIService.Iface client;

  SynchronizedHandler(TCLIService.Iface client) {
    this.client = client;
  }

  @Override
  public Object invoke(Object proxy, Method method, Object [] args)
      throws Throwable {
    try {
      synchronized (client) {
        return method.invoke(client, args);
      }
    } catch (InvocationTargetException e) {
      .......
    } catch (Exception e) {
      throw new TException("Error in calling method " + method.getName(), e);
    }
  }
}
看到这里忽然明白,很有可能是这19S都在这里等锁了!!!
因为在结果获取的线程T1里面也需要使用client进行RPC调用,获取状态client.GetOperationStatus(statusReq),所以这里就存在锁竞争问题啊,而且hive结果获取的线程T1调用waitForOperationToComplete方法时,获取状态client.GetOperationStatus并不Sleep (T2线程获取日志是Sleep的),所以T1(Main)线程很可能会始终占用client的锁,导致T2(LogTask)线程获取不到锁。只有当T1(Main)线程获取到了结果才释放锁,T2(LogTask)线程才能获取到锁,然后获取日志,就造成了结果出来了才能看到日志的现象
void waitForOperationToComplete() throws SQLException {
	TGetOperationStatusReq statusReq = new TGetOperationStatusReq(stmtHandle);
	TGetOperationStatusResp statusResp;
	while (!isOperationComplete) {
		try {
			statusResp = client.GetOperationStatus(statusReq);
			Utils.verifySuccessWithInfo(statusResp.getStatus());
			if (statusResp.isSetOperationState()) {
				switch (statusResp.getOperationState()) {
				case CLOSED_STATE:
				case FINISHED_STATE:
					isOperationComplete = true;
					isLogBeingGenerated = false;
					break;
					.......
			}
		} catch (SQLException e) {
			.......
		} catch (Exception e) {
			.......
		}
	}
}
4、总结
这肯定是一个bug,找了一下Hive的jira果然已经有人提出了用ReentrantLock的公平锁来做同步,Jira地址。ReentrantLock的公平锁保证了T1(Main)线程用完client之后,T2(LogTask)线程是等的时间最长的,T2(LogTask)线程能获得锁!从而保证T2(LogTask)线程获取日志不会在有结果之后才获取到!!
ReentrantLock的公平锁是一个解决方案,但是如果有些场景下查询在同一个链接上执行的SQL都是顺序的,可不可以不要加锁了呢?
答案是不可以!!!
因为thrift就是垃圾,client是线程不安全的,看这个Patch就知道了,任何想多线程操作client的,都要用同步锁或者同步代码块