Hierarchy Viewer
Hierarchy Viewer allows you to debug and optimize your user interface. It provides a visual representation of the layout's View hierarchy (the Layout View) and a magnified inspector of the display (the Pixel Perfect View).
To start Hierarchy Viewer, enter the following command from the SDK tools/ directory:
hierarchyviewer
For more information on how to use Hierarchy Viewer, see Debugging and Profiling UIs
----------------------------------------------------译---------------------------------------------------------------------
Hierarchy Viewer
Hierarchy Viewer 允许你调试和优化你的用户界面, 它提供了一种布局层次上的可视化的表示法(在。。。。)和放大的显示视图(在。。。)。
要开启Hierarchy Viewer , 从SDK工具文件路径下键入以下命令:hierarchyviewer
要得到关于怎样使用hierarchy viewer的更多的信息 , 访问调试和描述UI。
----------------------------------------------------原-------------------------------------------------------------------
Debugging and Profiling User Interfaces
Sometimes your application's layout can slow down your application. To help debug issues in your layout, the Android SDK provides the Hierarchy Viewer and layoutopt tools.
The Hierarchy Viewer application allows you to debug and optimize your user interface. It provides a visual representation of the layout's View hierarchy (the View Hierarchy window) and a magnified view of the display (the Pixel Perfect window).
layoutopt is a command-line tool that helps you optimize the layouts and layout hierarchies of your applications. You can run it against your layout files or resource directories to quickly check for inefficiencies or other types of problems that could be affecting the performance of your application.
----------------------------------------------------译---------------------------------------------------------------------
调试和描述UI
有时, 你的应用程序布局会减慢你的应用程序, 为了帮助你调试你布局里的问题, 安卓SDK提供了 Hierarchy Viewer 和layoutopt tools(。。。。布局选项工具)。
layoutopt是一个命令行工具, 能帮你优化你的布局和你的你的程序的布局层次。 你能对你的布局文件或资源文件运行它来检查无效的或其它类型的影响你程序的问题。
----------------------------------------------------原-------------------------------------------------------------------
Debugging and Optimizing User Interfaces with Hierarchy Viewer
Running Hierarchy Viewer and choosing a window
To run Hierarchy Viewer, follow these steps:
1 Connect your device or launch an emulator.
To preserve security, Hierarchy Viewer can only connect to devices running a developer version of the Android system.
2 If you have not done so already, install the application you want to work with.
3 Run the application, and ensure that its UI is visible.
4 From a terminal, launch hierarchyviewer from the <sdk>/tools/ directory.
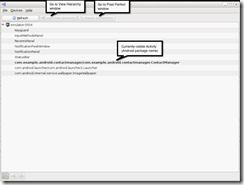
5 The first window you see displays a list of devices and emulators. To expand the list of Activity objects for a device or emulator, click the arrow on the left. This displays a list of the Activity objects whose UI is currently visible on the device or emulator. The objects are listed by their Android component name. The list includes both your application Activity and system Activity objects. A screenshot of this window appears in figure 1.
6 Select the name of your Activity from the list. You can now look at its view hierarchy using the View Hierarchy window, or look at a magnified image of the UI using the Pixel Perfect window.
To learn how to use the View Hierarchy window, go to About the View Hierarchy window. To learn how to use the Pixel Perfect window, go to About the Pixel Perfect window.
----------------------------------------------------译---------------------------------------------------------------------
用Hierarchyviewer调试和优化用户界面
运行hierarchyviewer, 下面是运行步骤:
1. 连接你的设备或登陆一个模拟器
为保证安全, hierarchyviewer只能连接到运行一个开发版本系统的设备上。
2. 如果你没有做好so(。。。这里指的是开发版本啊, 还是连接设备啊?), 安装你想调试的应用程序。
3. 运行应用程序,并且确保用户界面可见。
4. 从终端(windows就是CMD窗口),到<sdk>/tools/directory路径下登陆hierarchyviewer
5. 首先你看到的窗口是一个设备或模拟器的显示列表页面。要展开活动对象的列表页面,点击左边的箭头。这显示了一个在当前设备或是模拟器上可见的UI的活动对象的列表。活动对象以名字的形式列出。列表包括了应用程序的活动和系统程序的活动。在图一上显示了一个窗口的屏幕截图。
6. 选中列表中的活动名称。现在你就可以使用View Hierarchy来观看它的视图层次, 或者使用 Pixel Perfect 来放大用户界面的图像了。
要学习怎样使用View Hierarchy 窗口, 要“关于View Hierarchy window”页面, 要学习怎样使用Pixel Perfect, 到“关于 Pixel Perfect window”页面。
Figure 1. Hierarchy Viewer device window
图一: Hierarchy Viewer的设备窗口
----------------------------------------------------原-------------------------------------------------------------------
About the View Hierarchy window
The View Hierarchy window displays the View objects that form the UI of the Activity that is running on your device or emulator. You use it to look at individual View objects within the context of the entire View tree. For each View object, the View Hierarchy window also displays rendering performance data.
To see the View Hierarchy window, run Hierarchy Viewer as described in the section Running Hierarchy Viewer and choosing a window. Next, click View Hierarchy at the top of the device window.
----------------------------------------------------译---------------------------------------------------------------------
关于View Hierarchy窗口
View Hierarchy窗口显示了运行在你的设备或模拟器的活动的界面里的视图。你使用它来观察在一个视图树环境下 的独立的视图对象,对于每个视图对象 , View Hierarchy也都显示了一个渲染后的演示数据。
要看到View Hierarchy的窗口, 先运行Hierarchy Viewer, 就像在“运行和选择窗口”区域里描述的那样。然后, 点击窗口顶部的View Hierarchy。
----------------------------------------------------原-------------------------------------------------------------------
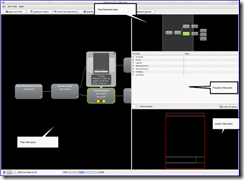
You should see four panes:
· Tree View: The left-hand pane displays the Tree View, a diagram of the Activity object's hierarchy of views. Use Tree View to examine individual View objects and see the relationships between View objects in your UI.
To zoom in on the pane, use the slider at the bottom of the pane, or use your mouse scroll wheel. To move around in the pane or reveal View objects that are not currently visible, click and drag the pane.
To highlight the nodes in the tree whose class or ID match a search string, enter the string in the Filter by class or id: edit box at the bottom of the window. The background of nodes that match the search string will change from gray to bright blue.
To save a screenshot of Tree View to a PNG file, click Save As PNG at the top of the View Hierarchy window. This displays a dialog in which you can choose a directory and file name.
To save a layered screenshot of your device or emulator to an Adobe Photoshop (PSD) file, click Capture Layers at the top of the View Hierarchy window. This displays a dialog in which you can choose a directory or file name. Each View in the UI is saved as a separate Photoshop layer.
----------------------------------------------------译---------------------------------------------------------------------
你将会看到四个窗格:
1. 树状视图: 左手边的窗格显示了树状视图, 即一个活动对象的一个视图层次的一个图表。可以使用树状视图来检查独立的视图对象和观察你UI里的视图对象之间的关系。
要缩放窗格,可以窗格下面的小滑块, 也可以使用你的鼠标滚轮。要移动窗格或者显示当前不可见的视图对象,点击拖动窗格即可。
要在树状图中高亮类名或ID匹配字符串的节点,只需在窗口底部的输入框中键入类名或ID。匹配到搜索的字符串的节点的背景色将会由灰色变成亮的蓝色。
要保存树状视图成一个PNG文件 , 点击View Hierarchy窗口顶部的save as PNG即可。点击后会显示一个对话框让你选择文件路径和文件名。
要保存一个分层的屏幕截图成一个PSD文件,点击窗口顶部的capture layers即可。这也会显示一个对话框让你填入文件名和路径。保存后每一种视图会保存为一个分享的photoshop层。
----------------------------------------------------原-------------------------------------------------------------------
In Photoshop (or similar program that accepts .psd files), you can hide, show or edit a layer independently of others. When you save a layered screenshot, you can examine and modify the image of an individual View object. This helps you experiment with design changes.
· The upper right-hand pane displays the Tree Overview, a smaller map representation of the entire Tree View window. Use Tree Overview to identify the part of the view tree that is being displayed in Tree View.
You can also use Tree Overview to move around in the Tree View pane. Click and drag the shaded rectangle over an area to reveal it in Tree View.
· The middle right-hand pane displays the Properties View, a list of the properties for a selected View object. With Properties View, you can examine all the properties without having to look at your application source.
The properties are organized by category. To find an individual property, expand a category name by clicking the arrow on its left. This reveals all the properties in that category.
----------------------------------------------------译---------------------------------------------------------------------
用photoshop(或其它支持PSD文件的软件),你可以隐藏,显示或者编辑一个独立于其它的层。当你保存为一个层次的截图时, 你可以检查或者修改独立的视图对象的图像,这会帮你检验设计的变化。
2. 上边右手的窗格显示了一个树状图的概览,即一个更小的示意图来表示窗口。使用概览图来区别出显示在树状图中的视图的各个部分。
你也可以使用概览图来移动树状图, 点击拖动矩形的区域就会在树状图中显示它。
3. 中间右手边的的窗格显示的是参数视图, 即一个被选择的视图对象的参数列表。用这个参数视图, 你可以检查所有没有出现在你程序代码中的参数。
这些参数是按类划分的。要想找到一个独立的参数,点击的左侧的箭头展开一个分类名字。这就会显示出当前种类的所有参数。
----------------------------------------------------原-------------------------------------------------------------------
· The lower right-hand pane displays the Layout View, a block representation of the UI. Layout View is another way to navigate through your UI. When you click on a View object in Tree View, its position in the UI is highlighted. Conversely, when you click in an area of Layout View, the View object for that area is highlighted in Tree View.
The outline colors of blocks in Layout View provide additional information:
o Bold red: The block represents the the View that is currently selected in Tree View.
o Light red: The block represents the parent of the block outlined in bold red.
o White: The block represents a visible View that is not a parent or child of the View that is currently selected in Tree View.
When the UI of the current Activity changes, the View Hierarchy window is not automatically updated. To update it, click Load View Hierarchy at the top of the window.
Also, the window is not updated if you switch to a new Activity. To update it, start by clicking the window selection icon in the bottom left-hand corner of the window. This navigates back to the Window Selection window. From this window, click the Android component name of the new Activity and then click Load View Hierarchy at the top of the window.
A screenshot of the View Hierarchy window appears in figure 2.
----------------------------------------------------译---------------------------------------------------------------------
4. 最后 , 在窗格右侧显示的是布局视图。 即一个黑色的UI表示区域。布局视图是另一种控制你UI的方式 。当你点击了你树状图一个视图对象时,它的UI里的位置就会被高亮。相反,当你点击布局视图的区域,该区域对应的视图对象就会在树状图中高亮。
布局视图里的轮廓颜色还提供了一些信息:
I. 粗体红色: 表示该块显示的视图在当前树状图中被选择。
II. 高亮红色: 表示该块的父节点的轮廓是粗体红色。
III.白色: 表示了一个可见的视图, 该视图不是树状图中选中视图对象的父节点也不是子节点。
当当前活动的UI发生变化后,View Hierarchy窗口不会自动更新, 要更新它, 点击窗口顶部的Load View Hierarchy。
当然, 如果你切换到一个新的活动的时候该窗口也不会更新, 要更新它,点击窗口底部左手边的选择图标开始。这会导航回到选择窗口的窗口。从这个窗口里点击安卓的组件名字和窗口顶部的 Load View Hierarchy就可以了。
View Hierarchy的截图显示在图二上。
Figure 2. The View Hierarchy window
图二。 View Hierarchy 窗口。
----------------------------------------------------总结---------------------------------------------------------------------
总结一下: 翻译了一个小时多吧, 只翻译了这么一点, 这是我第一次翻译一篇文章 , 以前都是英汉双译最多来一两句话得了。 借江西那边口音来一句: 翻译的好痛苦一个。本来有一个雄伟而模糊的期望, 把安卓开发文档全部翻译一篇, 后来上网一查,有人做这件事,叫什么农民伯伯。也在博客园里。而且是组织了几百人翻译这个。 我下载了那两个文档 , 翻译的还十分不全。 不过也很多了。 质量呢, 也还不错, 但是翻译过来的东西,即使你有审核,你质量好, 怎么怎么样,我觉得还是不行。就像这篇文章里的view,有时是视图,有时是view那个类,你说你怎么翻译。第一次看一本翻译的书,把这个类叫做视图, 我直接蒙了。 什么是视图啊?以前一直说view 了,听了个视图还不明白了。我认为如果你英语比较好,当然是看英语的了,如果你英语还一般了话,也还是直接看英文的吧,仔细看下去,还没有什么难理解的。如果你一般也不是的话,你要是不着急那还是还是看英文的吧。就当看看练习练习了, 咱不是还是有道,金山,灵格斯,必应,谷歌翻译吗?
PS: 以后可不翻译这玩意儿了。 翻译的好处就是让你更快的学习英语,更细了理解文中说的意思,但是更慢的执行效率,要明白目的是做什么: 不是学英语,而是学安卓。
----------------------------------------------------未完不译,因为我累了---------------------------------------------------------------------
Working with an individual View in Tree View
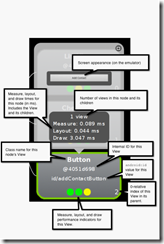
Each node in Tree View represents a single View. Some information is always visible. Starting at the top of the node, you see the following:
1 View class: The View object's class.
2 View object address: A pointer to View object.
3 View object ID: The value of the android:id attribute.
4 Performance indicators: A set of three colored dots that indicate the rendering speed of this View relative to other View objects in the tree. The three dots represent (from left to right) the measure, layout, and draw times of the rendering.
The colors indicate the following relative performance:
o Green: For this part of the render time, this View is in the faster 50% of all the View objects in the tree. For example, a green dot for the measure time means that this View has a faster measure time than 50% of the View objects in the tree.
o Yellow: For this part of the render time, this View is in the slower 50% of all the View objects in the tree. For example, a yellow dot for the layout time means that this View has a slower layout time than 50% of the View objects in the tree.
o Red: For this part of the render time, this View is the slowest one in the tree. For example, a red dot for the draw time means that this View takes the most time to draw of all the View objects in the tree.
5 View index: The zero-based index of the View in its parent View. If it is the only child, this is 0.
When you select a node, additional information for the View appears in a small window above the node. When you click one of the nodes, you see the following:
· Image: The actual image of the View, as it would appear in the emulator. If the View has children, these are also displayed.
· View count: The number of View objects represented by this node. This includes the View itself and a count of its children. For example, this value is 4 for a View that has 3 children.
· Render times: The actual measure, layout, and draw times for the View rendering, in milliseconds. These represent the same values as the performance indicators mentioned in the preceding section.
An annotated screenshot of an individual node in the Tree View window appears in figure 3.
Figure 3. An annotated node in Tree View
Debugging with View Hierarchy
The View Hierarchy window helps you debug an application by providing a static display of the UI. The display starts with your application's opening screen. As you step through your application, the display remains unchanged until you redraw it by invalidating and then requesting layout for a View.
To redraw a View in the display:
· Select a View in Tree View. As you move up towards the root of the tree (to the left in the Tree View), you see the highest-level View objects. Redrawing a high-level object usually forces the lower-level objects to redraw as well.
· Click Invalidate at the top of the window. This marks the View as invalid, and schedules it for a redraw at the next point that a layout is requested.
· Click Request Layout to request a layout. The View and its children are redrawn, as well as any other View objects that need to be redrawn.
Manually redrawing a View allows you to watch the View object tree and examine the properties of individual View objects one step at a time as you go through breakpoints in your code.
Optimizing with View Hierarchy
View Hierarchy also helps you identify slow render performance. You start by looking at the View nodes with red or yellow performance indicators to identify the slower View objects. As you step through your application, you can judge if a View is consistently slow or slow only in certain circumstances.
Remember that slow performance is not necessarily evidence of a problem, especially for ViewGroup objects. View objects that have more children and more complex View objects render more slowly.
The View Hierarchy window also helps you find performance issues. Just by looking at the performance indicators (the dots) for each View node, you can see which View objects are the slowest to measure, layout, and draw. From that, you can quickly identify the problems you should look at first.
Examining and Designing User Interfaces with Pixel Perfect
Pixel Perfect is a tool for examining pixel properties and laying out UIs from a design drawing.
About the Pixel Perfect window
The Pixel Perfect window displays a magnified image of the screen that is currently visible on the emulator or device. In it, you can examine the properties of individual pixels in the screen image. You can also use the Pixel Perfect window to help you lay out your application UI based on a bitmap design.
To see the Pixel Perfect window, run Hierarchy Viewer, as described in the section Running Hierarchy Viewer and choosing a window. Next, click Inspect Screenshot at the top of the device window. The Pixel Perfect window appears.
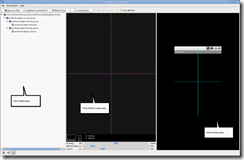
In it, you see three panes:
· View Object pane: This is a hierarchical list of the View objects that are currently visible on the device or emulator screen, including both the ones in your application and the ones generated by the system. The objects are listed by their View class. To see the class names of a View object's children, expand the View by clicking the arrow to its left. When you click a View, its position is highlighted in the Pixel Perfect pane on the right.
· Pixel Perfect Loupe pane: This is the magnified screen image. It is overlaid by a grid in which each square represents one pixel. To look at the information for a pixel, click in its square. Its color and X,Y coordinates appear at the bottom of the pane.
The magenta crosshair in the pane corresponds to the positioning crosshair in the next pane. It only moves when you move the crosshair in the next pane.
To zoom in or out on the image, use the Zoom slider at the bottom of the pane, or use your mouse's scroll wheel.
When you select a pixel in the Loupe pane, you see the following information at the bottom of the pane:
o Pixel swatch: A rectangle filled with the same color as the pixel.
o HTML color code: The hexadecimal RGB code corresponding to the pixel color
o RGB color values: A list of the (R), green (G), and blue (B) color values of the pixel color. Each value is in the range 0-255.
o X and Y coordinates: The pixel's coordinates, in device-specific pixel units. The values are 0-based, with X=0 at the left of the screen and Y=0 at the top.
· Pixel Perfect pane: This displays the currently visible screen as it would appear in the emulator.
You use the cyan crosshair to do coarse positioning. Drag the crosshair in the image, and the Loupe crosshair will move accordingly. You can also click on a point in the Pixel Perfect pane, and the crosshair will move to that point.
The image corresponding to the View object selected in the View Object pane is outlined in a box that indicates the View object's position on the screen. For the selected object, the box is bold red. Sibling and parent View objects have a light red box. View objects that are neither parents nor siblings are in white.
The layout box may have other rectangles either inside or outside it, each of which indicates part of the View. A purple or green rectangle indicates the View bounding box. A white or black box inside the layout box represents the padding, the defined distance between the View object's content and its bounding box. An outer white or black rectangle represents the margins, the distance between the View bounding box and adjacent View objects. The padding and margin boxes are white if the layout background is black, and vice versa.
You can save the screen image being displayed in the Pixel Perfect pane as a PNG file. This produces a screenshot of the current screen. To do this, click Save as PNG at the top of the window. This displays a dialog, in which you can choose a directory and filename for the file.
The panes are not automatically refreshed when you change one of the View objects or go to another Activity. To refresh the Pixel Perfect pane and the Loupe pane, click Refresh Screenshot at the top of the window. This will change the panes to reflect the current screen image. You still may need to refresh the View Object pane; to do this, click Refresh Tree at the top of the window.
To automatically refresh the panes while you are debugging, set Auto Refresh at the top of the window, and then set a refresh rate with the Refresh Rate slider at the bottom of the Loupe pane.
Working with Pixel Perfect overlays
You often construct a UI based on a design done as a bitmap image. The Pixel Perfect window helps you match up your View layout to a bitmap image by allowing you to load the bitmap as an overlay on the screen image.
To use a bitmap image as an overlay:
· Start your application in a device or emulator and navigate to the Activity whose UI you want to work with.
· Start Hierarchy Viewer and navigate to the Pixel Perfect window.
· At the top of the window, click Load Overlay. A dialog opens, prompting for the image file to load. Load the image file.
· Pixel Perfect displays the overlay over the screen image in the Pixel Perfect pane. The lower left corner of the bitmap image (X=0, Y=max value) is anchored on the lower leftmost pixel (X=0, Y=max screen) of the screen.
By default, the overlay has a 50% transparency, which allows you to see the screen image underneath. You can adjust this with the Overlay: slider at the bottom of the Loupe pane.
Also by default, the overlay is not displayed in the Loupe pane. To display it, set Show in Loupe at the top of the window.
The overlay is not saved as part of the screenshot when you save the screen image as a PNG file.
A screenshot of the Pixel Perfect window appears in figure 4.
Figure 4. The Pixel Perfect window


