https://blog.elmah.io/debugging-system-outofmemoryexception-using-net-tools/
Welcome to the second part in the series about Debugging common .NET exceptions. The series is my attempt to demystify common exceptions as well as to provide actual help fixing each exception.

In this post, I take a look at one of the more tricky exceptions to fix: System.OutOfMemoryException. As the name suggests, the exception is thrown when a .NET application runs out of memory. There are a lot of blog posts out there, trying to explain why this exception occurs, but most of them are simply rewrites of the documentation on MSDN: System.OutOfMemoryException Class. In the MSDN article, two different causes of the OutOfMemoryException are presented:
- Attempting to expand a
StringBuilderobject beyond the length defined by itsStringBuilder.MaxCapacityproperty. This type of error typically has this message attached: "Insufficient memory to continue the execution of the program." - The common language runtime (CLR) cannot allocate enough contiguous memory.
In my past 13 years as a .NET developer, I haven't experienced the first problem, why I won't bother spending too much time on it. In short, doing something like this will cause a System.OutOfMemoryException:
StringBuilder sb = new StringBuilder(1, 1);
sb.Insert(0, "x", 2);
Why? Well, we define a new StringBuilder with a max capacity of one character and then try to insert two characters.
With that out of the way, let's talk about why you are probably experiencing the exception: because the CLR cannot allocate the memory that your program is requesting. To translate this into something that your Mom would understand, your application is using more resources than available.
.NET programs often use a lot of memory. The memory management in .NET is based on garbage collection, which means that you don't need to tell the framework when to clean up. When .NET detects that an object is no longer needed, it is marked for deletion and deleted next time the garbage collector is running. This also means that an OutOfMemoryException doesn't always equal a problem. 32-bit processes have 2 GB of virtual memory available, and 64-bit processes have up to 8 TB. Always make sure to compile your app to 64-bit if running on a 64-bit OS (it probably does that already). If you're interested in more details about this subject, I recommend this article from Eric Lippert, a former Microsoft employee working on the C# compiler: “Out Of Memory” Does Not Refer to Physical Memory. It's important to distinguish between heavy memory usage and a memory leak. The first scenario can be acceptable, while the second always requires debugging.
To start debugging the OutOfMemoryException, I recommend you to look at your application either through the Task Manager or using perfmon.msc. Both tools can track the current memory consumption, but to get a better overview over time, perfmon is the best. When launched, right-click the graph area and click Add Counters... Expand the .NET CLR Memory node and click # Total committed Bytes. Finally, select the process you want to monitor in the Instances of selected object list and click the OK button.
For the rest of this post, I will use and modify a sample program, adding strings to a list:
class Program
{
    static void Main(string[] args)
    {
        try
        {
            var list = new List<string>();
            int counter = 0;
            while (true)
            {
                list.Add(Guid.NewGuid().ToString());
                counter++;
                if (counter%10000000 == 0)
                {
                    list.Clear();
                }

            }
        }
        catch (OutOfMemoryException e)
        {
            Environment.FailFast(String.Format($"Out of Memory: {e.Message}"));
        }
    }
}
In its current state, the program keeps adding strings to a list and every 10,000,000 times clear the list. When looking at the current memory usage in Perfmon, you'll see the current picture:
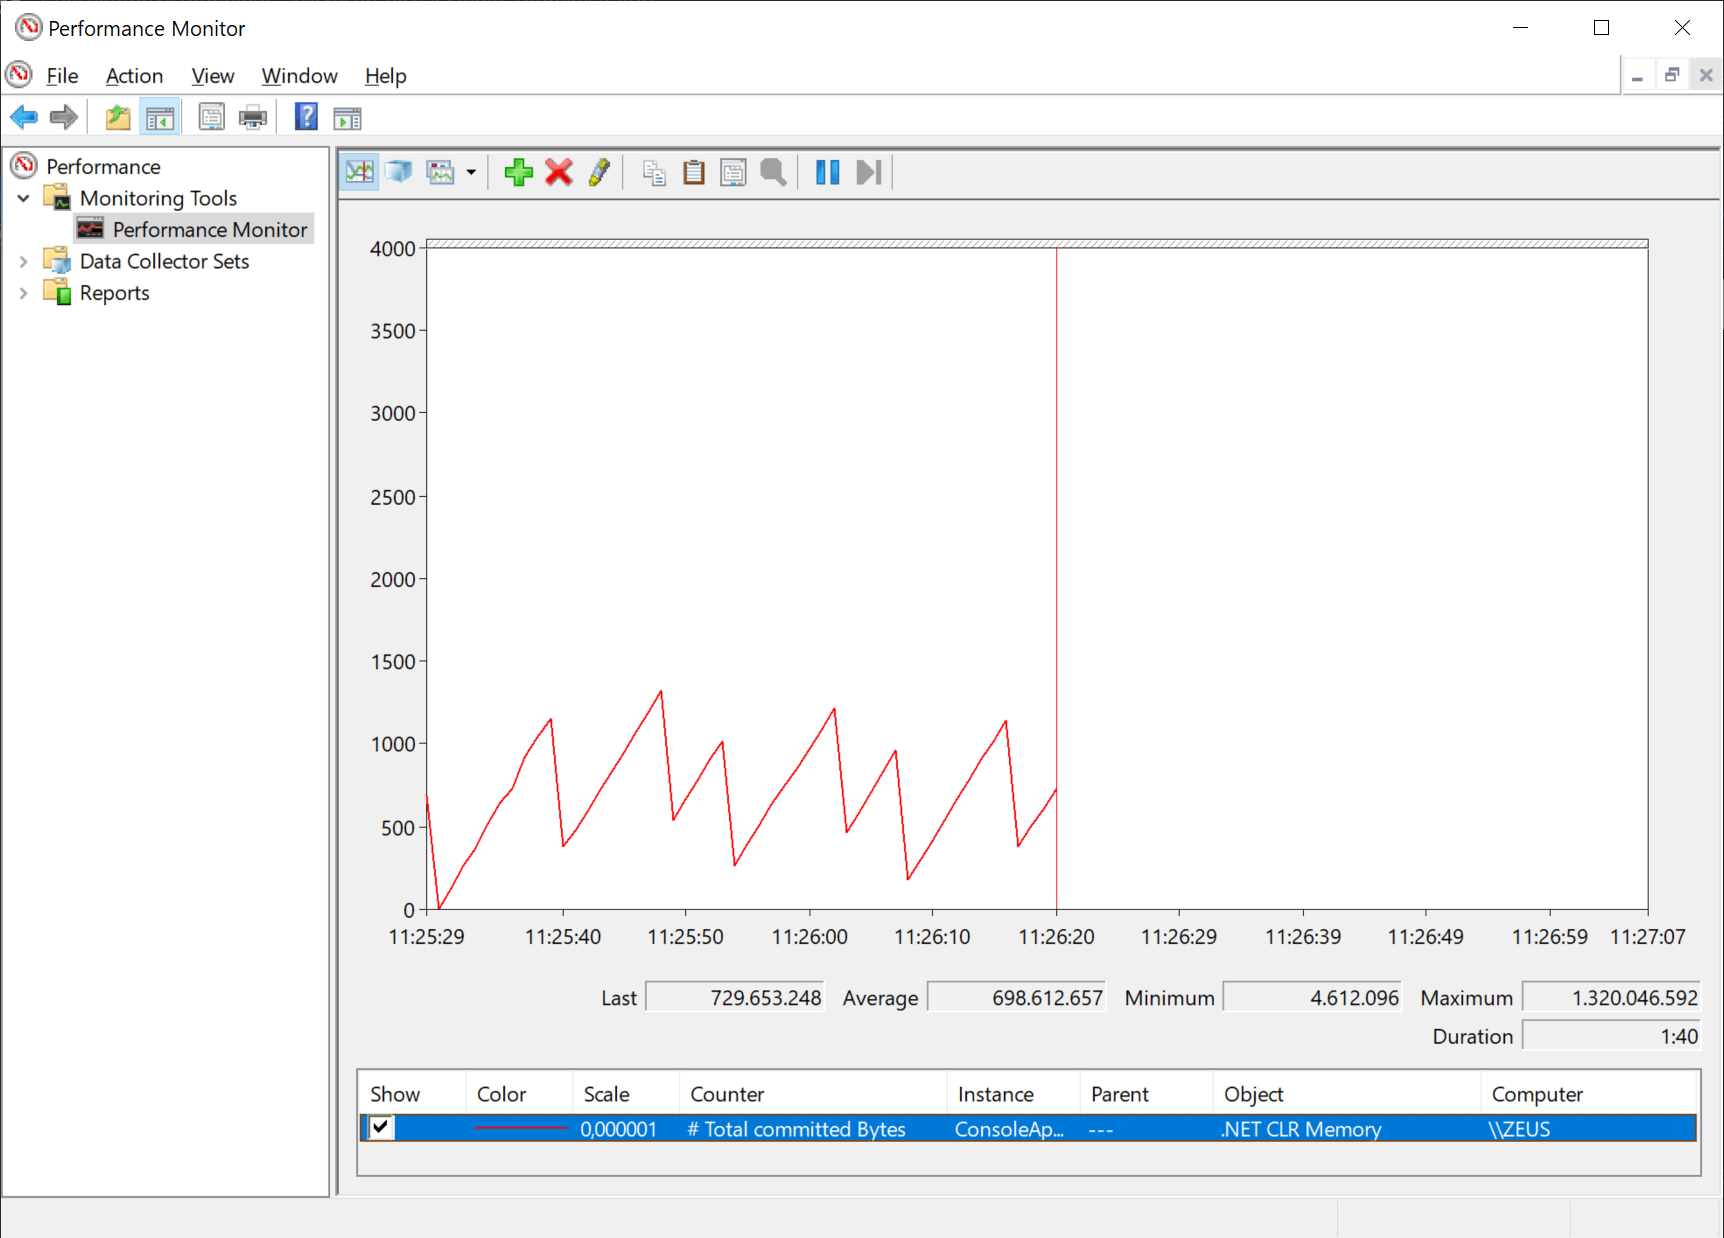
Garbage collection at its finest. Here, I've removed the call to list.Clear():
class Program
{
    static void Main(string[] args)
    {
        try
        {
            var list = new List<string>();
            while (true)
            {
                list.Add(Guid.NewGuid().ToString());
            }
        }
        catch (OutOfMemoryException e)
        {
            Environment.FailFast(String.Format($"Out of Memory: {e.Message}"));
        }
    }
}
We now get a completely other picture:
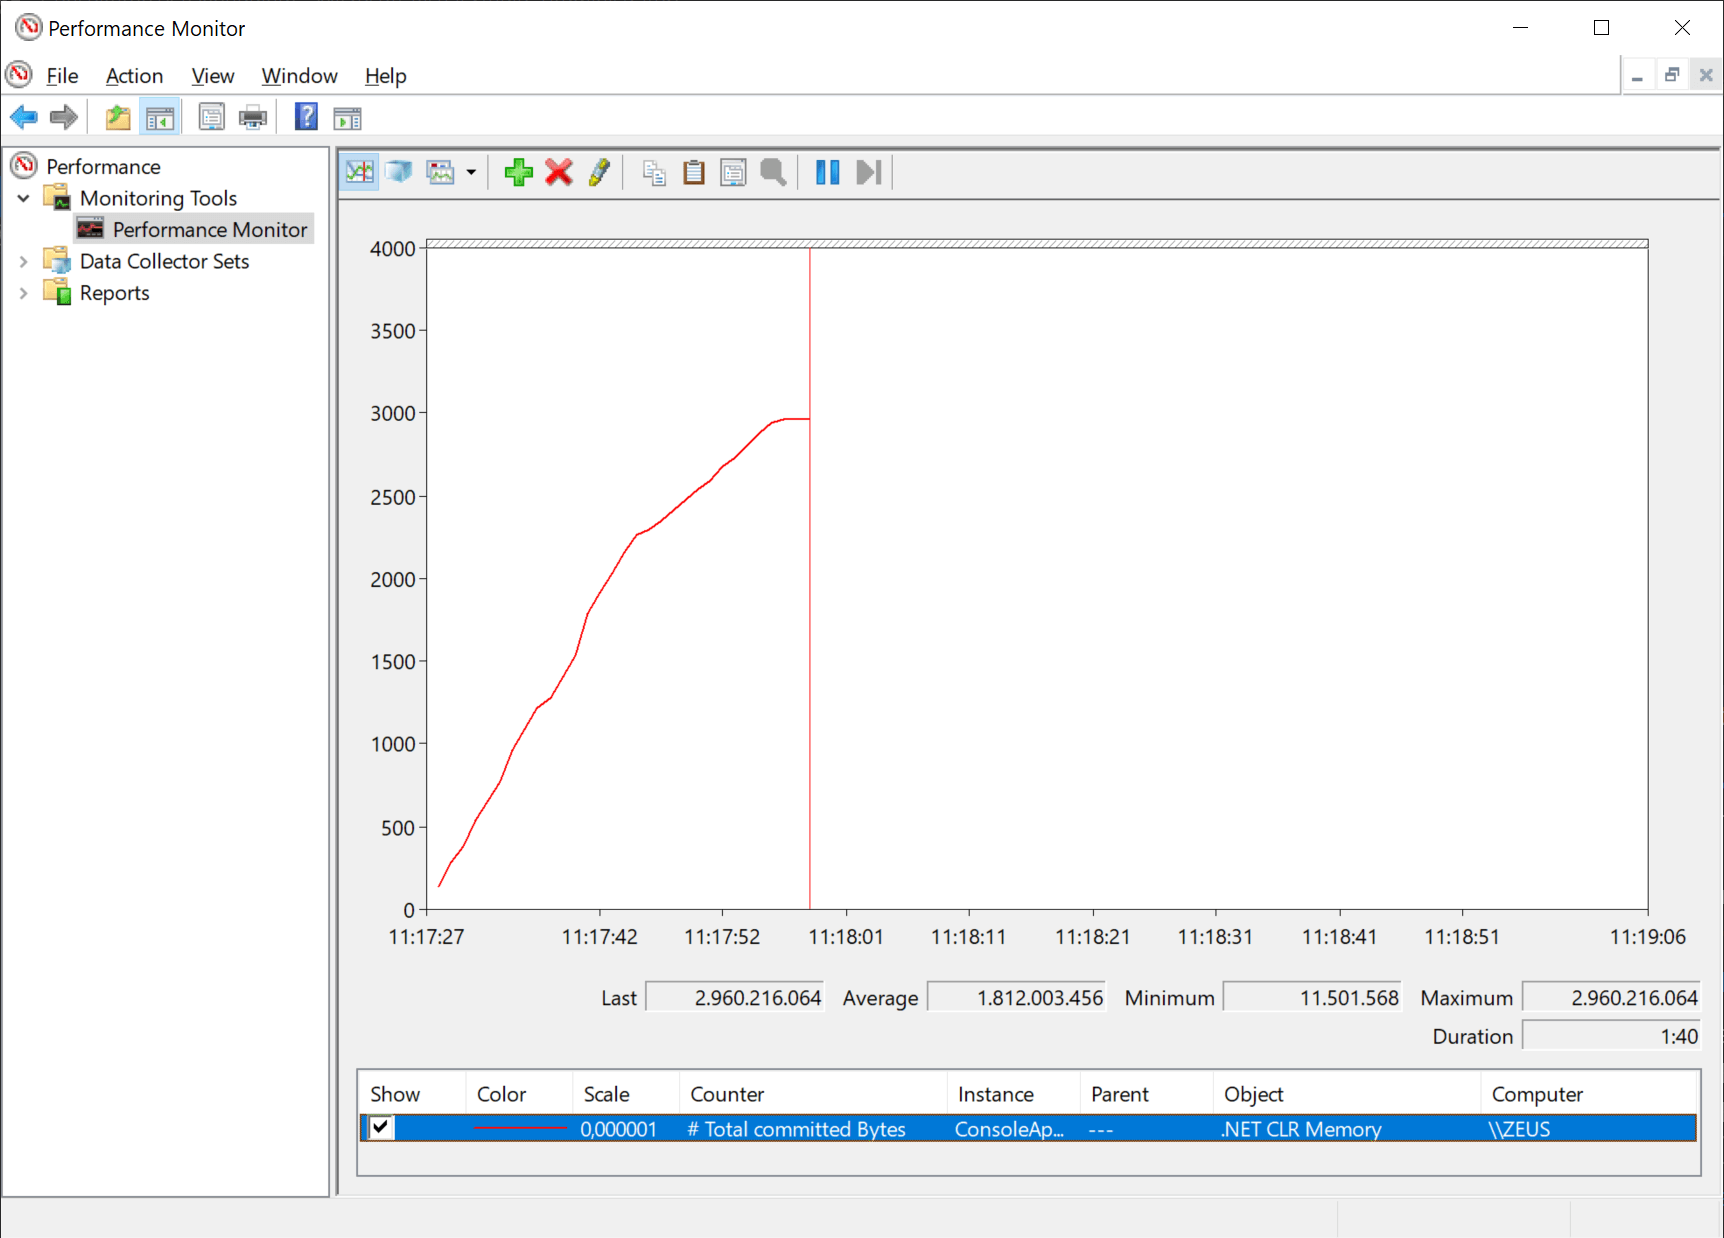
The program keeps allocating memory, until a System.OutOfMemoryException is thrown.
The example illustrates how you can utilize Perfmon to monitor the state of your application. Like the chefs on TV, I cheated and made up an example for this post. In your case, you probably have no clue to what causes the extensive use of memory. Memory profilers to the rescue!
Unlike Task Manager and Perfmon, memory profilers are tools to help you find the root cause of a memory problem or memory leak. There a lot of useful tools out there like JetBrains dotMemory and ANTS Memory Profiler. For this post, I'll use .NET Memory Profiler, which I have used heavily in the past. BTW, as an elmah.io customer, you will get a 20% discount on .NET Memory Profiler.
.NET Memory Profiler integrates nicely into Visual Studio, why profiling your application is available by clicking the new Profiler > Start Memory Profiler menu item. Running our sample from previously, we see a picture similar to that of Perfmon:
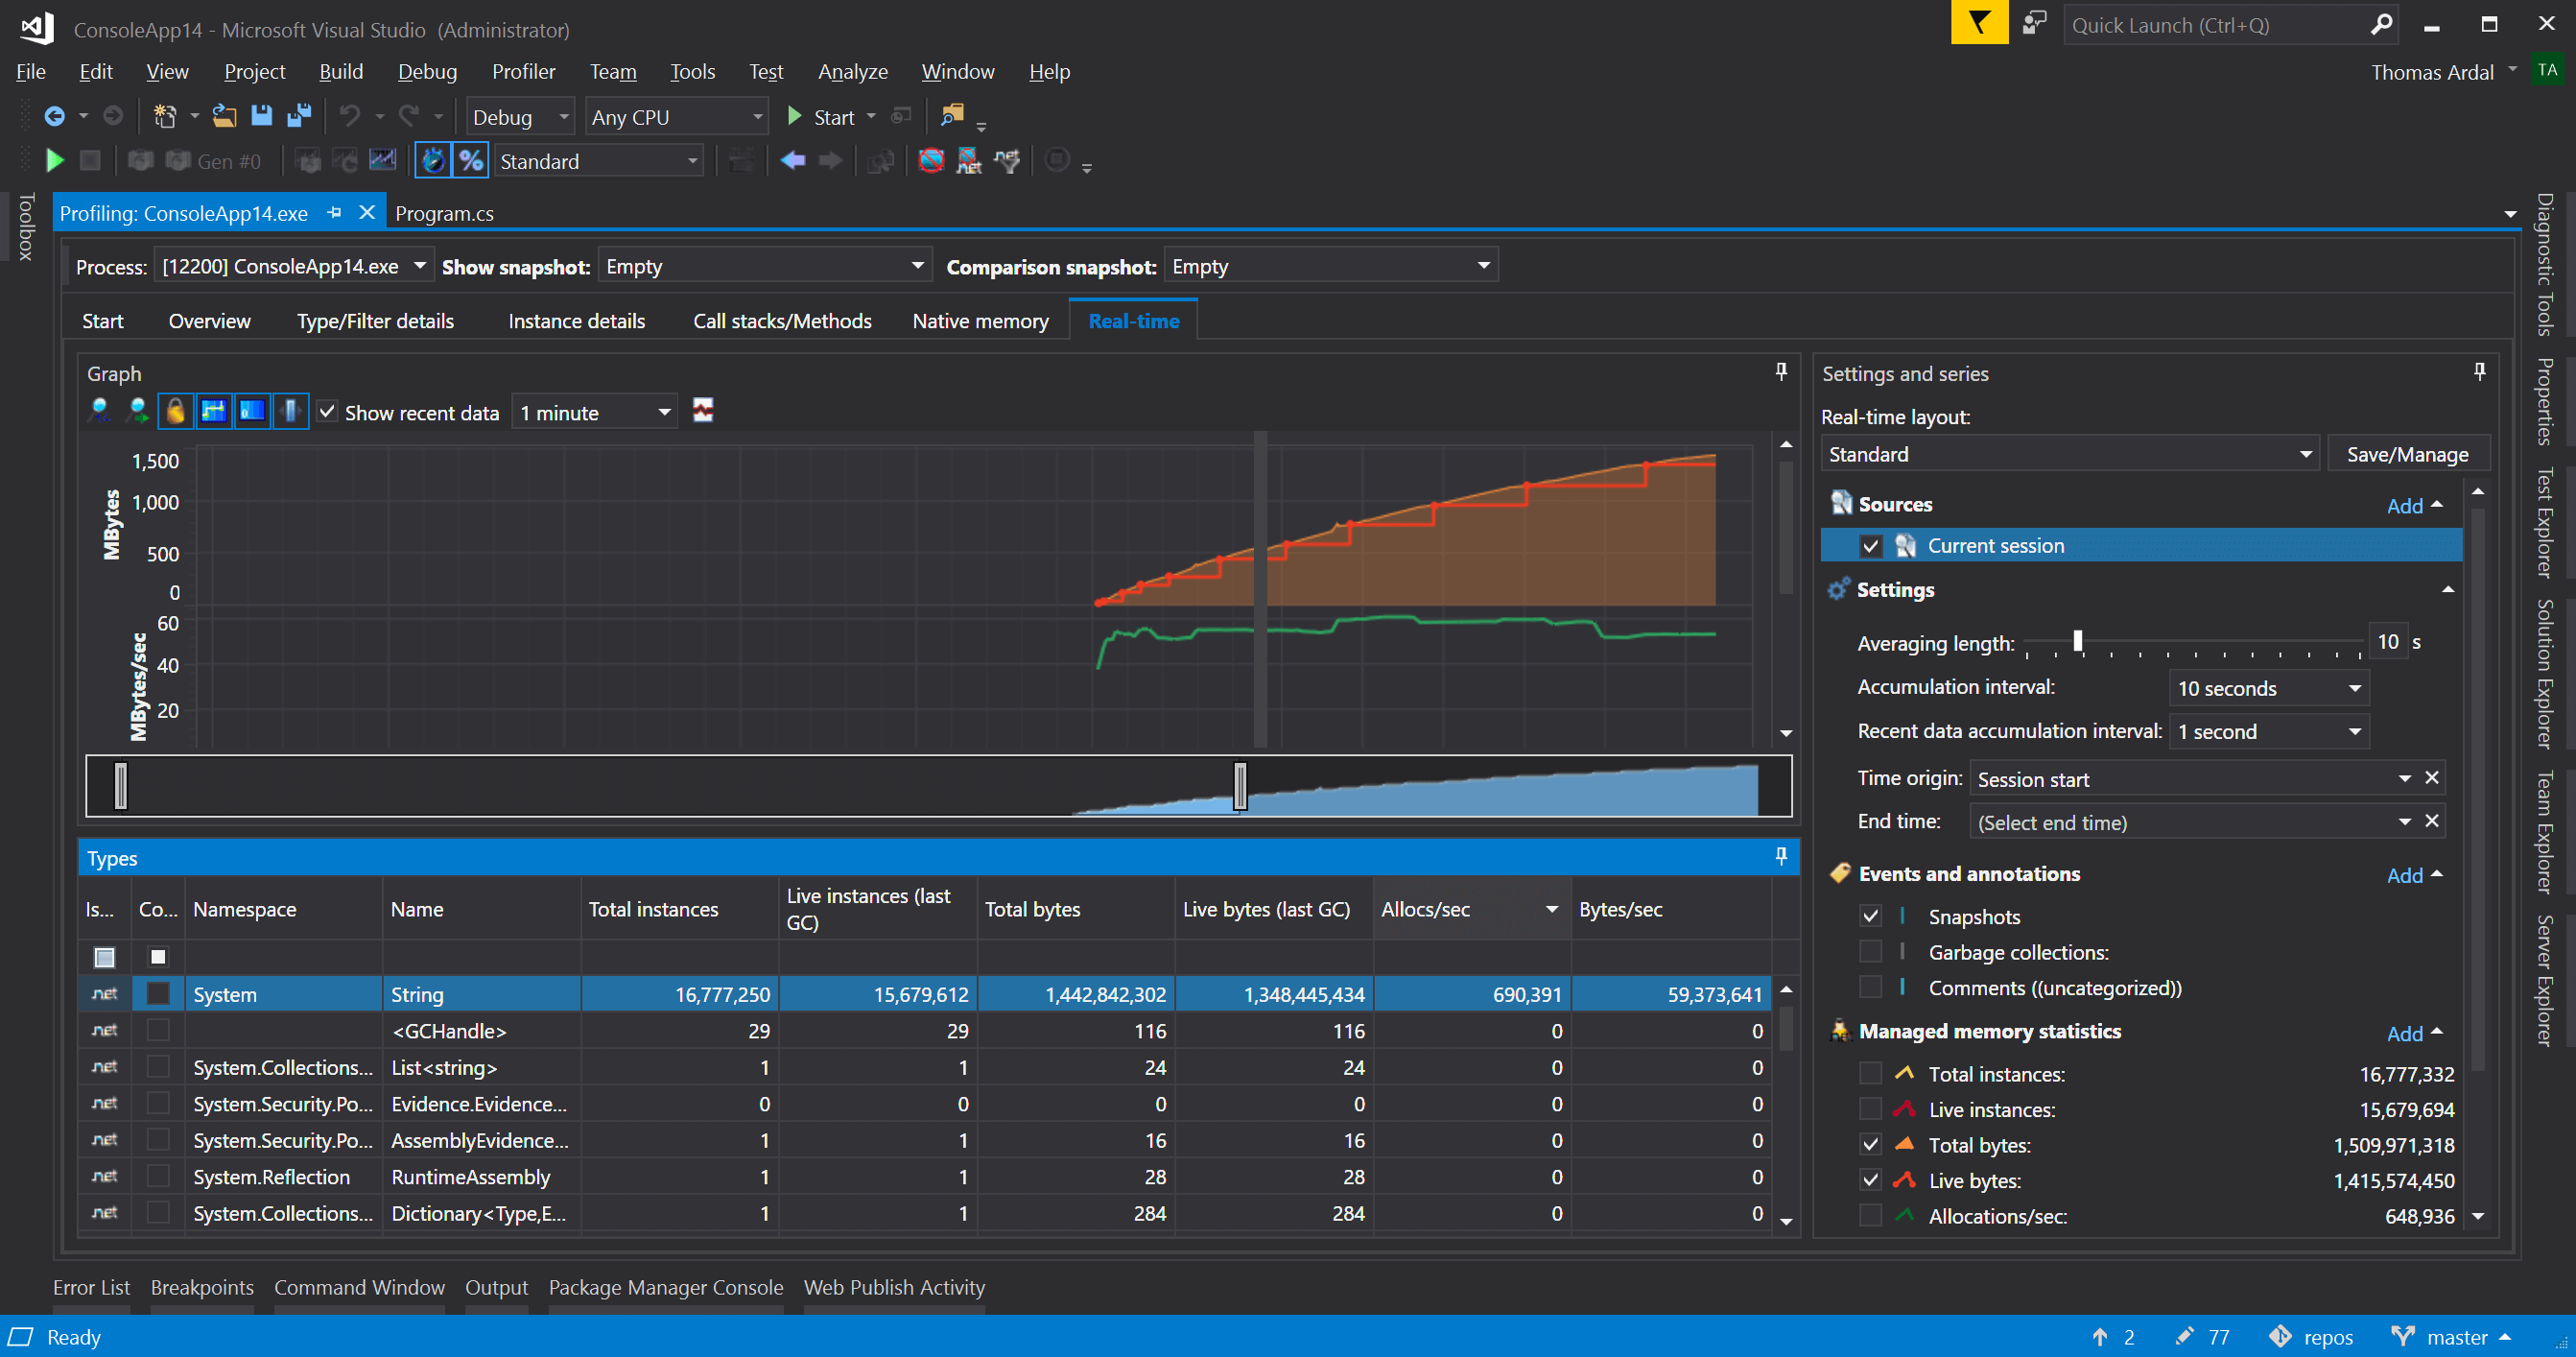
The picture looks pretty much like before. The process allocates more and more memory (the orange and red lines), and the process throws an exception. In the bottom, all objects allocated from the profiling sessions are shown and ordered allocations. Looking at the top rows is a good indicator of what is causing a leak.
In the simple example, it's obvious that the strings added to the list if the problem. But most programs are more complex than just adding random strings to a list. This is where the snapshot feature available in .NET Memory Profiler (and other tools as well) shows its benefits. Snapshots are like restore points in Windows, a complete picture of the current memory usage. By clicking the Collect snapshot button while the process is running, you get a diff:
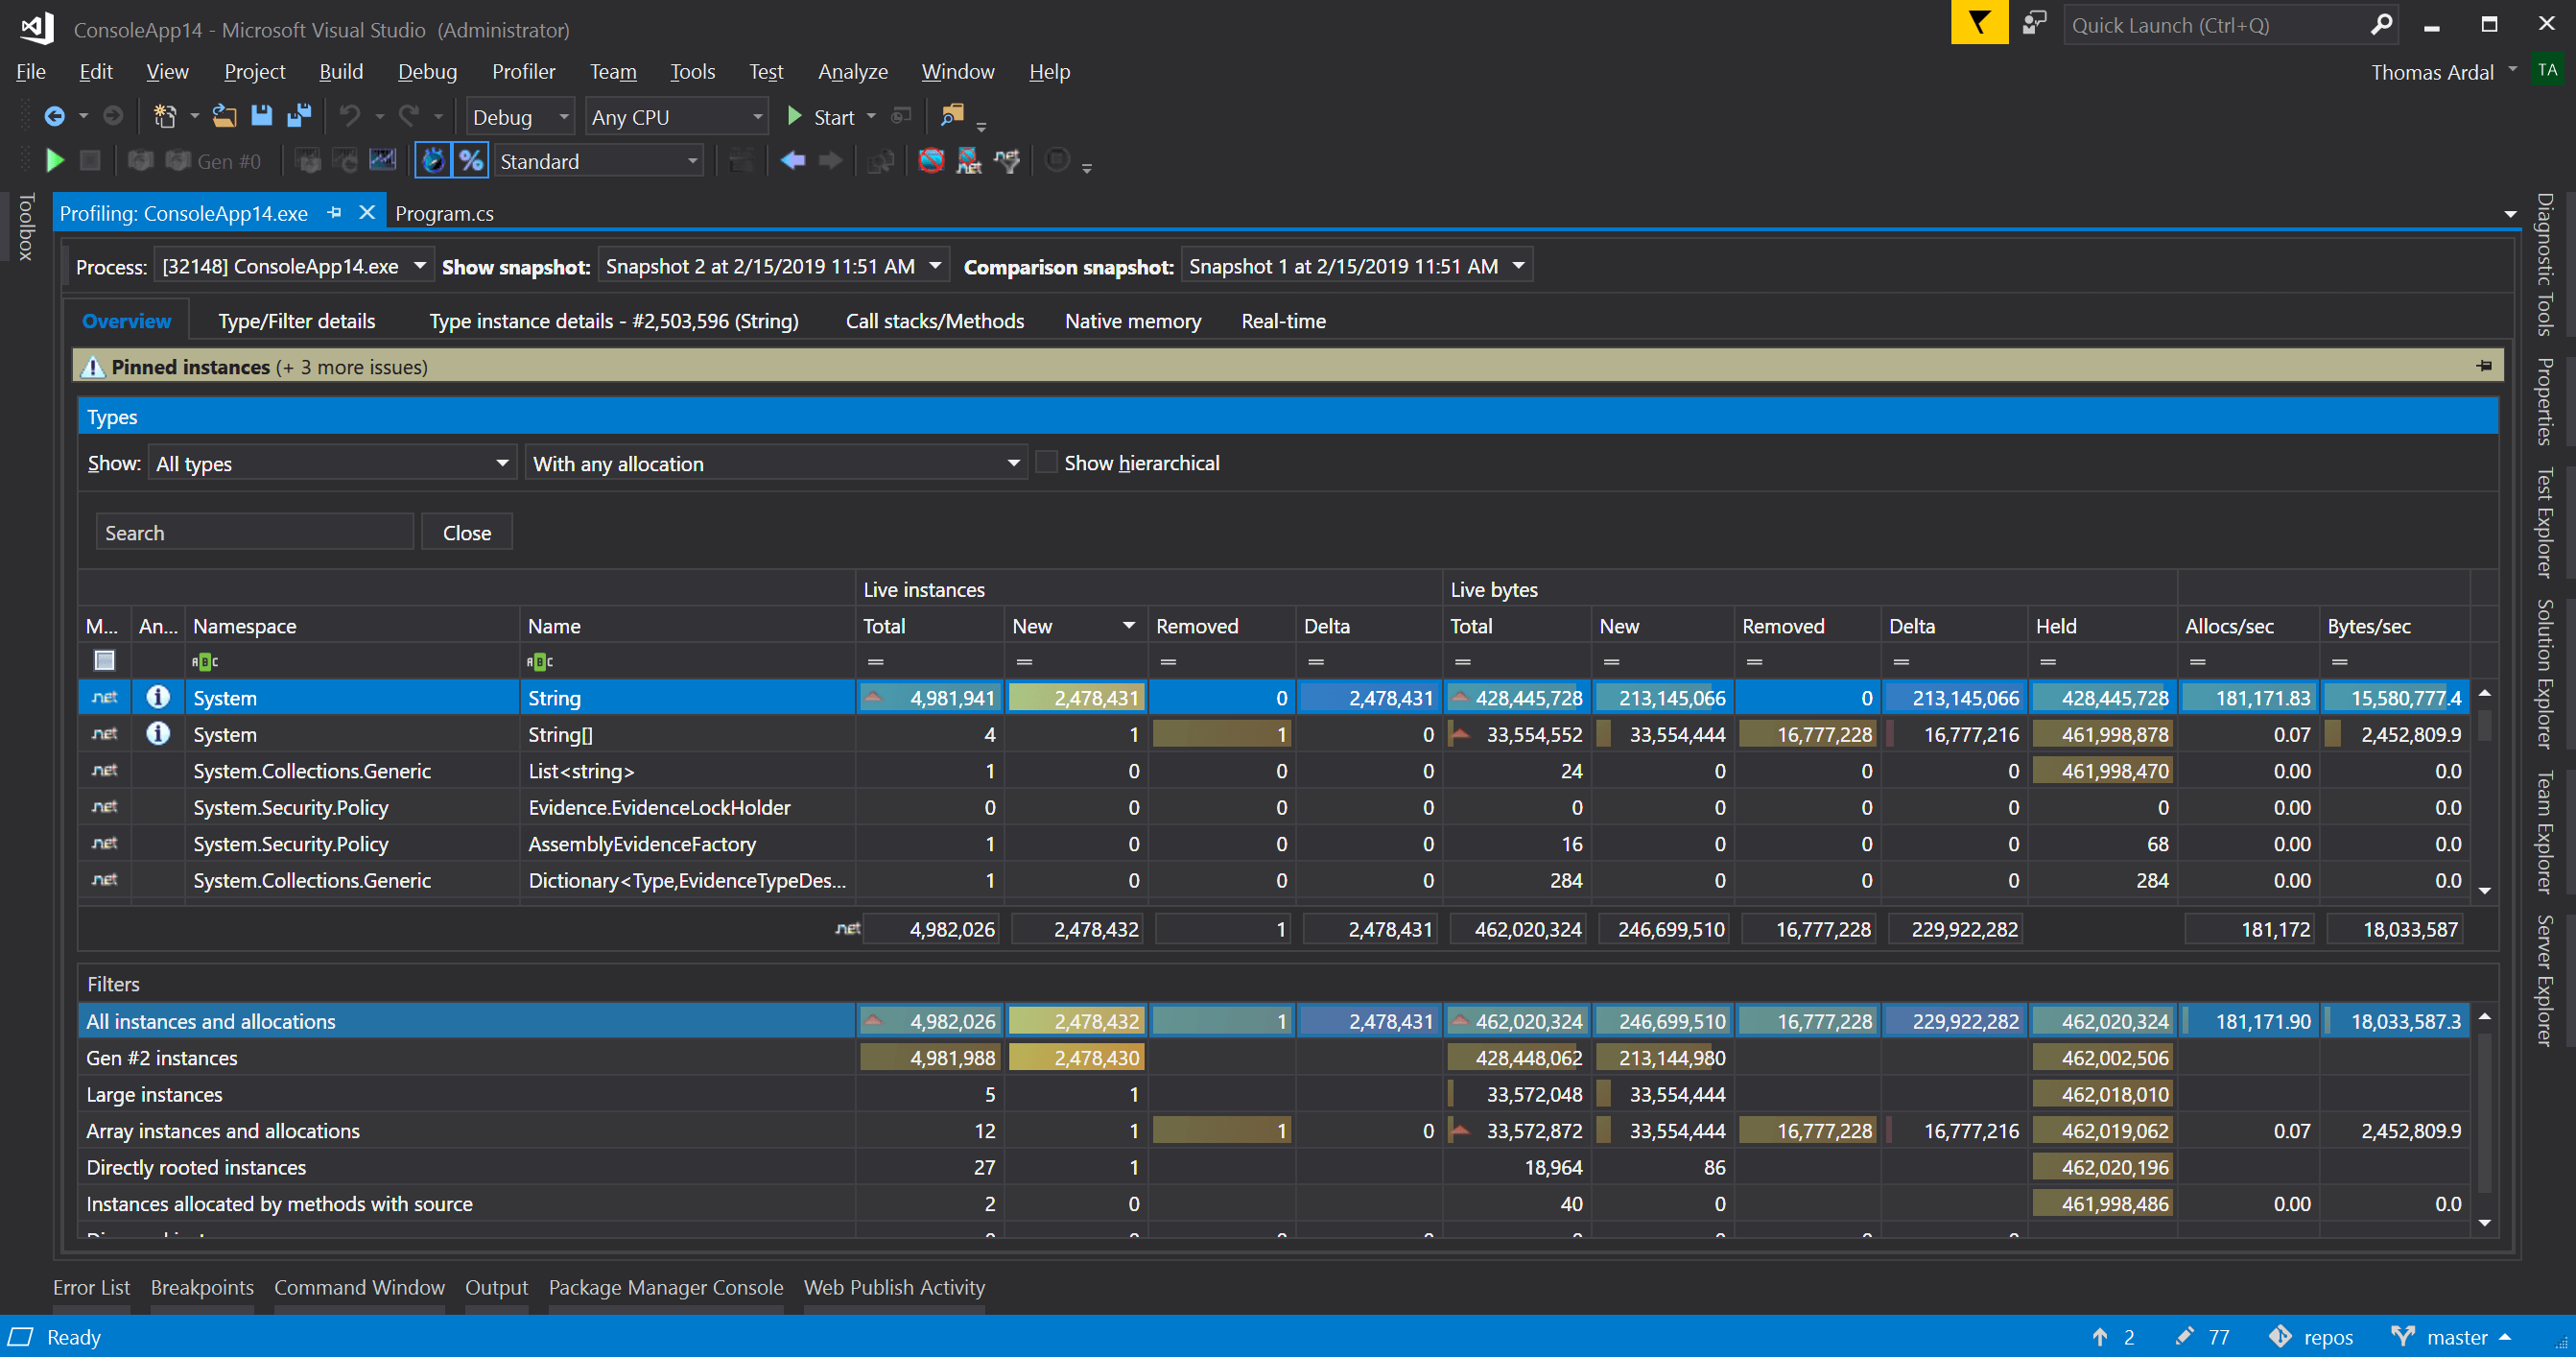
Looking at the Live Instances > New column, it's clear that someone is creating a lot of strings.
I don't want this to be an ad for .NET Memory Profiler, so check out their documentation for the full picture of how to profile memory in your .NET programs. Also, make sure to check out the alternative products mentioned above. All of them have free trials, so try them out and pick your favorite.
I hope that this post has provided you with "a very particular set of skills" (sorry) to help you debug memory issues. Unfortunately, locating memory leaks can be extremely hard and requires some training and experience.
Also make sure to read the other posts in this series: Debugging common .NET exception.
https://docs.microsoft.com/en-us/dotnet/api/system.outofmemoryexception?view=net-5.0
An OutOfMemoryException exception has two major causes:
-
You are attempting to expand a StringBuilder object beyond the length defined by its StringBuilder.MaxCapacity property.
-
The common language runtime cannot allocate enough contiguous memory to successfully perform an operation. This exception can be thrown by any property assignment or method call that requires a memory allocation. For more information on the cause of the OutOfMemoryException exception, see the blog post "Out of Memory" Does Not Refer to Physical Memory.
You are calling the StringBuilder.Insert method.
You are attempting to increase the length of a StringBuilder object beyond the size specified by its StringBuilder.MaxCapacity property.
Your app runs as a 32-bit process.
32-bit processes can allocate a maximum of 2GB of virtual user-mode memory on 32-bit systems, and 4GB of virtual user-mode memory on 64-bit systems. This can make it more difficult for the common language runtime to allocate sufficient contiguous memory when a large allocation is needed. In contrast, 64-bit processes can allocate up to 8TB of virtual memory. To address this exception, recompile your app to target a 64-bit platform. For information on targeting specific platforms in Visual Studio, see How to: Configure Projects to Target Platforms.
Your app is leaking unmanaged resources
Although the garbage collector is able to free memory allocated to managed types, it does not manage memory allocated to unmanaged resources such as operating system handles (including handles to files, memory-mapped files, pipes, registry keys, and wait handles) and memory blocks allocated directly by Windows API calls or by calls to memory allocation functions such as malloc. Types that consume unmanaged resources implement the IDisposable interface.
If you are consuming a type that uses unmanaged resources, you should be sure to call its IDisposable.Dispose method when you have finished using it. (Some types also implement a Close method that is identical in function to a Dispose method.) For more information, see the Using Objects That Implement IDisposable topic.
If you have created a type that uses unmanaged resources, make sure that you have implemented the Dispose pattern and, if necessary, supplied a finalizer. For more information, see Implementing a Dispose method and Object.Finalize.
You are attempting to create a large array in a 64-bit process
By default, the common language runtime in .NET Framework does not allow single objects whose size exceeds 2GB. To override this default, you can use the <gcAllowVeryLargeObjects> configuration file setting to enable arrays whose total size exceeds 2 GB. On .NET Core, support for arrays of greater than 2 GB is enabled by default.
You are working with very large sets of data (such as arrays, collections, or database data sets) in memory.
When data structures or data sets that reside in memory become so large that the common language runtime is unable to allocate enough contiguous memory for them, an OutOfMemoryException exception results.
To prevent the OutOfMemoryException exceptions, you must modify your application so that less data is resident in memory, or the data is divided into segments that require smaller memory allocations. For example:
-
If you are retrieving all of the data from a database and then filtering it in your app to minimize trips to the server, you should modify your queries to return only the subset of data that your app needs. When working with large tables, multiple queries are almost always more efficient than retrieving all of the data in a single table and then manipulating it.
-
If you are executing queries that users create dynamically, you should ensure that the number of records returned by the query is limited.
-
If you are using large arrays or other collection objects whose size results in an OutOfMemoryException exception, you should modify your application to work the data in subsets rather than to work with it all at once.
解决方案:
the OutOfMemoryException exception by processing the incoming data without storing the entire data set in memory, serializing the data to a file if necessary to permit further processing (these lines are commented out in the example, since in this case they produce a file whose size is greater than 1GB), and returning the calculated mean and the number of cases to the calling routine.
You are repeatedly concatenating large strings.
Because strings are immutable, each string concatenation operation creates a new string. The impact for small strings, or for a small number of concatenation operations, is negligible. But for large strings or a very large number of concatenation operations, string concatenation can lead to a large number of memory allocations and memory fragmentation, poor performance, and possibly OutOfMemoryException exceptions.
When concatenating large strings or performing a large number of concatenation operations, you should use the StringBuilder class instead of the String class. When you have finished manipulating the string, convert the StringBuilder instance to a string by calling the StringBuilder.ToString method.
You pin a large number of objects in memory.
Pinning a large number of objects in memory for long periods can make it difficult for the garbage collector to allocate contiguous blocks of memory. If you've pinned a large number of objects in memory, for example by using the fixed statement in C# or by calling the GCHandle.Alloc(Object, GCHandleType) method with a handle type of GCHandleType.Pinned, you can do the following to address the OutOfMemoryException exception.
-
Evaluate whether each object really needs to be pinned,
-
Ensure that each object is unpinned as soon as possible.
-
Make sure that each call to the GCHandle.Alloc(Object, GCHandleType) method to pin memory has a corresponding call to the GCHandle.Free method to unpin that memory.
The following Microsoft intermediate (MSIL) instructions throw an OutOfMemoryException exception:
“Out Of Memory” Does Not Refer to Physical Memory
 I started programming on x86 machines during a period of large and rapid change in the memory management strategies enabled by the Intel processors. The pain of having to know the difference between “extended memory” and “expanded memory” has faded with time, fortunately, along with my memory of the exact difference.
As a result of that early experience, I am occasionally surprised by the fact that many professional programmers seem to have ideas about memory management that haven’t been true since before the “80286 protected mode” days.
For example, I occasionally get the question “I got an ‘out of memory’ error but I checked and the machine has plenty of RAM, what’s up with that?”
Imagine, thinking that the amount of memory you have in your machine is relevant when you run out of it! How charming! :-)
The problem, I think, with most approaches to describing modern virtual memory management is that they start with assuming the DOS world – that “memory” equals RAM, aka “physical memory”, and that “virtual memory” is just a clever trick to make the physical memory seem bigger. Though historically that is how virtual memory evolved on Windows, and is a reasonable approach, that’s not how I personally conceptualize virtual memory management.
So, a quick sketch of my somewhat backwards conceptualization of virtual memory. But first a caveat. The modern Windows memory management system is far more complex and interesting than this brief sketch, which is intended to give the flavour of virtual memory management systems in general and some mental tools for thinking clearly about what the relationship between storage and addressing is. It is not by any means a tutorial on the real memory manager. (For more details on how it actually works, try this MSDN article.)
I’m going to start by assuming that you understand two concepts that need no additional explanation: the operating system manages processes, and the operating system manages files on disk.
Each process can have as much data storage as it wants. It asks the operating system to create for it a certain amount of data storage, and the operating system does so.
Now, already I am sure that myths and preconceptions are starting to crowd in. Surely the process cannot ask for “as much as it wants”. Surely the 32 bit process can only ask for 2 GB, tops. Or surely the 32 bit process can only ask for as much data storage as there is RAM. Neither of those assumptions are true. The amount of data storage reserved for a process is only limited by the amount of space that the operating system can get on the disk. (*)
This is the key point: the data storage that we call “process memory” is in my opinion best visualized as a massive file on disk.
So, suppose the 32 bit process requires huge amounts of storage, and it asks for storage many times. Perhaps it requires a total of 5 GB of storage. The operating system finds enough disk space for 5GB in files and tells the process that sure, the storage is available. How does the process then write to that storage? The process only has 32 bit pointers, but uniquely identifying every byte in 5GB worth of storage would require at least 33 bits.
Solving that problem is where things start to get a bit tricky.
The 5GB of storage is split up into chunks, typically 4KB each, called “pages”. The operating system gives the process a 4GB “virtual address space” – over a million pages - which can be addressed by a 32 bit pointer. The process then tells the operating system which pages from the 5GB of on-disk storage should be “mapped” into the 32 bit address space. (How? Here’s a page where Raymond Chen gives an example of how to allocate a 4GB chunk and map a portion of it.)
Once the mapping is done then the operating system knows that when the process #98 attempts to use pointer 0x12340000 in its address space, that this corresponds to, say, the byte at the beginning of page #2477, and the operating system knows where that page is stored on disk. When that pointer is read from or written to, the operating system can figure out what byte of the disk storage is referred to, and do the appropriate read or write operation.
An “out of memory” error almost never happens because there’s not enough storage available; as we’ve seen, storage is disk space, and disks are huge these days. Rather, an “out of memory” error happens because the process is unable to find a large enough section of contiguous unused pages in its virtual address space to do the requested mapping.
Half (or, in some cases, a quarter) of the 4GB address space is reserved for the operating system to store it’s process-specific data. Of the remaining “user” half of the address space, significant amounts of it are taken up by the EXE and DLL files that make up the application’s code. Even if there is enough space in total, there might not be an unmapped “hole” in the address space large enough to meet the process’s needs.
The process can deal with this situation by attempting to identify portions of the virtual address space that no longer need to be mapped, “unmap” them, and then map them to some other pages in the storage file. If the 32 bit process is designed to handle massive multi-GB data storages, obviously that’s what its got to do. Typically such programs are doing video processing or some such thing, and can safely and easily re-map big chunks of the address space to some other part of the “memory file”.
But what if it isn’t? What if the process is a much more normal, well-behaved process that just wants a few hundred million bytes of storage? If such a process is just ticking along normally, and it then tries to allocate some massive string, the operating system will almost certainly be able to provide the disk space. But how will the process map the massive string’s pages into address space?
If by chance there isn’t enough contiguous address space then the process will be unable to obtain a pointer to that data, and it is effectively useless. In that case the process issues an “out of memory” error. Which is a misnomer, these days. It really should be an “unable to find enough contiguous address space” error; there’s plenty of memory because memory equals disk space.
I haven’t yet mentioned RAM. RAM can be seen as merely a performance optimization. Accessing data in RAM, where the information is stored in electric fields that propagate at close to the speed of light is much faster than accessing data on disk, where information is stored in enormous, heavy ferrous metal molecules that move at close to the speed of my Miata. (**)
The operating system keeps track of what pages of storage from which processes are being accessed most frequently, and makes a copy of them in RAM, to get the speed increase. When a process accesses a pointer corresponding to a page that is not currently cached in RAM, the operating system does a “page fault”, goes out to the disk, and makes a copy of the page from disk to RAM, making the reasonable assumption that it’s about to be accessed again some time soon.
The operating system is also very smart about sharing read-only resources. If two processes both load the same page of code from the same DLL, then the operating system can share the RAM cache between the two processes. Since the code is presumably not going to be changed by either process, it's perfectly sensible to save the duplicate page of RAM by sharing it.
But even with clever sharing, eventually this caching system is going to run out of RAM. When that happens, the operating system makes a guess about which pages are least likely to be accessed again soon, writes them out to disk if they’ve changed, and frees up that RAM to read in something that is more likely to be accessed again soon.
When the operating system guesses incorrectly, or, more likely, when there simply is not enough RAM to store all the frequently-accessed pages in all the running processes, then the machine starts “thrashing”. The operating system spends all of its time writing and reading the expensive disk storage, the disk runs constantly, and you don’t get any work done.
This also means that "running out of RAM" seldom(***) results in an “out of memory” error. Instead of an error, it results in bad performance because the full cost of the fact that storage is actually on disk suddenly becomes relevant.
Another way of looking at this is that the total amount of virtual memory your program consumes is really not hugely relevant to its performance. What is relevant is not the total amount of virtual memory consumed, but rather, (1) how much of that memory is not shared with other processes, (2) how big the "working set" of commonly-used pages is, and (3) whether the working sets of all active processes are larger than available RAM.
By now it should be clear why “out of memory” errors usually have nothing to do with how much physical memory you have, or how even how much storage is available. It’s almost always about the address space, which on 32 bit Windows is relatively small and easily fragmented.
And of course, many of these problems effectively go away on 64 bit Windows, where the address space is billions of times larger and therefore much harder to fragment. (The problem of thrashing of course still occurs if physical memory is smaller than total working set, no matter how big the address space gets.)
This way of conceptualizing virtual memory is completely backwards from how it is usually conceived. Usually it’s conceived as storage being a chunk of physical memory, and that the contents of physical memory are swapped out to disk when physical memory gets too full. But I much prefer to think of storage as being a chunk of disk storage, and physical memory being a smart caching mechanism that makes the disk look faster. Maybe I’m crazy, but that helps me understand it better.
*************
(*) OK, I lied. 32 bit Windows limits the total amount of process storage on disk to 16 TB, and 64 bit Windows limits it to 256 TB. But there is no reason why a single process could not allocate multiple GB of that if there’s enough disk space.
(**) Numerous electrical engineers pointed out to me that of course the individual electrons do not move fast at all; it's the field that moves so fast. I've updated the text; I hope you're all happy with it now.
(***) It is possible in some virtual memory systems to mark a page as “the performance of this page is so crucial that it must always remain in RAM”. If there are more such pages than there are pages of RAM available, then you could get an “out of memory” error from not having enough RAM. But this is a much more rare occurrence than running out of address space.
“Out Of Memory” Does Not Refer to Physical Memory
I started programming on x86 machines during a period of large and rapid change in the memory management strategies enabled by the Intel processors. The pain of having to know the difference between “extended memory” and “expanded memory” has faded with time, fortunately, along with my memory of the exact difference.
As a result of that early experience, I am occasionally surprised by the fact that many professional programmers seem to have ideas about memory management that haven’t been true since before the “80286 protected mode” days.
For example, I occasionally get the question “I got an ‘out of memory’ error but I checked and the machine has plenty of RAM, what’s up with that?”
Imagine, thinking that the amount of memory you have in your machine is relevant when you run out of it! How charming! :-)
The problem, I think, with most approaches to describing modern virtual memory management is that they start with assuming the DOS world – that “memory” equals RAM, aka “physical memory”, and that “virtual memory” is just a clever trick to make the physical memory seem bigger. Though historically that is how virtual memory evolved on Windows, and is a reasonable approach, that’s not how I personally conceptualize virtual memory management.
So, a quick sketch of my somewhat backwards conceptualization of virtual memory. But first a caveat. The modern Windows memory management system is far more complex and interesting than this brief sketch, which is intended to give the flavour of virtual memory management systems in general and some mental tools for thinking clearly about what the relationship between storage and addressing is. It is not by any means a tutorial on the real memory manager. (For more details on how it actually works, try this MSDN article.)
I’m going to start by assuming that you understand two concepts that need no additional explanation: the operating system manages processes, and the operating system manages files on disk.
Each process can have as much data storage as it wants. It asks the operating system to create for it a certain amount of data storage, and the operating system does so.
Now, already I am sure that myths and preconceptions are starting to crowd in. Surely the process cannot ask for “as much as it wants”. Surely the 32 bit process can only ask for 2 GB, tops. Or surely the 32 bit process can only ask for as much data storage as there is RAM. Neither of those assumptions are true. The amount of data storage reserved for a process is only limited by the amount of space that the operating system can get on the disk. (*)
This is the key point: the data storage that we call “process memory” is in my opinion best visualized as a massive file on disk.
So, suppose the 32 bit process requires huge amounts of storage, and it asks for storage many times. Perhaps it requires a total of 5 GB of storage. The operating system finds enough disk space for 5GB in files and tells the process that sure, the storage is available. How does the process then write to that storage? The process only has 32 bit pointers, but uniquely identifying every byte in 5GB worth of storage would require at least 33 bits.
Solving that problem is where things start to get a bit tricky.
The 5GB of storage is split up into chunks, typically 4KB each, called “pages”. The operating system gives the process a 4GB “virtual address space” – over a million pages - which can be addressed by a 32 bit pointer. The process then tells the operating system which pages from the 5GB of on-disk storage should be “mapped” into the 32 bit address space. (How? Here’s a page where Raymond Chen gives an example of how to allocate a 4GB chunk and map a portion of it.)
Once the mapping is done then the operating system knows that when the process #98 attempts to use pointer 0x12340000 in its address space, that this corresponds to, say, the byte at the beginning of page #2477, and the operating system knows where that page is stored on disk. When that pointer is read from or written to, the operating system can figure out what byte of the disk storage is referred to, and do the appropriate read or write operation.
An “out of memory” error almost never happens because there’s not enough storage available; as we’ve seen, storage is disk space, and disks are huge these days. Rather, an “out of memory” error happens because the process is unable to find a large enough section of contiguous unused pages in its virtual address space to do the requested mapping.
Half (or, in some cases, a quarter) of the 4GB address space is reserved for the operating system to store it’s process-specific data. Of the remaining “user” half of the address space, significant amounts of it are taken up by the EXE and DLL files that make up the application’s code. Even if there is enough space in total, there might not be an unmapped “hole” in the address space large enough to meet the process’s needs.
The process can deal with this situation by attempting to identify portions of the virtual address space that no longer need to be mapped, “unmap” them, and then map them to some other pages in the storage file. If the 32 bit process is designed to handle massive multi-GB data storages, obviously that’s what its got to do. Typically such programs are doing video processing or some such thing, and can safely and easily re-map big chunks of the address space to some other part of the “memory file”.
But what if it isn’t? What if the process is a much more normal, well-behaved process that just wants a few hundred million bytes of storage? If such a process is just ticking along normally, and it then tries to allocate some massive string, the operating system will almost certainly be able to provide the disk space. But how will the process map the massive string’s pages into address space?
If by chance there isn’t enough contiguous address space then the process will be unable to obtain a pointer to that data, and it is effectively useless. In that case the process issues an “out of memory” error. Which is a misnomer, these days. It really should be an “unable to find enough contiguous address space” error; there’s plenty of memory because memory equals disk space.
I haven’t yet mentioned RAM. RAM can be seen as merely a performance optimization. Accessing data in RAM, where the information is stored in electric fields that propagate at close to the speed of light is much faster than accessing data on disk, where information is stored in enormous, heavy ferrous metal molecules that move at close to the speed of my Miata. (**)
The operating system keeps track of what pages of storage from which processes are being accessed most frequently, and makes a copy of them in RAM, to get the speed increase. When a process accesses a pointer corresponding to a page that is not currently cached in RAM, the operating system does a “page fault”, goes out to the disk, and makes a copy of the page from disk to RAM, making the reasonable assumption that it’s about to be accessed again some time soon.
The operating system is also very smart about sharing read-only resources. If two processes both load the same page of code from the same DLL, then the operating system can share the RAM cache between the two processes. Since the code is presumably not going to be changed by either process, it's perfectly sensible to save the duplicate page of RAM by sharing it.
But even with clever sharing, eventually this caching system is going to run out of RAM. When that happens, the operating system makes a guess about which pages are least likely to be accessed again soon, writes them out to disk if they’ve changed, and frees up that RAM to read in something that is more likely to be accessed again soon.
When the operating system guesses incorrectly, or, more likely, when there simply is not enough RAM to store all the frequently-accessed pages in all the running processes, then the machine starts “thrashing”. The operating system spends all of its time writing and reading the expensive disk storage, the disk runs constantly, and you don’t get any work done.
This also means that "running out of RAM" seldom(***) results in an “out of memory” error. Instead of an error, it results in bad performance because the full cost of the fact that storage is actually on disk suddenly becomes relevant.
Another way of looking at this is that the total amount of virtual memory your program consumes is really not hugely relevant to its performance. What is relevant is not the total amount of virtual memory consumed, but rather, (1) how much of that memory is not shared with other processes, (2) how big the "working set" of commonly-used pages is, and (3) whether the working sets of all active processes are larger than available RAM.
By now it should be clear why “out of memory” errors usually have nothing to do with how much physical memory you have, or how even how much storage is available. It’s almost always about the address space, which on 32 bit Windows is relatively small and easily fragmented.
And of course, many of these problems effectively go away on 64 bit Windows, where the address space is billions of times larger and therefore much harder to fragment. (The problem of thrashing of course still occurs if physical memory is smaller than total working set, no matter how big the address space gets.)
This way of conceptualizing virtual memory is completely backwards from how it is usually conceived. Usually it’s conceived as storage being a chunk of physical memory, and that the contents of physical memory are swapped out to disk when physical memory gets too full. But I much prefer to think of storage as being a chunk of disk storage, and physical memory being a smart caching mechanism that makes the disk look faster. Maybe I’m crazy, but that helps me understand it better.
*************
(*) OK, I lied. 32 bit Windows limits the total amount of process storage on disk to 16 TB, and 64 bit Windows limits it to 256 TB. But there is no reason why a single process could not allocate multiple GB of that if there’s enough disk space.
(**) Numerous electrical engineers pointed out to me that of course the individual electrons do not move fast at all; it's the field that moves so fast. I've updated the text; I hope you're all happy with it now.
(***) It is possible in some virtual memory systems to mark a page as “the performance of this page is so crucial that it must always remain in RAM”. If there are more such pages than there are pages of RAM available, then you could get an “out of memory” error from not having enough RAM. But this is a much more rare occurrence than running out of address space.
注释