之前用以下代码将实验结果用matplotlib show出来
plt.plot(np.arange(len(aver_reward_list)), aver_reward_list)
plt.ylabel('Average Reward')
plt.xlabel('Episode')
plt.tight_layout()
plt.savefig("AverageReward.eps")
plt.show()
画出的图都没什么问题,但忽然有一次数据量比较大,matplotlib开始报错,并且画出的图出现以下问题:
报错:
D:softwarescodingPythonPython3.6libsite-packagesmatplotlibfigure.py:2359: UserWarning: This figure includes Axes that are not compatible with tight_layout, so results might be incorrect.
  warnings.warn("This figure includes Axes that are not compatible "
图:
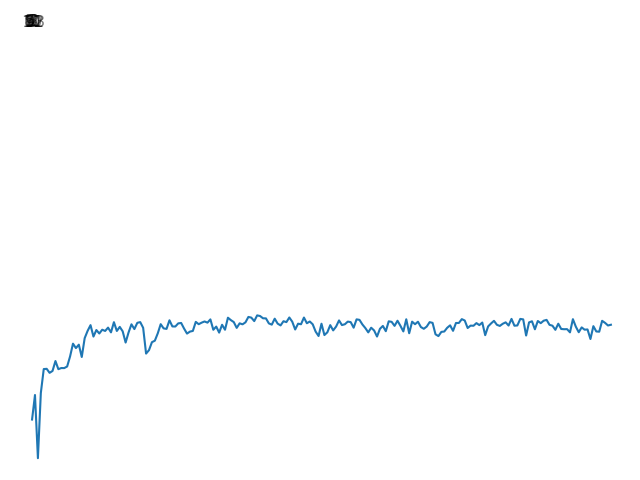
看到坐标轴丢失,并且坐标都挤到一起了,先想到的会不会是数据太多轴坐标密集给挤一起了?
= = too stupid… matplotlib当然会管理好坐标密度的。
然后又看了下matplotlib画图的标准代码,才知道问题出在哪里:
    plt.figure()
    plt.subplot(111)
    plt.plot(np.arange(len(ep_reward_list)), ep_reward_list)
    plt.xlabel('episode')
    plt.ylabel('ep_reward')
    plt.savefig('RL_%s.png' % MAX_EPISODES)
    plt.show()
嗯,,,是没设置画布和子图= =。。。