拉取Prometheus、Grafana镜像
docker pull prom/prometheus
docker pull grafana/grafana
监控MongoDB
docker pull eses/mongodb_exporter
docker run -it -p 9104:9104 --name my_mongo eses/mongodb_exporter --mongodb.uri mongodb://host:27017
http://host:9104可以访问mongo
修改/etc/prometheus/prometheus.yml配置
# my global config
global:
  scrape_interval: 15s
  evaluation_interval: 15s

alerting:
  alertmanagers:
    - static_configs:
        - targets:
          # - alertmanager:9093

rule_files:
  # - "first_rules.yml"
  # - "second_rules.yml"

scrape_configs:
  - job_name: "prometheus"
    static_configs:
      - targets: ["localhost:9090"]
  - job_name: "mongo"
    static_configs:
      - targets: ["host:9104"]
运行prometheus:docker run -it --name my_prometheus -p 9090:9090 -v /root/xx/prometheus.yml: /etc/prometheus/prometheus.yml prom/prometheus
进入容器:docker exec -it container_id /bin/sh
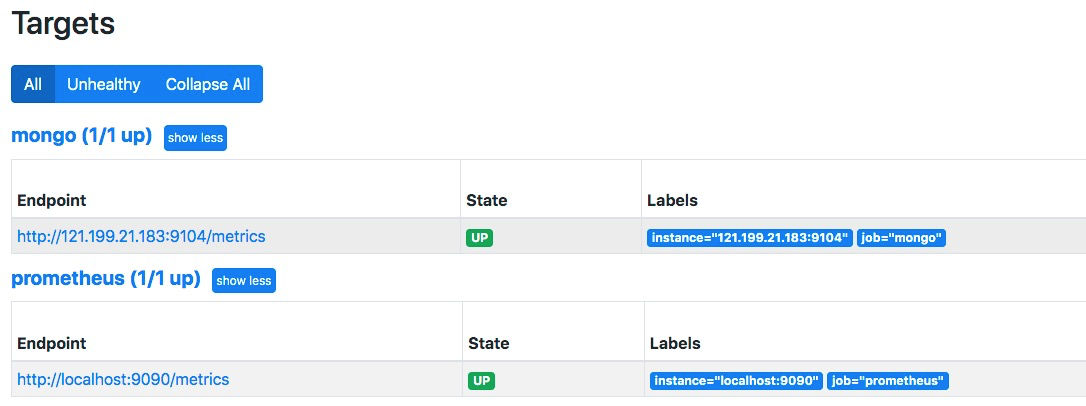
访问 http://host:9090/targets
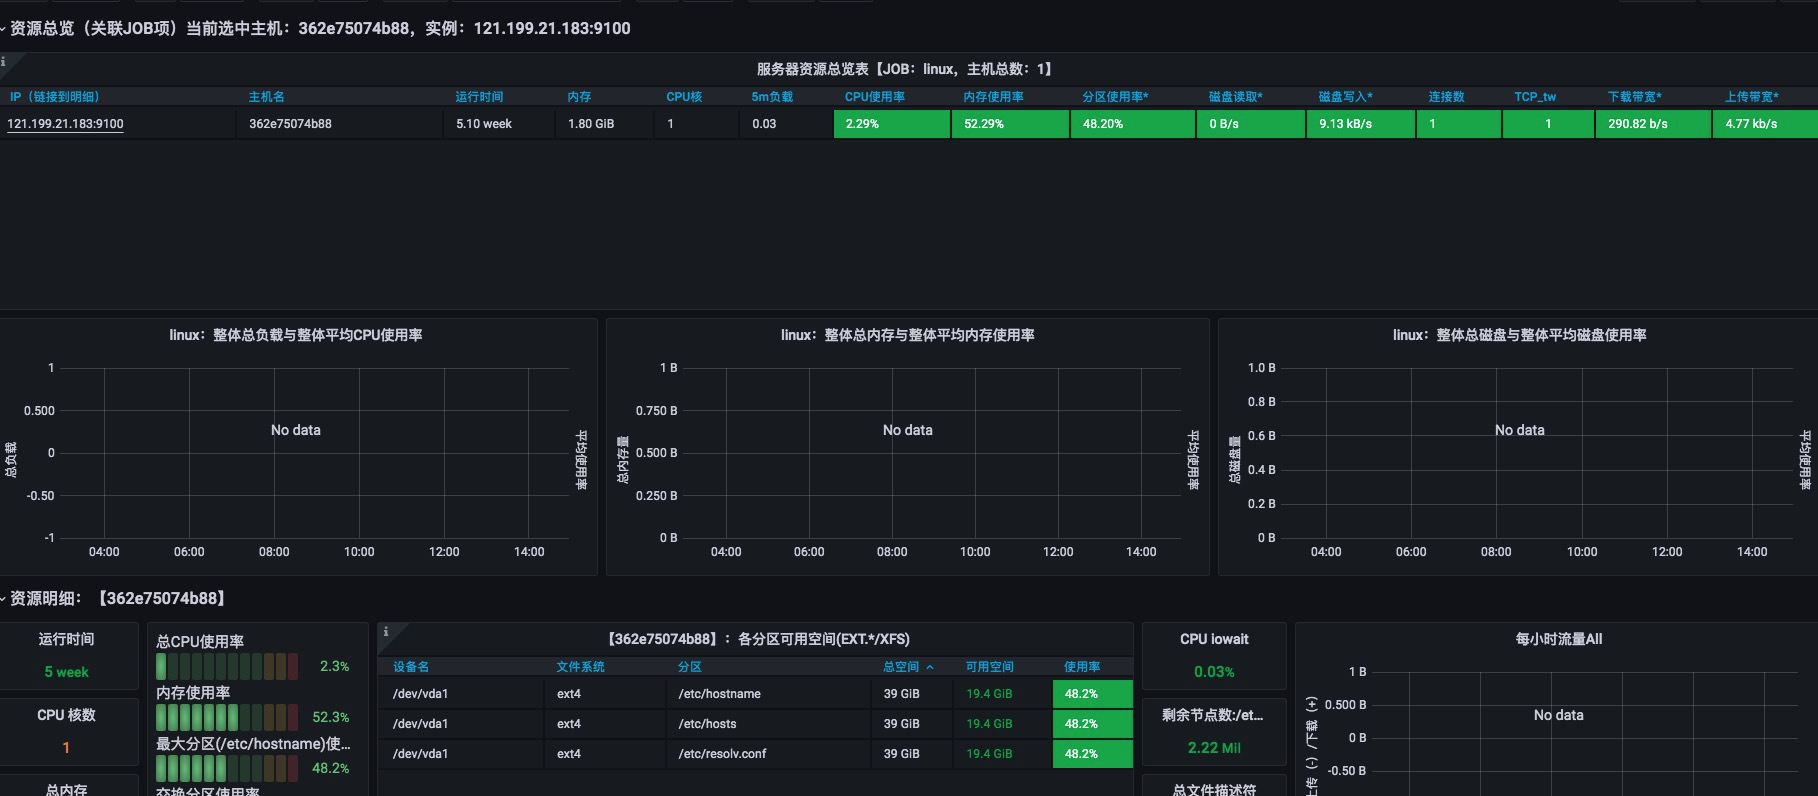
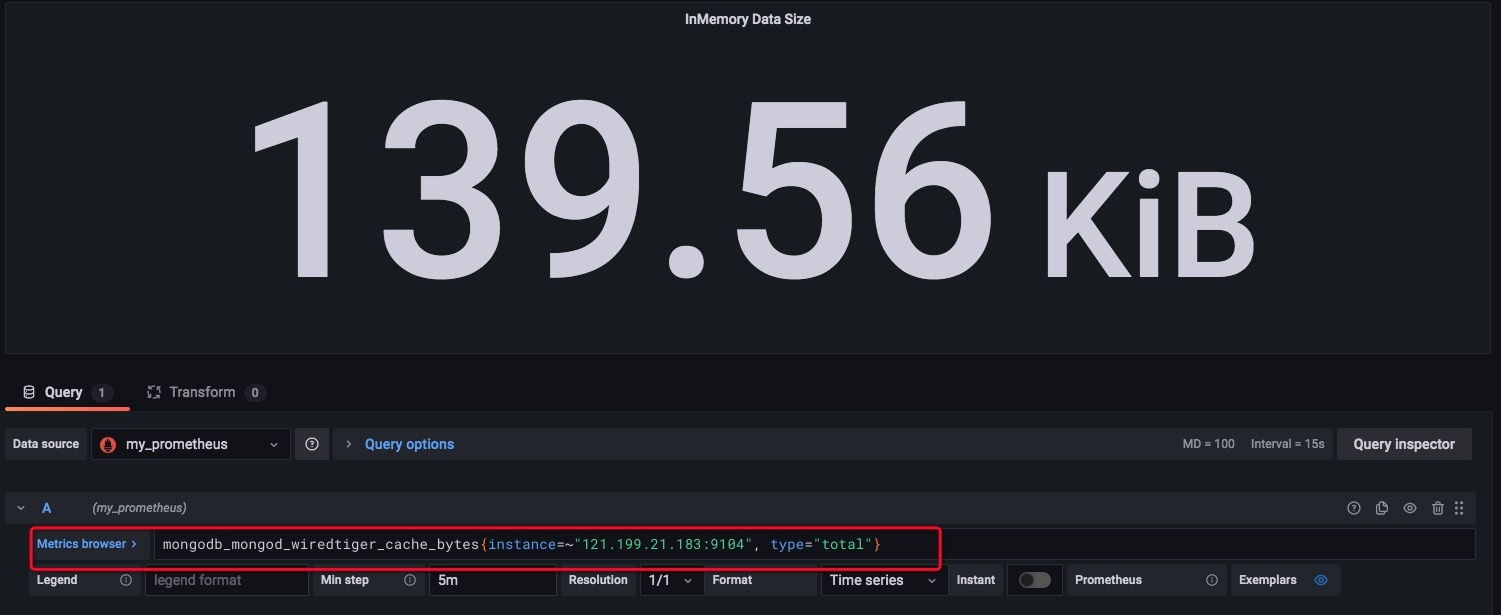
运行grafana,获取mongo模版,绑定host:9090prometheus
编辑语句即可监控
监控主机信息
docker pull prom/node-exporter
修改prometheus配置文件,导入模版