Week1 : Introduction
1A Why Social Network Analysis?
What are networks? Networks are sets of nodes connected by edges
goal: characterize network structure
¤ Are nodes connected through the network? (week )1
¤ How far apart are they? (week 1)
¤ Are some nodes more important due to their position in the network? (week 3)
¤ Is the network composed of communities? (week 4)
goal: model network formation
¤ Randomly generated networks (week 2)
¤ Preferential attachment (week 2)
¤ Small-world networks (week 5)
¤ Optimization, strategic network formation (week 5)
goal: understand how network structure affects processes
¤ information diffusion (weeks 2 & 6)
¤ opinion formation (week 6)
¤ coordination/cooperation (week 6)
¤ resilience to attack (week 2)
What about weeks 7 & 8?
¤ Week 7: cool and unusual applications of SNA
¤ Week 8: SNA and online social networks
1B Software Tools
¤ Gephi (visualization and basic network metrics)
¤ NetLogo (modeling network dynamics)
¤ iGraph (for programming assignments)
use Gephi
¤ Download from: http://gephi.org/
¤ download the datafile dining.gephi from Coursera
¤ let’s play
Gephi:
Context: node, edge
Edit: see node property
Layout: change layout
Change color of nodes
Change size of nodes
Partition-edges-labels:
Preview:
1C Degree and Connected Component
Edge: directed, undirected
Data representation:
Adjacency matrix
Edge list
Adjacency list
Strongly connected component
Weakly connected component
Giant component: as the network gets infinitely large, the giant component is still going to occupy a finite fraction of it.
1D Gephi Demo
Gephi:
Ranking-nodes-indegree: change node size according to their indegree. Spline:
Statistics: calculate Average Degree
Statistics: Connected Component
Partition: partition the nodes by strongly connected component
HW 1: a Facebook network
NetGet 用来获取facebook用户关系网
Week2 : Random Graph Models
2P intro remarks for week2
Project: peer graded
2A introduction to random graph models
Erdös-Renyi: simplest network model
Degree distribution
¤ (N,p)-model: For each potential edge we flip a biased coin
¤ with probability p we add the edge
¤ with probability (1-p) we don’t
use NetLogo
How many edges per node?
¤ Each node has (N – 1) tries to get edges
¤ Each try is a success with probability p
¤ The binomial distribution gives us the probability that a node has degree k:


一个node有k个edge的可能性B(N-1,k,p)
What is the mean?
¤ Average degree z = (n-1)*p

Week3 : Centrality
3A degree, betweenness, closeness
电影人物关系图
different notions of centrality
indegree
outdegree
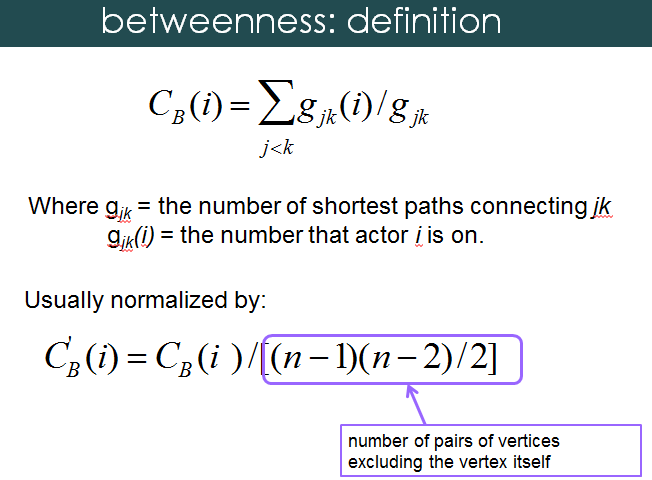
betweenness
closeness
normalization
Brokerage
betweenness: capturing brokerage
Some people have high betweenness but low degree,
Some people have high degree but low betweenness.
closeness