PKU-MMD数据集简介
官网链接:https://www.icst.pku.edu.cn/struct/Projects/PKUMMD.html
除官网提供的一些信息外,下面我再补充两点信息。
补充信息1
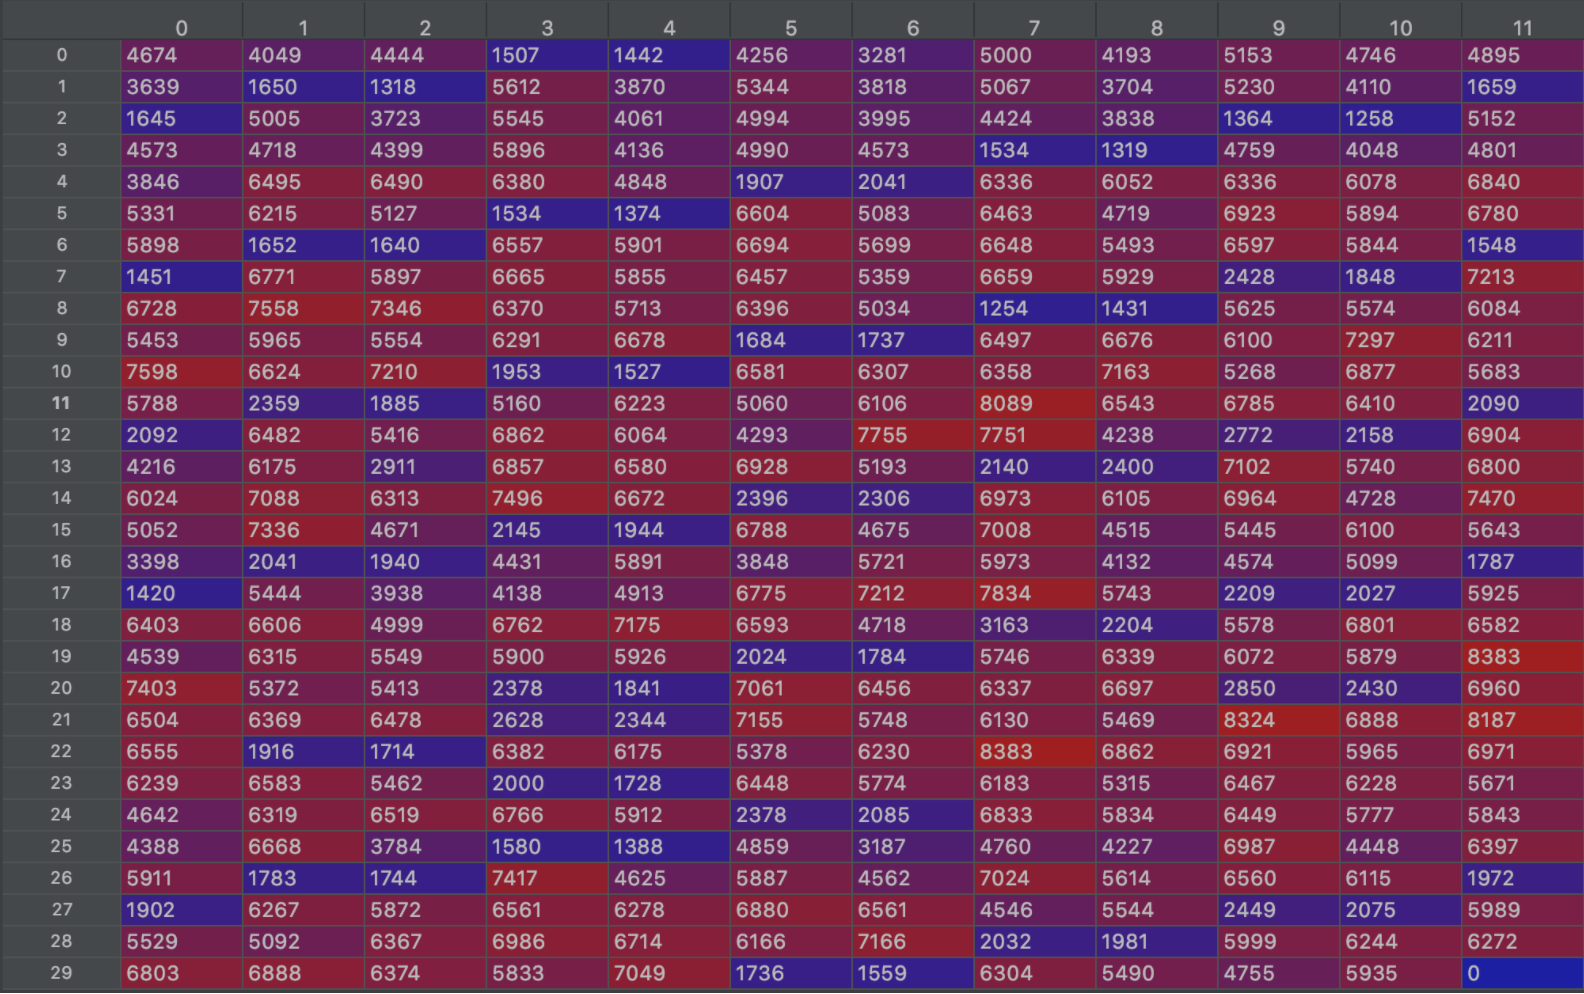
各条视频的长度,如下表,第一条视频有4674帧,第二条视频有4049帧。每一个view有359条视频,总共有1825266帧,平均每个视频有约5070帧。下表中的最后一个数字0是为了画表格而随手加上去的。

补充信息2
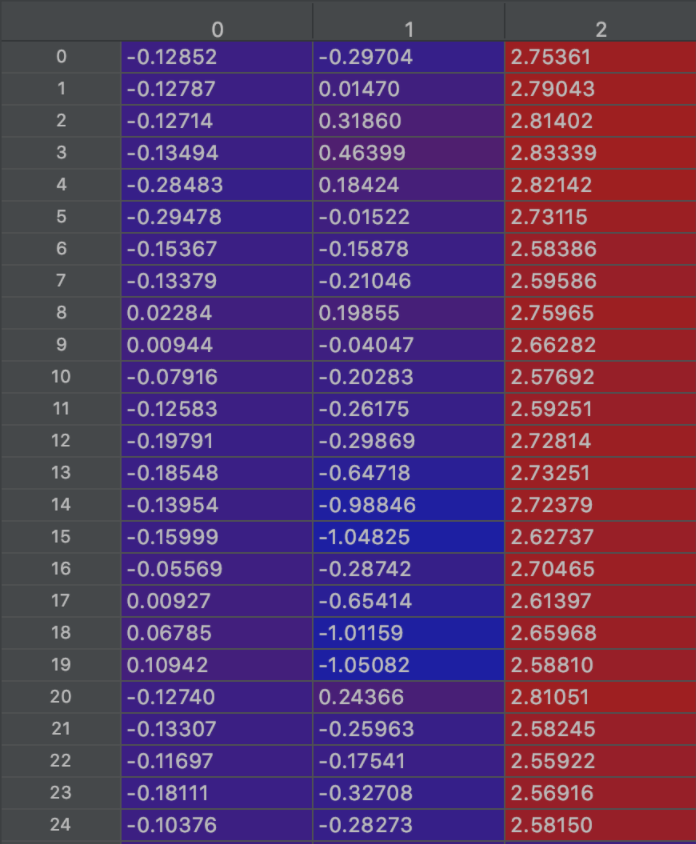
第一个视频的第一帧中,第一个人的骨架节点坐标,第一列表示x坐标,第二列表示y坐标,第三列表示z坐标:

骨架数据可视化
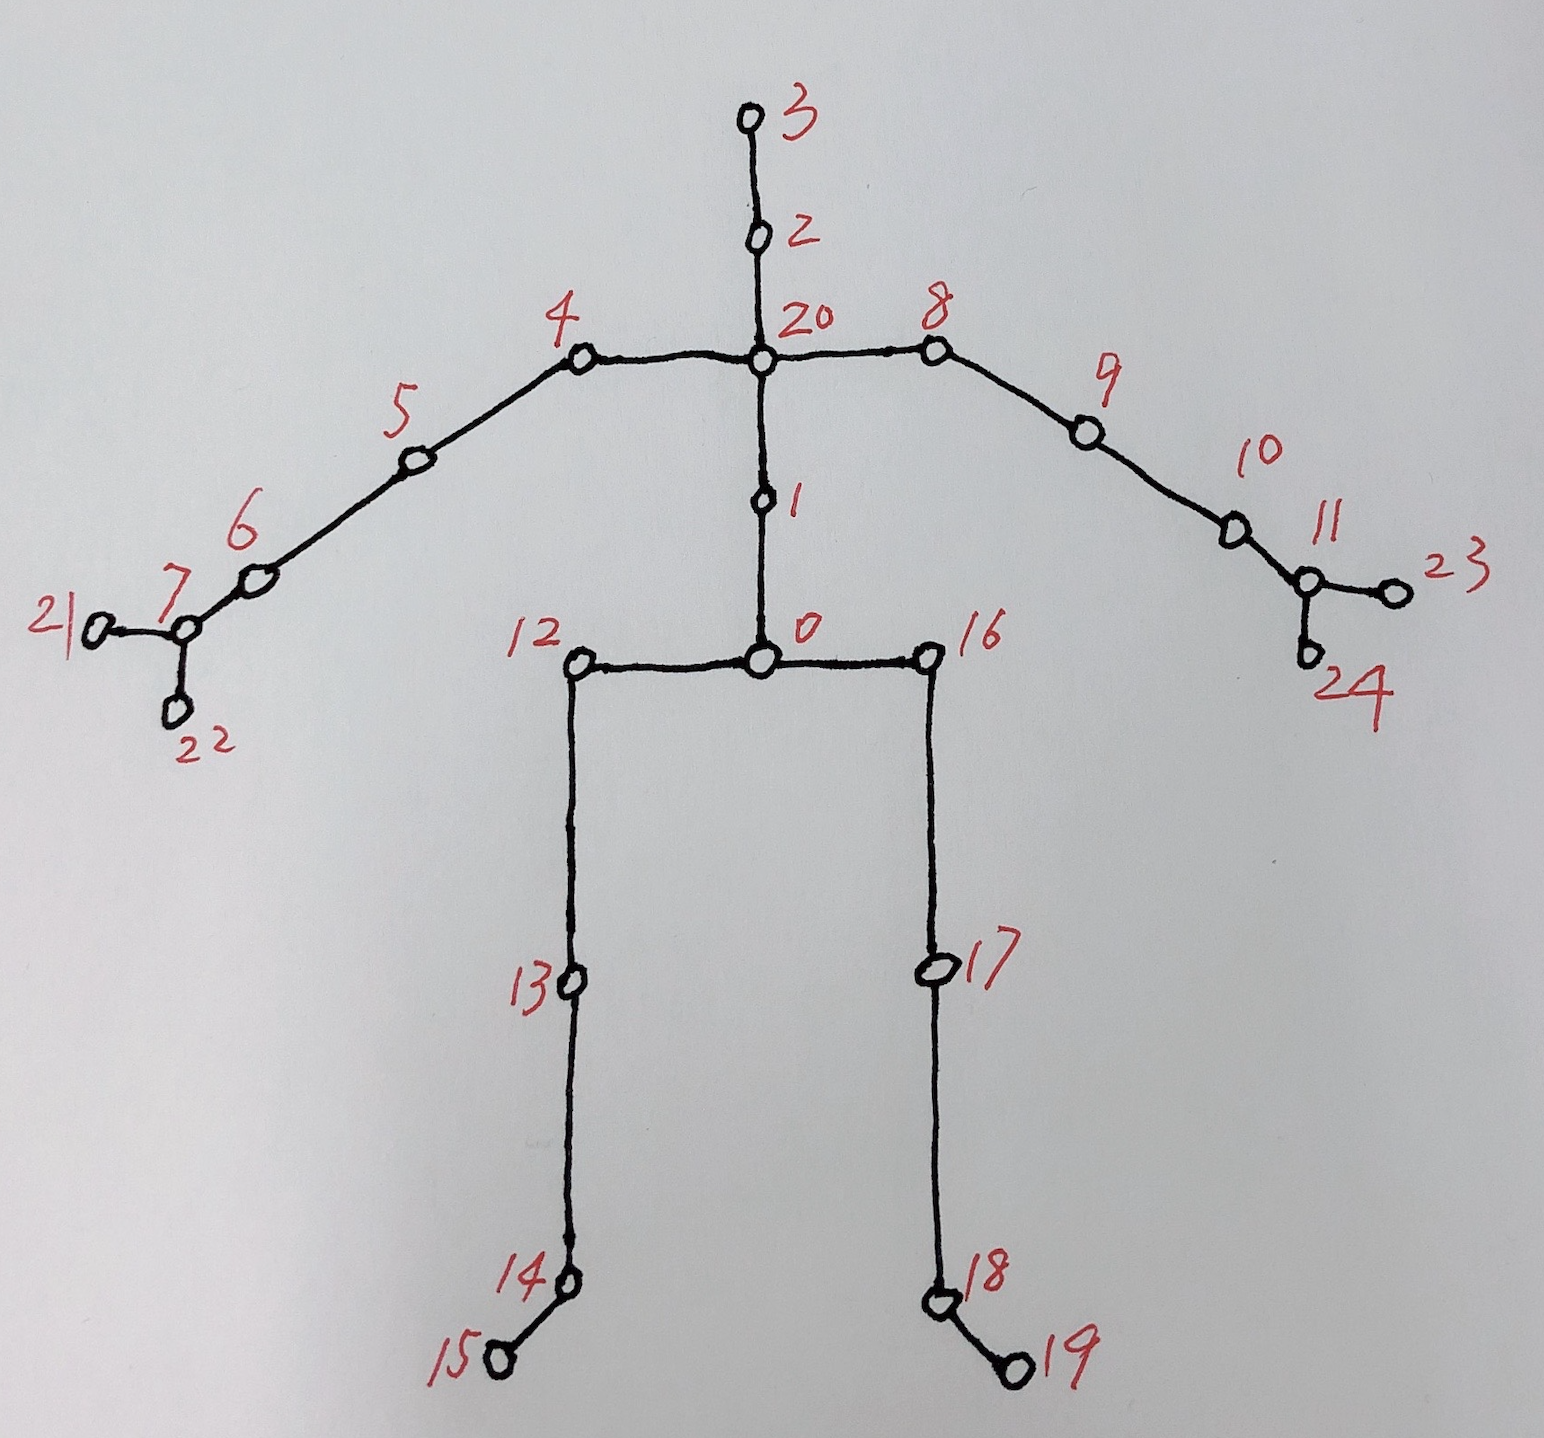
PKU-MMD数据集中数据数据顺序与各节点的对应关系如下图所示。官网上没给出这个对应关系,我通过视频和数据散点图之间来回核对,摸清了这个对应关系。

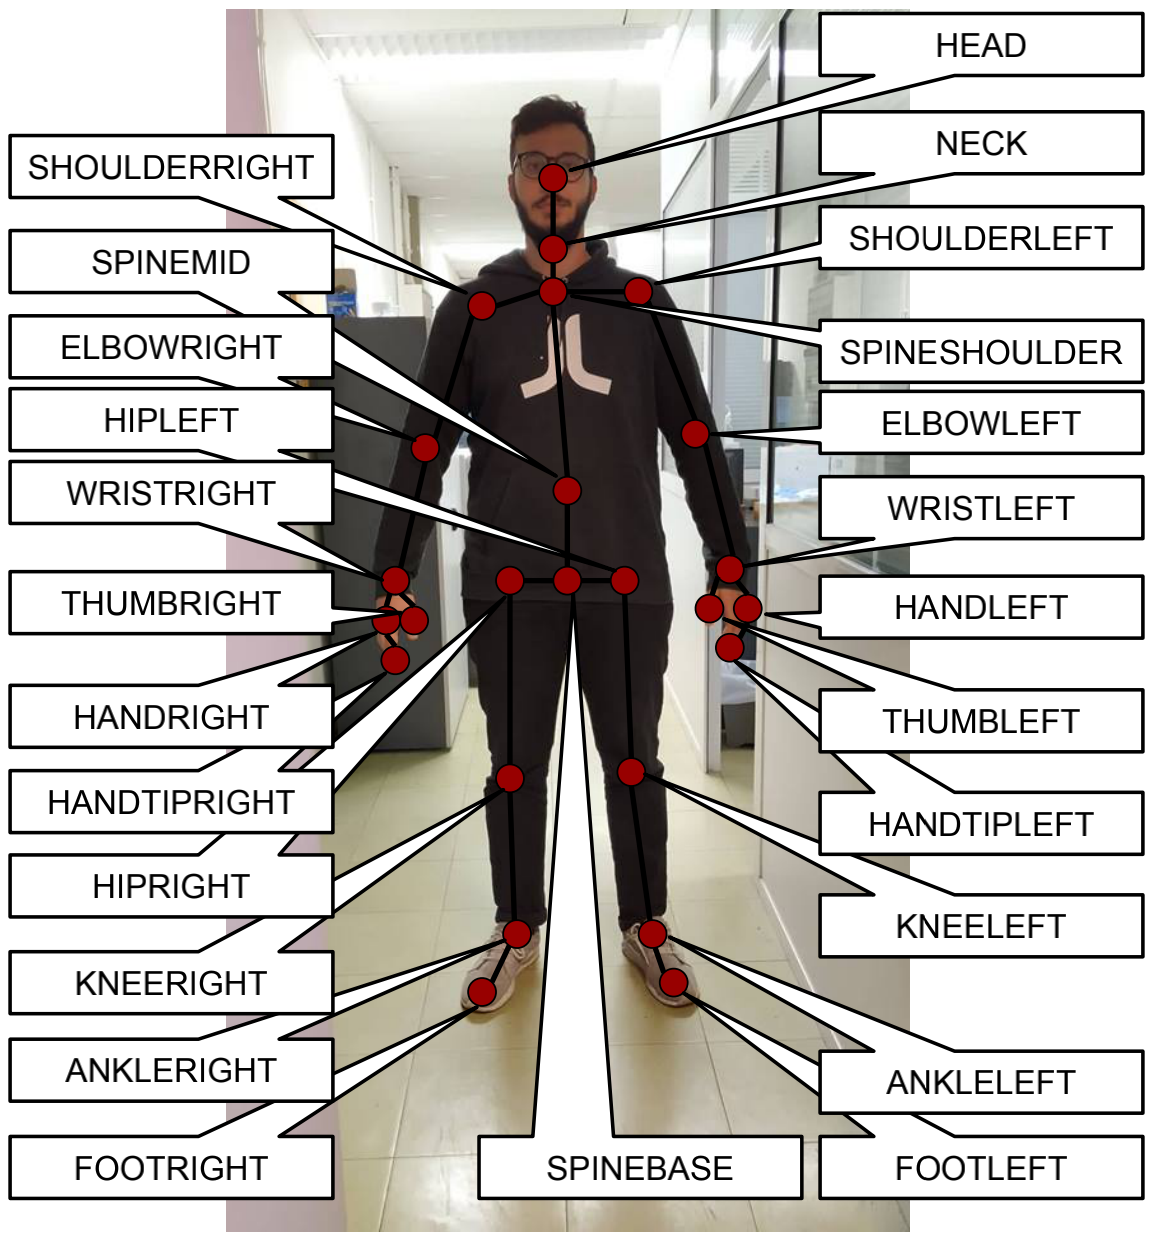
图中的骨架各节点的连接方式是通过看原论文(PKU-MMD: A Large Scale Benchmark for Continuous Multi-Modal Human Action Understanding)而画出来的,但我最近看到另外一篇论文(A Deep Learning Approach for Human Action Recognition using Skeletal Information)的画法:

这两种画法唯一的区别在手部,后者似乎更合理。但为了和原论文吻合,下面的可视化程序采用的是前者。
动态可视化程序如下:
import os
import numpy as np
import matplotlib.pyplot as plt
from mpl_toolkits.mplot3d import Axes3D

file_name = '0017-M.txt'
points = np.loadtxt(os.path.join('/Users/wangpeng/Desktop/PKU_MMD/Skeleton', file_name), dtype=np.float)
row = points.shape[0]
point = (points[:, :75]).reshape(row, 25, 3)
xmax = np.max(point[:, :, 0])
xmin = np.min(point[:, :, 0])
ymax = np.max(point[:, :, 1])
ymin = np.min(point[:, :, 1])
zmax = np.max(point[:, :, 2])
zmin = np.min(point[:, :, 2])

# 读取标签
num_classes = 52   # number of classes
gt_array = np.loadtxt(os.path.join('/Users/wangpeng/Desktop/PKU_MMD/Label', file_name), dtype=np.int, delimiter=',')
label = np.ones([row, ], dtype=np.int) * (num_classes - 1)   # 0~50th is the original ground truth. The 51st class is the background.
for i in range(gt_array.shape[0]):
    label[gt_array[i, 1]-1: gt_array[i, 2]-1] = gt_array[i, 0] - 1   # 末尾的-1是为了让标签从0开始

# 相邻各节点列表,用来画节点之间的连接线
arm = [21, 7, 6, 5, 4, 20, 8, 9, 10, 11, 23]
rightHand = [22, 7]
leftHand = [24, 11]
bodyLeg = [3, 2, 20, 1, 0, 12, 13, 14, 15]
leftLeg = [0, 16, 17, 18, 19]

# 2D展示------------------------------------------------------------------------
n = 0   # 从第n帧开始展示
m = 1   # 到第m帧结束,n<m<row
plt.figure()
plt.ion()
for i in range(n, m):
    plt.cla()
    plt.scatter(point[i, :, 0], point[i, :, 1], c='red', s=40.0)
    plt.plot(point[i, arm, 0], point[i, arm, 1], c='green', lw=2.0)
    plt.plot(point[i, rightHand, 0], point[i, rightHand, 1], c='green', lw=2.0)
    plt.plot(point[i, leftHand, 0], point[i, leftHand, 1], c='green', lw=2.0)
    plt.plot(point[i, bodyLeg, 0], point[i, bodyLeg, 1], c='green', lw=2.0)
    plt.plot(point[i, leftLeg, 0], point[i, leftLeg, 1], c='green', lw=2.0)
    plt.text(xmax-0.8, ymax-0.2, 'frame: {}/{}'.format(i, row))
    plt.text(xmax-0.8, ymax-0.4, 'label: ' + str(label[i]))
    plt.xlim(xmin, xmax)
    plt.ylim(ymin, ymax)
    plt.pause(0.01)

plt.ioff()
plt.show()


# 3D展示------------------------------------------------------------------------
#n = 1100   # 从第n帧开始展示
#m = 1200   # 到第m帧结束,n<m<row
#fig = plt.figure()   # 先生成一块画布,然后在画布上添加3D坐标轴
#plt.ion()
#for i in range(n, m):
#    fig.clf()
#    ax = Axes3D(fig)
#    ax.scatter(point[i, :, 0], point[i, :, 1], point[i, :, 2], c='red', s=40.0)
#    ax.plot(point[i, arm, 0], point[i, arm, 1], point[i, arm, 2], c='green', lw=2.0)
#    ax.plot(point[i, rightHand, 0], point[i, rightHand, 1], point[i, rightHand, 2], c='green', lw=2.0)
#    ax.plot(point[i, leftHand, 0], point[i, leftHand, 1], point[i, leftHand, 2], c='green', lw=2.0)
#    ax.plot(point[i, bodyLeg, 0], point[i, bodyLeg, 1], point[i, bodyLeg, 2], c='green', lw=2.0)
#    ax.plot(point[i, leftLeg, 0], point[i, leftLeg, 1], point[i, leftLeg, 2], c='green', lw=2.0)
#    ax.text(xmax-0.8, ymax-0.2, zmax-0.2, 'frame {}/{}'.format(i, row))
#    ax.text(xmax-0.8, ymax-0.4, zmax-0.4, 'label: ' + str(label[i]))
#    ax.set_xlabel("X")
#    ax.set_ylabel("Y")
#    ax.set_zlabel("Z")
#    ax.set_xlim(xmin, xmax)
#    ax.set_ylim(ymin, ymax)
#    ax.set_zlim(zmin, zmax)
#    plt.pause(0.01)
#
#plt.ioff()
#plt.show()
下面只展示第一帧:
