【2】 混淆矩阵-百度百科
【3】 Python中生成并绘制混淆矩阵(confusion matrix)
【4】 使用python绘制混淆矩阵(confusion_matrix)
示例:
Python画混淆矩阵程序示例,摘自【4】。
from sklearn.metrics import confusion_matrix
import matplotlib.pyplot as plt
import numpy as np
def plot_confusion_matrix(cm, labels, title='Confusion Matrix'):
plt.imshow(cm, interpolation='nearest', cmap='Blues')
plt.title(title)
plt.colorbar()
xlocations = np.array(range(len(labels)))
plt.xticks(xlocations, labels, rotation=90)
plt.yticks(xlocations, labels)
plt.ylabel('True label')
plt.xlabel('Predicted label')
label = ["ant", "bird", "cat"]
tick_marks = np.array(range(len(label))) + 0.5
y_true = [2, 0, 2, 2, 0, 1]
y_pred = [0, 0, 2, 2, 0, 2]
cm = confusion_matrix(y_true, y_pred)
np.set_printoptions(precision=2)
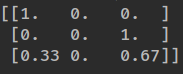
cm_normalized = cm.astype('float') / cm.sum(axis=1)[:, np.newaxis]
print(cm_normalized)
plt.figure(figsize=(12, 8), dpi=120)
ind_array = np.arange(len(label))
x, y = np.meshgrid(ind_array, ind_array)
for x_val, y_val in zip(x.flatten(), y.flatten()):
c = cm_normalized[y_val][x_val]
if c > 0.0:
plt.text(x_val, y_val, "%0.2f" % (c,), color='red', fontsize=17, va='center', ha='center')
# offset the tick
plt.gca().set_xticks(tick_marks, minor=True)
plt.gca().set_yticks(tick_marks, minor=True)
plt.gca().xaxis.set_ticks_position('none')
plt.gca().yaxis.set_ticks_position('none')
plt.grid(True, which='minor', linestyle='-')
plt.gcf().subplots_adjust(bottom=0.15)
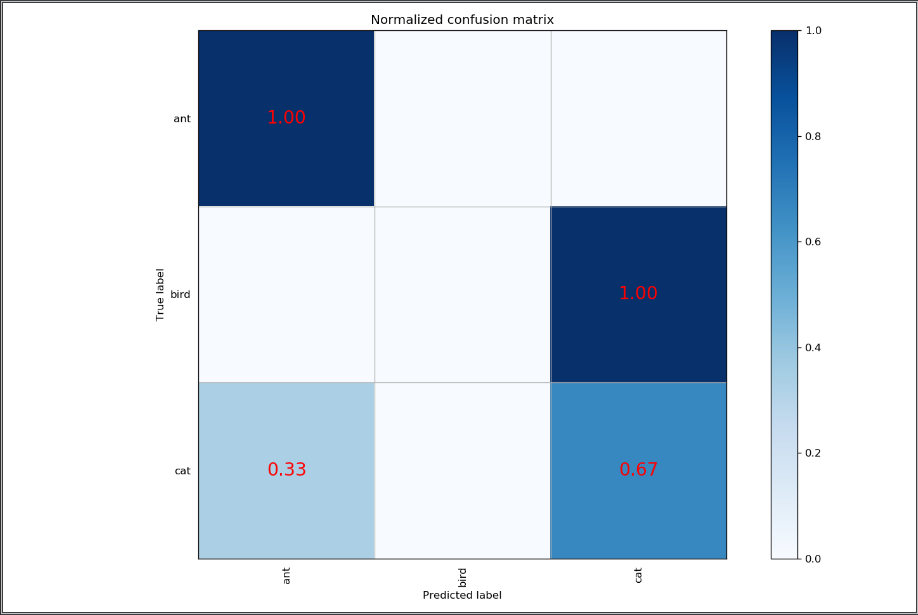
plot_confusion_matrix(cm_normalized, label, title='Normalized confusion matrix')
# plt.savefig('../Data/confusion_matrix.png', format='png')
plt.show()
运行结果: