<div class="chart-bar-left" id= "chartbar-left" style="margin-top:1%;">
v-chart :options="optionPieleft" class="chart-pie-left"/>
</div>
<script>
//添加引用
import ECharts from "vue-echarts";
import "echarts/lib/component/polar";
// 引入提示框和标题组件
import "echarts/lib/component/tooltip";
import "echarts/lib/component/title";
//引用legend组件
import "echarts/lib/component/legend";
//引入饼图
import "echarts/lib/chart/pie";
var placeHolderStyle = {
ormal: {
color: 'rgba(44,59,70,1)', // 未完成的圆环的颜色
label: {
show: false
},
labelLine: {
show: false
}
},
emphasis: {
color: 'rgba(44,59,70,1)' // 未完成的圆环的颜色
}
};
var linear_color_left = {
type: 'linear',
x: 0,
y: 0,
x2: 0,
y2: 1,
colorStops: [{
offset: 0,
color: '#0986e8'
}, {
offset: 1,
color: '#4cd8f4'
}]
};
export default {
components: {
"v-chart": ECharts
},
name: 'Dashboard',
data(){
return{
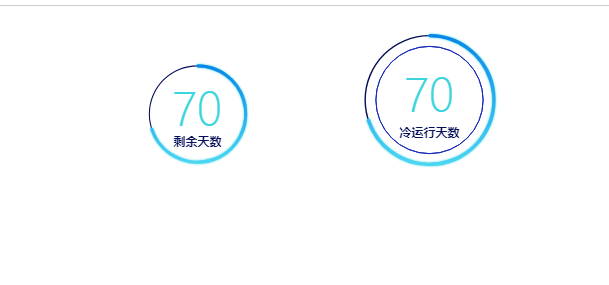
optionPie : {
backgroundColor: '#FFFFFF',
title: {
text: "冷运行天数",
textStyle: {
color: '#050f58',
fontSize: 12,
},
left: 'center',
top:'98'
},
series: [{
//最里圈圆环
type: 'pie',
radius: ['75%', '75%'],
silent: true,
itemStyle: {
normal: {
labelLine: {
show: false
}
}
},
data: [{
value: 1,
itemStyle: {
normal: {
color: '#050f58',
borderColor: '#162abb',
//borderWidth: 1,
//shadowBlur: 5,
shadowColor: 'rgba(21,41,185,.75)'
}
}
}]
},{
type: 'pie',
radius: ['89%', '91%'],
silent: false,
label: {
normal: {
show: false,
}
},
data: [{
value: 1,
itemStyle: {
normal: {
color: '#050f58',
barBorderRadius: 30,
// shadowBlur: 50,
shadowColor: 'rgba(21,41,185,.75)'
}
}
}]
}, {
name: '占比',
type: 'pie',
radius: ['89%', '91%'],
hoverAnimation: false,
data: [{
value: 70, //已完成
show: false,
label: {
normal: {
formatter: '{d}',
position: 'center',
show: true,
textStyle: {
fontSize: '45',
fontWeight: '200',
color: '#3dd4de',
margin:'00',
}
}
},
itemStyle: {
normal: {
color: linear_color_left,
shadowColor: '#3dd4de',
shadowBlur: 2,
borderWidth: 2,
borderColor:linear_color_left
}
}
}, {
value: 30,//剩余
show: false,
itemStyle: {
normal: {
barBorderRadius: 50,
color: 'rgba(10,9,86,0)', // 未完成的圆环的颜色
label: {
show: false
},
labelLine: {
show: false
}
},
}
}]
}]
},
}
}
}
</script>
画完张这样