import numpy as np
import pandas as pd
import matplotlib.pyplot as plt  # 约定俗成 起别名 plt

# 会出现警告,不是错
D:UsersoldboyAnaconda3libimportlib\_bootstrap.py:219: RuntimeWarning: numpy.ufunc size changed, may indicate binary incompatibility. Expected 192 from C header, got 216 from PyObject
  return f(*args, **kwds)
配置
# windows下好使
# 防止中文乱码
plt.rcParams['font.sans-serif'] = ['SimHei']
plt.rcParams['axes.unicode_minus'] = False
小例子
# 画一个简单的折线图
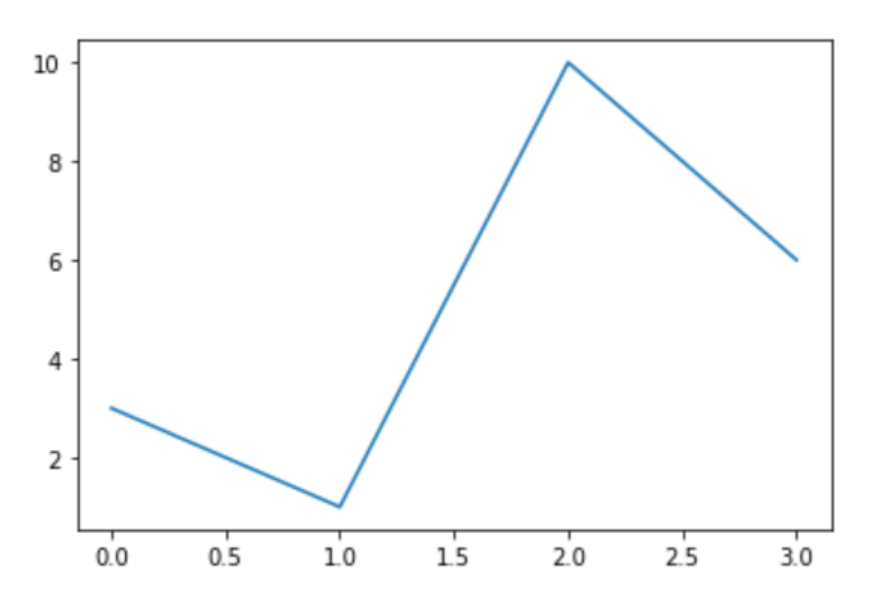
a = [3,1,10,6]  # 默认显示Y轴的值
plt.plot(a)   # plot()画折现图的函数
plt.show()   # 显示画的图表
结果:
曲线图
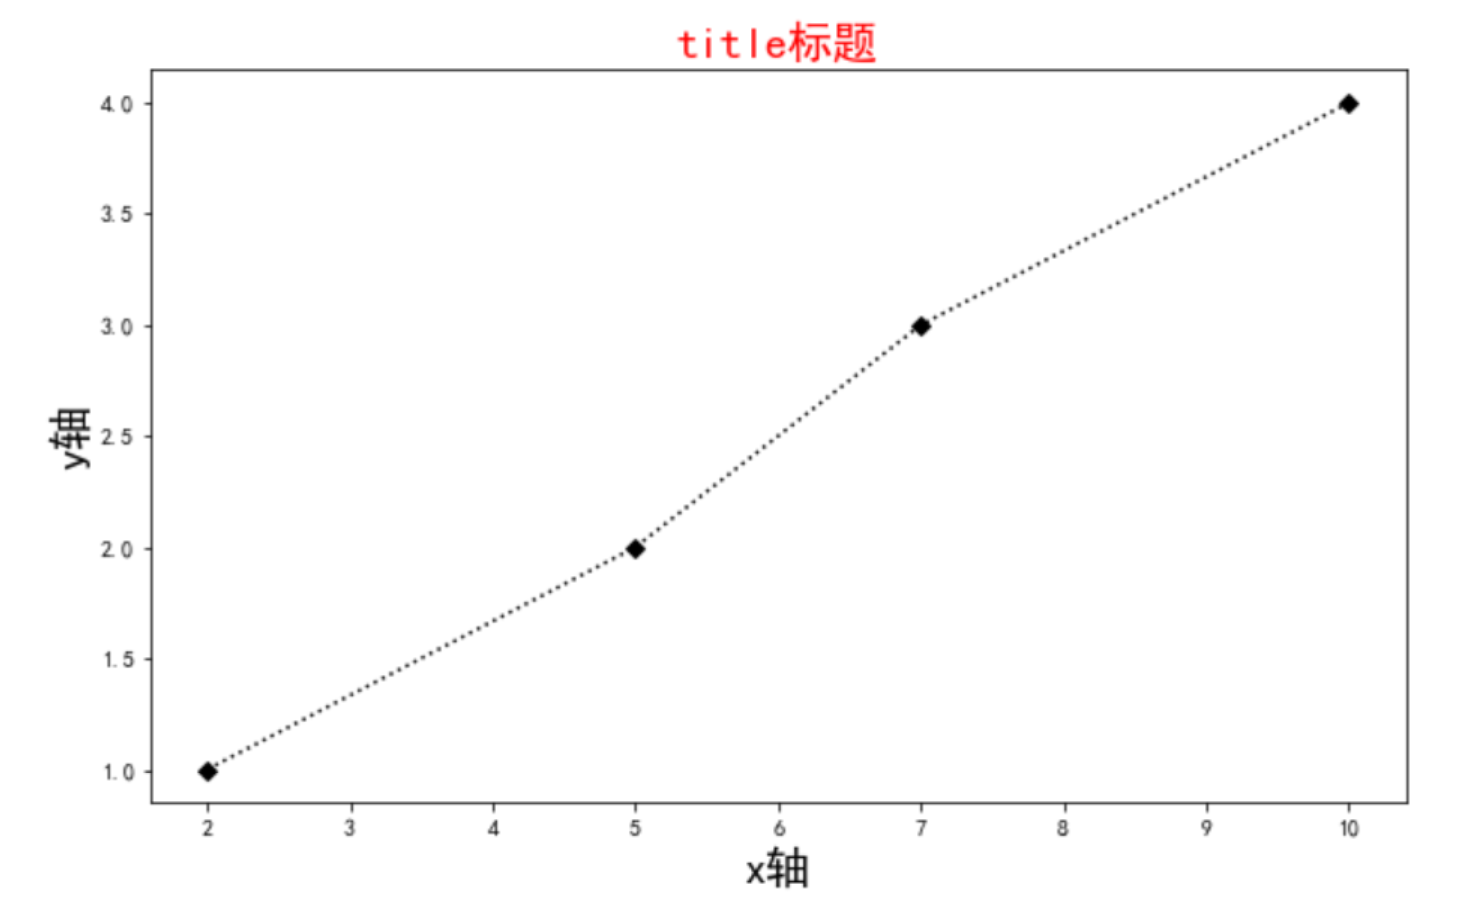
x = [2,5,7,10]
y = [1,2,3,4]

plt.figure(figsize=(10,6))  # 设置画布大小

plt.title('title标题', fontsize=20, color='red')  # 设置图表的标题
plt.xlabel('x轴', fontsize=20)   # 设置x轴的信息
plt.ylabel('y轴', fontsize=20)   # 设置y轴的信息

plt.plot(x, y, color='k', marker='D', linestyle=':')   # 画图(颜色、标记点,线条样式)
plt.show()  # 显示
结果:
柱状图的绘制
import pandas as pd
import matplotlib.pyplot as plt

df = pd.read_csv('./douban_movie.csv')  # 读取数据
df.head()  # 显示前5条
# df.tail()  # 显示后5条
展示:

# 继续操作,以‘产地’为分组依据
res = df.groupby('产地').size().sort_values(ascending=False)  # size() 可以获取值的大小
# sort_values 按照值进行排序  sort_index 按照索引进行排序
res  # 查看 res
展示:

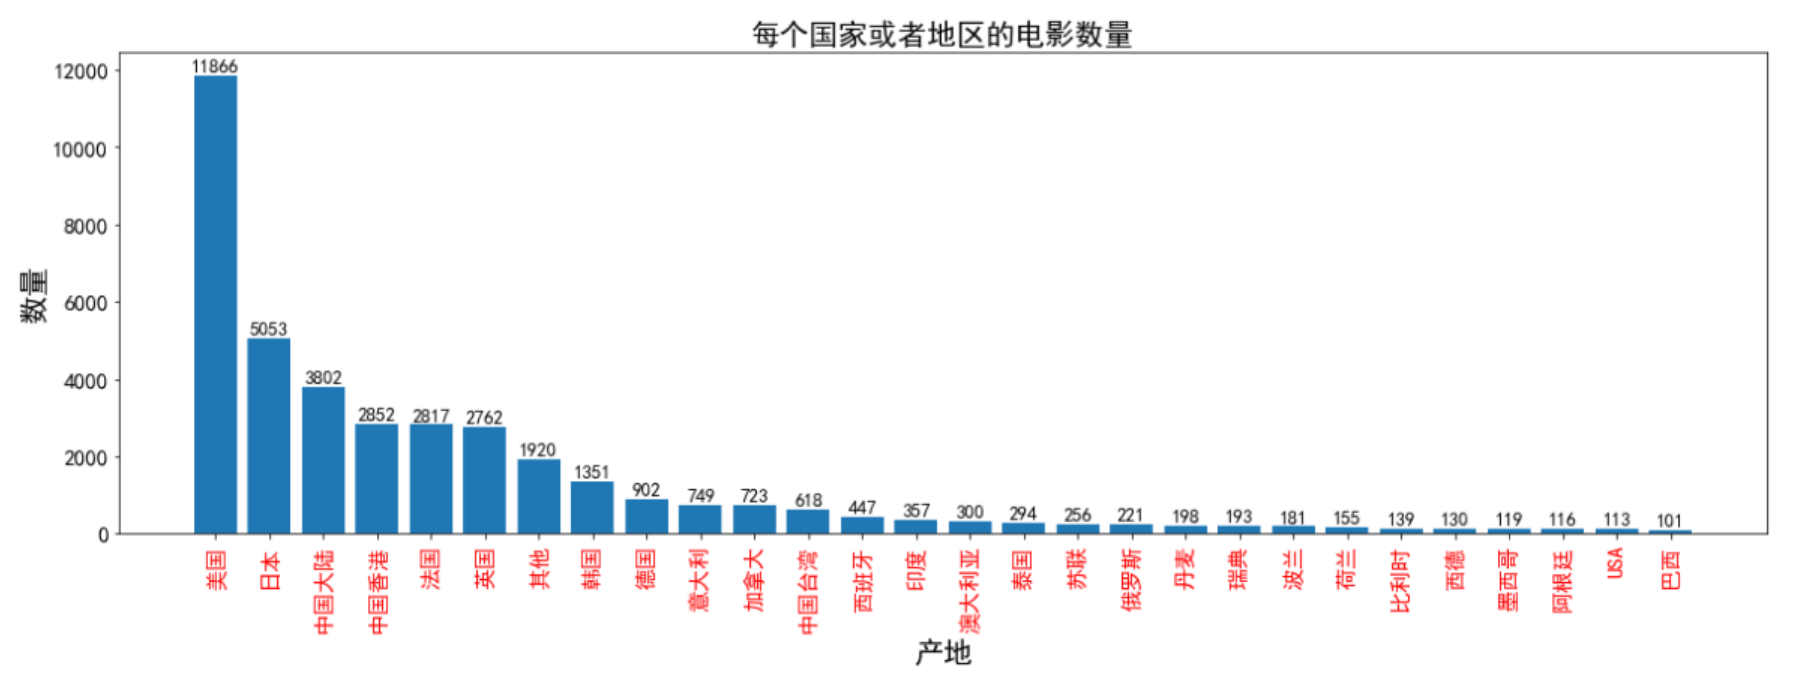
# 绘图
x = res.index
y = res.values
plt.figure(figsize=(20,6))

plt.title('每个国家或者地区的电影数量', fontsize=20)

plt.xticks(rotation=90, fontsize=15, color='red')  # 设置x轴字体的角度、大小和颜色
plt.xlabel('产地', fontsize=20)  # x 轴标注信息

plt.yticks(fontsize=15)
plt.ylabel('数量', fontsize=20)

for a, b in zip(x,y):  # 显示数据文本
    plt.text(a, b+100, b, horizontalalignment='center', fontsize=13)
    # 分别为:x轴位置, y轴位置, 文本位置, 文本字体

plt.bar(x, y)  # 表示绘制柱状图
# plt.savefig  # 保存图
plt.show()
结果:
饼图的绘制
根据电影的长度绘制饼图
# 知识点补充
pd.cut(np.array([1, 7, 5, 4, 6, 3]), [1,3,5])
# 结果:
[NaN, NaN, (3.0, 5.0], (3.0, 5.0], NaN, (1.0, 3.0]]
Categories (2, interval[int64]): [(1, 3] < (3, 5]]
'''
规则:将ndarray数据以1,3,5位分割点进行对比,在区间内就显示该区间,不在则显示nan
'''
----------------------------------------------------------------------------
import pandas as pd
import matplotlib.pyplot as plt

df = pd.read_csv('./douban_movie.csv')  # 读取数据
df_res = df['时长']
df_res  # 查看
展示:
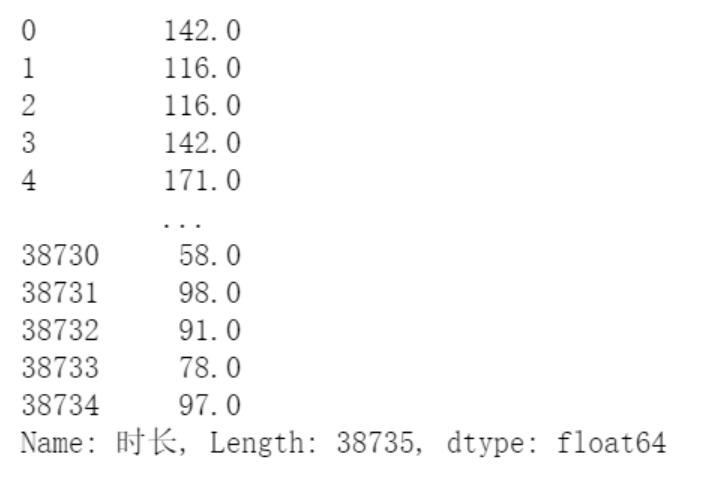
# df_res 是待分割的源数据  [0,60,90,120, 140, 1000] 是区间 左开右闭
res = pd.cut(df_res, [0,60,90,120, 140, 1000])
res  # 查看res
展示:

res = res.value_counts()  # 统计
-----------------------------------------------------------------------------
# 结果:
(90, 120]      16578
(0, 60]        10324
(60, 90]        7727
(120, 140]      2718
(140, 1000]     1386
Name: 时长, dtype: int64
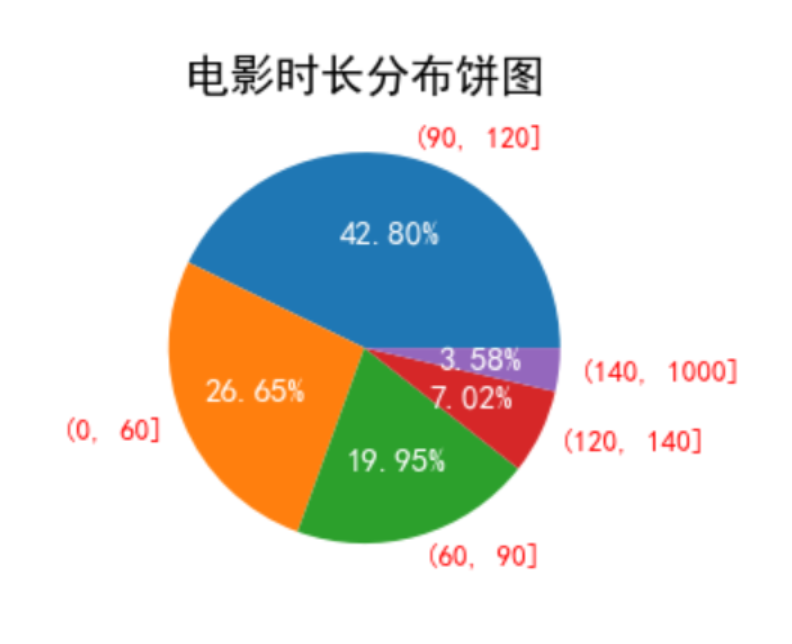
# 绘制饼图
x = res.index
y = res.values
plt.title('电影时长分布饼图', fontsize=20)

l_text, p_text = plt.pie(y, labels = x, autopct='%.2f%%')  # l_text, p_text都是多个值的列表

for p in p_text:
    p.set_size(15)  # 设置图内的文本大小
    p.set_color('white')   # 设置图内的文本颜色

for l in l_text:
    l.set_size(13)  # 设置标签(图外)的文字大小
    l.set_color('r')  # 设置标签(图外)的文字颜色

plt.show()
结果:
